Assessment of pipeline stability in the Gulf of Mexico during hurricanes using dynamic analysis
2015-11-21YinghuiTinBssemYoussefMrkCssidy
Yinghui Tin,Bssem Youssef,Mrk J.Cssidy,∗
aCentre for Offshore Foundation Systems and ARC CoE for Geotechnical Science and Engineering,University of Western Australia,35 Stirling Highway,Crawley,WA 6009,Australia
bAtteris,Level 3,220 St Georges Terrace,Perth,WA,6000,Australia
Assessment of pipeline stability in the Gulf of Mexico during hurricanes using dynamic analysis
Yinghui Tiana,Bassem Youssefb,Mark J.Cassidya,∗
aCentre for Offshore Foundation Systems and ARC CoE for Geotechnical Science and Engineering,University of Western Australia,35 Stirling Highway,Crawley,WA 6009,Australia
bAtteris,Level 3,220 St Georges Terrace,Perth,WA,6000,Australia
Article history:
Received 23 October 2014
Accepted 9 January 2015
Available online 25 February 2015
Pipeline
On-bottom stability
Dynamic lateral stability analysis
Force-resultant model
大力宣传民事法律知识,增强民众的法律常识,以图文并茂、浅显易懂的方式宣传《最高人民法院关于审理民间借贷案件适用法律若干问题的规定》等法律法规中规范民间借贷原则、禁止性规定、限定利率的有关规定,引导民众自觉抵制非法借贷行为。宣传“反套路”技巧,提高民众依法办事、依法维权的能力,提醒民众在遭遇套路陷阱时及时止损,尽可能保存所有相关证据,第一时间向公安机关寻求帮助;在遭遇暴力催收时保持冷静,及时报警举证,避免同“套路贷”犯罪分子暴力对抗,有条件情况下提前做好预防措施和取证工作;面对虚假民事诉讼案件时及时出庭说明情况,提交有力证据,同时向公安机关报案,维护自身合法权益。
Hydrodynamic load
Pipelines are the critical link between major offshore oil and gas developments and the mainland.Any inadequate on-bottom stability design could result in disruption and failure,having a devastating impact on the economy and environment.Predicting the stability behavior of offshore pipelines in hurricanes is therefore vital to the assessment of both new design and existing assets.The Gulf of Mexico has a very dense network of pipeline systems constructed on the seabed.During the last two decades,the Gulf of Mexico has experienced a series of strong hurricanes,which have destroyed,disrupted and destabilized many pipelines.This paper first reviews some of these engineering cases.Following that,three case studies are retrospectively simulated using an in-house developed program.The study utilizes the offshore pipeline and hurricane details to conducta Dynamic LateralStability analysis,with the results providing evidence as to the accuracy of the modeling techniques developed.
©2015 The Authors.Published by Elsevier Ltd on behalf of The Chinese Society of Theoretical and Applied Mechanics.This is an open access article under the CC BY-NC-ND license(http:// creativecommons.org/licenses/by-nc-nd/4.0/).
Introduction The Gulf of Mexico is a small oceanic basin surrounded by continental land masses and a relatively simple and roughly circular structure approximately 1500 km in diameter[1]. As shown in Fig.1,the Gulf of Mexico basin resembles a large pit with a broad shallow rim.Approximately 38%ofthe Gulfcomprises shallow and intertidal areas(<20 m deep).The area of the continentalshelf(<180 m)and continentalslope(180-3000 m)are 22% and 20%of the total area,respectively.Abyssal areas deeper than 3000 m make up the final 20%[2].The northeast Gulf of Mexico is the region with the most reported damaged pipelines.This region extends fromeast ofthe MississippiDelta near Biloxito the eastern side of Apalachee Bay.The majority of this region is characterized by soft sediments[3].
Five hurricanes hit the Gulf of Mexico between 1992 and 2005: Andrew in 1992,Lili in 2002,Ivan in 2004,Katrina and Rita in 2005 and their paths are shown in Fig.1.These hurricanes caused severe destruction and the economic loss is estimated to be worth 75 billion US dollars due to Katrina alone[4].Table 1 summarizes destruction of the 5 hurricanes.The majority of the pipeline failures are in areas perpendicular to the maximum current and in water depths less than 60 m.Large displacements of pipelines have been highlighted by Gagliano[5]and this agrees with the reported data in Table 1.For example,an 18 inch(0.457 m)unburied oil pipeline with a specific gravity of1.6 drifted southward 910 m from its originallocation during Hurricane Ivan.During Hurricane Katrina,a 26 inch(0.66 m)buried gas pipeline with a specific gravity of 1.4 in a water depth of 15 m was displaced about 1219 m to the north over 14.5 kmofits length.A sonar survey after Hurricane Ivan presented in Thomson et al.[6]revealed that an 18 inch(0.457 m)pipeline,approximately 44.25 km long,that ran from an oil gathering platform westward to near the Mississippi River Delta was found displaced by 580 m.In addition,approximately 100 pipeline failures due to hurricanes were reported from1971 to 1988,whereas about 600 cases of pipeline damage were reported after Hurricanes Katrina and Rita in 2005[7].
Pipeline on-bottom stability assessment post Hurricane Ivan After the enormous destruction to the offshore oil and gas facilities by Hurricane Ivan,many research publications assessed and reviewed the design of the damaged pipelines[4,7-12]. As reported by Det Norske Veritas(DNV)[7],three on-bottom pipeline stability studies were conducted to modelpipelines under Hurricane Ivan using the PONDUS software[13].In the analysis,the pipelines were assumed to be oriented perpendicular to the path of Hurricane Ivan.Table 2 summarizes the input parameter values used in the PONDUS simulations and the pipeline displacements measured in the field.In the first two cases,pipelines experienced massive lateral displacements of 914 m and 518 m,respectively,and the third pipeline case did not experience any displacement under Hurricane Ivan.The numerical simulation predicted that all three pipeline cases would experience lateral movement,1446 m,628 m,and 254 m,respectively.It is clear that PONDUS overestimated the pipeline displacement of the three pipeline cases.
In-house developed dynamic finite element program Tian and Cassidy[14-16]and Tian et al.[17]developed an integrated fluid-pipe-soil modeling Dynamic Lateral Stability package.Dynamic Lateral Stability analysis is considered to be the most comprehensive method because a complete three-dimensional pipeline simulation can be performed for any given combination of waves and currents in time domain analysis(see DNV[18]for details).This in-house package adopted advanced plasticity pipe-soil force-resultant models[19-22]and Fourier hydrodynamic load models[23]to evaluate soil resistance and hydrodynamic loading,respectively.The commercially available finite element package ABAQUS/Standard was used(implicit analysis),with modules for pipe-soil interactions and hydrodynamic loading implemented as user subroutines UEL and DLOAD,respectively(see Dassault System for technical details[24]).
The pipe-soil interaction module implements available forceresultant models on calcareous sand[19-21]and clay soil[22]as ABAQUS user-defined elements through the user subroutine UEL. Figure 2 illustrates the symbolic convention for loading acting on a segment of a pipeline.The vertical component of the resultant force is V=Ws-Fv,where Wsis the pipeline submerged weight and Fvis the vertical hydrodynamic loading.The horizontal component is H=FH,where FHis the horizontal hydrodynamic loading.Most available pipe-soil interaction models are based on the simplistic Coulomb friction concept[25-27]and link H directly to V through only one simplistic friction factor.More advanced force-resultant models have been presented in the last decade,allowing a more fundamental understanding of pipe-soil behavior by relating the resultantforces(V,H)directly to the corresponding displacement(w,u)within a plasticity framework.Schotman and Stork[28]initially proposed the force-resultant concept to pipe-soil modeling.Subsequently,other fully developed forceresultant pipe-soil models have been presented by Zhang[19],Zhang et al.[20],Calvetti et al.[29],Di Prisco et al.[30],Hodder and Cassidy[22],Tian et al.[21],and Tian and Cassidy[16]through experimental and numerical studies.Among these,Hodder and Cassidy[22]conducted centrifuge testing at 50g with a pipeline model 0.5 m in diameter and 2.5 m in length in prototype.The tested soil samples of kaolin clay were commercially available but can well represent the undrained behavior of clayey soil.Theseforce-resultant models provide an understanding of the complex pipe-soil behavior with a more fundamental theoretical basis. Based on strain hardening plasticity theory,the force-resultant model has a yield surface to describe the allowable resultant force(V,H).See Fig.3,the yield surface size V0,is directly related to the vertical plastic embedment wpin a hardening law to describe the expansion/shrinkage.See Hodder and Cassidy[22]for details about the model and refer to Tian and Cassidy[15],Tian et al.[17]for the detailed introduction of the development of the Dynamic Lateral Stability package.

Table 1Summary of the 5 hurricanes in the Gulf of Mexico.

Table 2Three pipeline analysis cases in DNV[7].
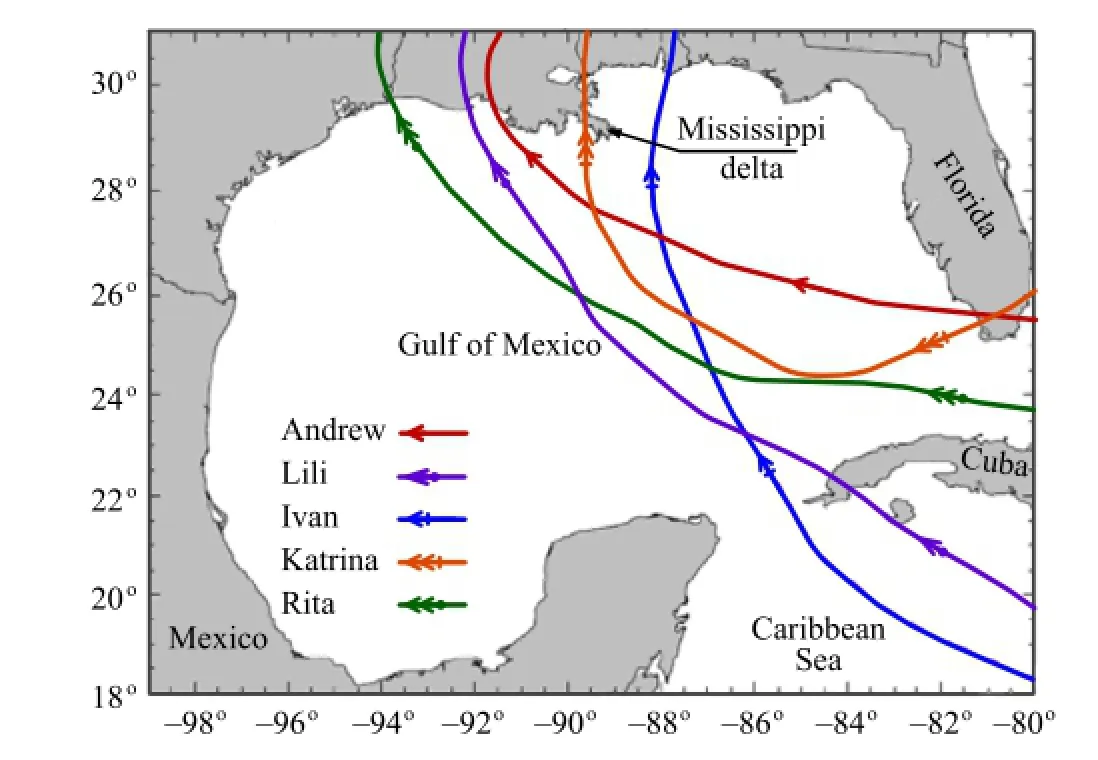
Fig.1.Gulf of Mexico location and the path of the main hurricanes.
In the hydrodynamic loading calculation module,a threedimensional ocean surface is first generated using a wave spectrum(significant wave height Hsand peak time period Tp)and spreading function.The water particle velocity and acceleration are then evaluated at the pipeline level,or,alternatively,input velocity and acceleration time series are accepted by the program. The Fourier model developed by Sorenson et al.[23]was adopted to calculate the hydrodynamic loading on the pipeline.More advanced than the traditional Morison equation(which is based on ambient flow velocity and time-invariant coefficients),the Fourier models are proven to have better accuracy for the prediction of time-variable hydrodynamic forces on a subsea pipeline[31-34]. The Fourier model uses a composition of harmonic sine waves,9 for regular wave and 5 for irregular wave,to calculate the drag force FDand lift FLon a pipeline.The inertia force FIin the Fourier model is calculated the same as in the traditional Morison formulation but with a fixed inertia coefficient value of 3.29.The total horizontal hydrodynamic load FHequals the superposition of drag force FDand inertia for FI,i.e.,FH=FD+FI,while the vertical load FVis considered equal to the uplift force FL.The developed integrated fluid-pipe-soil model has the capability to reduce the hydrodynamic loads based on the pipe vertical and horizontal displacements during the simulation(see Youssef et al.[35]and Youssef[36]for details about the hydrodynamic load reduction).
With one force-resultant model simulating a small section of pipe-soil interaction,a three-dimensional long pipeline can be represented by attaching numerous models in a‘‘Winkler foundation style’’.As illustrated in Fig.4,the pipeline structure is modeled as beam elements,and the force-resultant models attached to the pipe nodesrepresentthe surrounding soilbehavior. Hydrodynamic loads are applied along the pipeline and vary with time and location.
Environmental loads A three hour storm was numerically generated to represent Hurricane Ivan based on the environmental conditions provided in Table 2.A 3000 m long pipeline is used to represent the pipeline.The hydrodynamic loads acting on the pipeline in case 1 after 20 min of the storm are shown in Fig.5 for illustration.Plotting the pipe self-weight of case 1 on the vertical load diagram,Fig.5(b)shows that the uplift loads exceed the pipe self-weight in three spots along the pipeline at the moment. Numerically,this load must be shared and distributed along the pipe.
As a preliminary estimation,the hydrodynamic vertical loads are averaged over the pipeline length of3000 m.Figure 6 shows the averaged hydrodynamic vertical load history for the three pipeline cases.The corresponding pipe self-weights are also plotted on the diagrams.It is clear that the pipe self-weight of the first two pipeline cases is much less than the uplift loads.The pipe selfweight of case 3 is almost double the uplift load.Therefore,the first two pipelines are more likely to have had experienced large uplifting load during Hurricane Ivan.In this scenario,the pipeline may have been lifted from the seabed and drifted laterally with the flowing stream.Therefore,this preliminary analysis suggests that the first two pipelines are unstable.However,the self-weightofthe pipeline in case 3 is large enough to counterbalance the estimated hydrodynamic vertical load.
Comparing the hydrodynamic loads and the initial yield surface gives a rough indication of the applied loads and the expected resistance capacity.To perform this comparison,the generated hydrodynamic loads,FHand FV,at an arbitrarily selected location,500 m from the pipeline end,are plotted in V-H space by considering that V=Ws-FVand H=FH,as shown in Fig.7 for the three pipeline cases.For the first two pipeline cases,there are many loading points located on the negative side of the V axis that exceed the uplift capacity of the yield surface.Even expanding the yield surface during the simulation could not accommodate these loading values.Therefore,the soil should not be able to support this loading scenario.Based on the comparisons presented in this section,the first two pipeline cases may not be stable during a full 3000 m pipeline simulation,though the pipeline case 3 is expected to be stable.However,during numerical simulation there is the possibility that the hydrodynamic load may be shared along the pipeline length,taken by the dynamic response of the pipe or reduced due to the pipe movements.
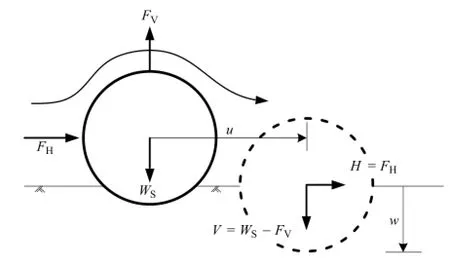
Fig.2.Pipe load and displacement convention.
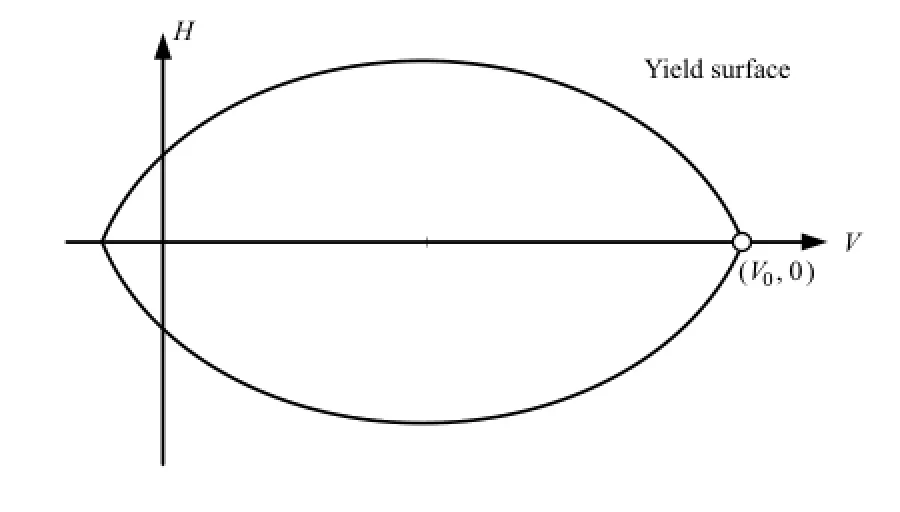
Fig.3.Yield surface.
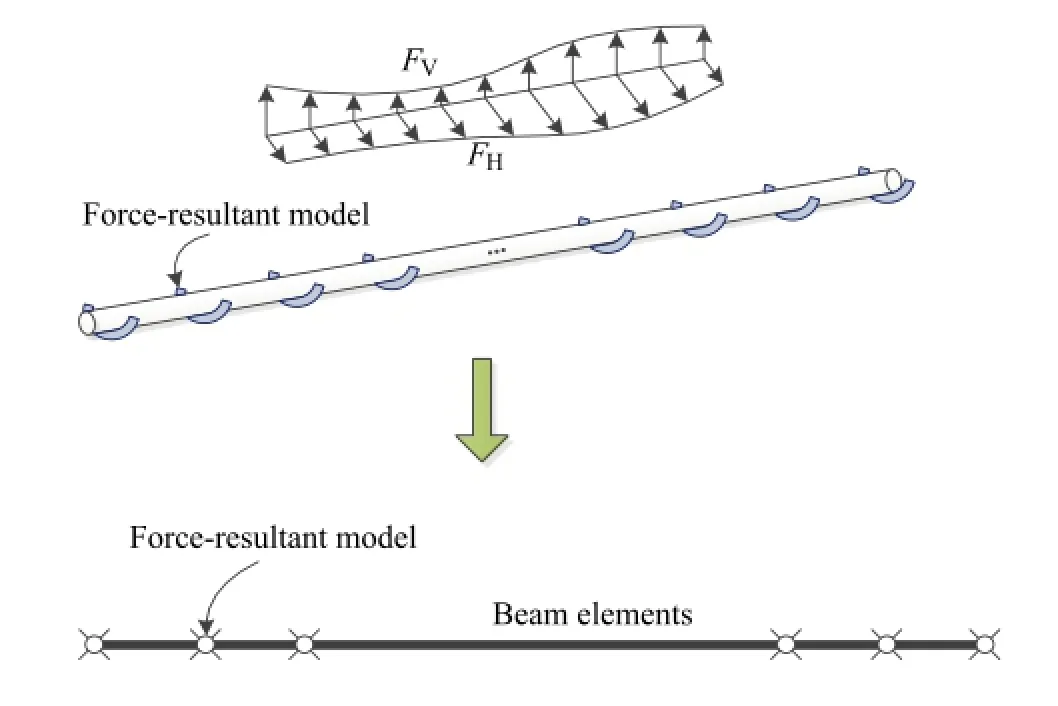
Fig.4.Illustration of program integration.
Retrospective modeling using the in-house package To numerically simulate the three pipeline cases using the integrated hydrodynamic-pipe-soil program,the pipeline was assumed to be 3000 m long and a flat seabed was assumed.Load concentrationduring pipeline was assumed to be twice the pipeline weight(for a study of the effect of load concentration please refer to Youssef[36]).Thus,the initialpipeline embedmentwas calculated. The pipeline was divided into 150 beam elements that were 20 m long(for a study of the influence of element length please refer to Youssef[36]).As the Gulf of Mexico mainly has clayey soil,the Hodder and Cassidy[22]model is adopted to describe the soil and 151 force-resultant models were attached to structural nodes tomodel the pipe-soil interaction.See Hodder and Cassidy[22]for details about the model parameters.

Fig.5.Hydrodynamic loads acting along pipeline Case 1 after 20 min.
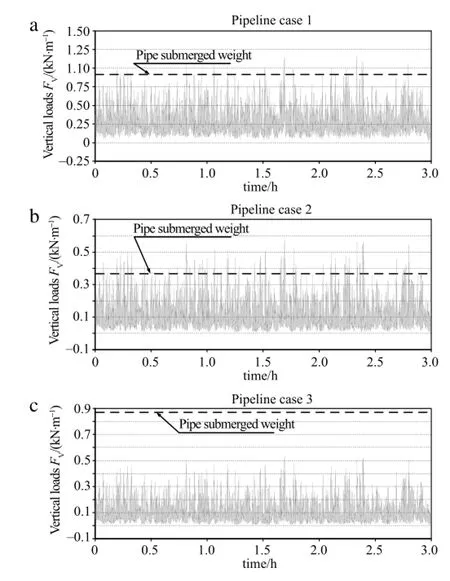
Fig.6.Average verticalload along the three pipeline cases and the pipe self-weight.
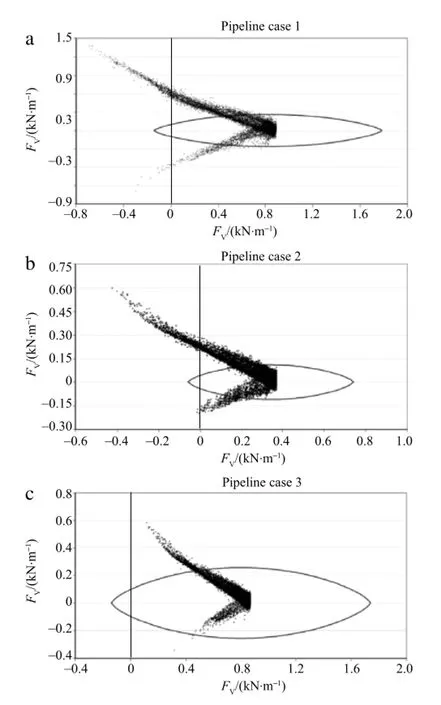
Fig.7.Hydrodynamic loads 500 m from the pipeline end compared to the yield surface.
In the first two pipeline analysis cases,the numerical analysis can not complete the entire 3 h storm because the pipeline was lifted completely off the seabed.In both cases,the yield surface of some force-resultant models first shrunk to zero and thus became‘‘inactive’’in the numerical package as the pipe self-weight was insufficient to counterbalance the uplift loads.The loads acting at the inactive pipe-soil element zones are shared by the remainder ofthe pipe nodes along the pipeline length.This caused these nodes to reach the inactive state just afterward.These analysis results of the first two pipeline cases indicate that these pipelines are unstable in the Hurricane Ivan environment.On the other hand,the 3 h analysis of pipeline case 3 was completed with a maximum horizontal displacement of 19.25 m.
To explore what pipe self-weight would be required for these pipeline cases to be stable during Hurricane Ivan,pipeline case 1 and case 2 were reanalyzed with self-weight values varying 2.0,2.5,3.0,and 3.5 times the original pipe self-weight shown in Table 2.Figure 8 shows the maximum lateral displacement results for the reanalyzed cases.As can be seen,the simulation of using a pipe weight of two times the original weight results in maximum horizontal displacements of 92.0 m and 48.0 m for cases 1 and 2,respectively.
The analysis of case 3 predicted a maximum horizontal displacement of 19.25 m.However,during Hurricane Ivan the pipe did not experience any horizontal displacement.One of the possible reasons for this difference between the numerical predicted and the field measurement is assumed to the load concentration factor during the pipeline laying,which essentially implies the initial yield surface size.As explained in Westgate et al.[37],the load concentration factor is the ratio of the vertical load transmitted in the touchdown zone during the pipelaying to the pipe self-weight. The value ofthe load concentration factordepends on many factors during the pipelaying,which include the sea state,water depth,wind speed and direction.Load concentration factor values of 2.0 and 4.2 have been suggested by Cathie et al.[38]for the cases of weak soil and strong soil,respectively.
The load concentration factor used in the previous simulation was set as 2.To investigate the effect of the load concentration factor on pipeline case 3 stability,four simulation cases are conducted by varying 2.5,3,3.5,and 4.The results for these simulation cases are presented in Fig.9.The simulation with load concentration factor of 4 results in an almost static pipeline with a final horizontal displacement of 0.01 m.
The numerical modeling results presented in this section demonstrate the capability of the integrated hydrodynamicpipe-soilmodeling programto reasonably simulate the on-bottom stability under strong hydrodynamic environment conditions.
Conclusions The developed in-house package was used to investigate the hydrodynamic loads acting on three pipeline cases during Hurricane Ivan and reported in the literature.In two of the cases,1 and 2,the pipe-weight and soil resistance was not enough to resistthe applied loads and a displacementscenario is suggested as these two pipeline cases were lifted from the seabed and drifted with the flowing stream(confirming the enormous displacements of 914.4 m and 518.2 m reported in the literature,respectively).
To assess the on-bottom stability of the three pipeline cases,the developed integrated program was used to conduct a 3-hour pipeline simulation.The simulation analysis of the first two pipeline cases terminated because the pipelines were lifted from the seabed.The analysis results indicated that pipelines with greater self-weight might be stable.Repeating the analysis of the first two pipeline cases considering pipelines with greater selfweight confirmed the conclusion above.Using a pipe self-weight double the original weight results in horizontal displacement values of 95.5 m and 48.7 m for pipeline case 1 and case 2,respectively.
The 3-hour analysis of pipeline case 3 revealed a horizontal displacement of 19.23 m.Repeating the analysis of pipeline case 3 with differentload concentration factors during the pipeline laying resulted in a maximum horizontal displacement of 0.01 m for a load concentration factor equals 4.
It is concluded from the analyses presented for the three pipeline cases that the developed integrated program can simulate complex cases with reasonable accuracy.
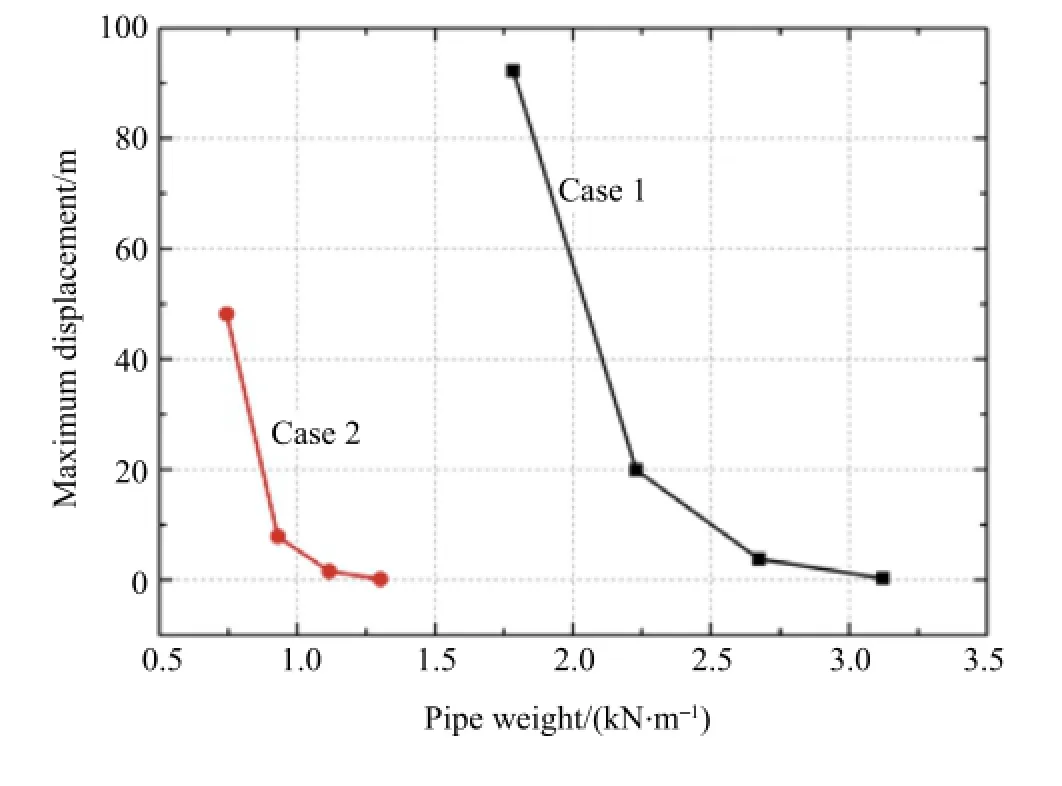
Fig.8.Influence of self-weight.
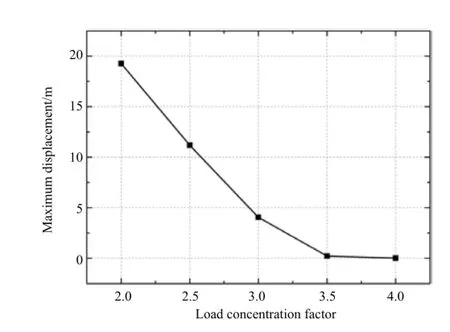
Fig.9.Influence of load concentration factor.
Acknowledgments
This work was supported by the Research Development Awards of University of Western Australia,Australia-China Natural Gas Technology Partnership Fund and Lloyd’s Register Foundation.Lloyd’s Register Foundation supports the advancement of engineering-related education and funds research and development that enhance the safety of life at sea,on land,and in the air. The work also forms part of the activities of the Centre for Offshore Foundation Systems(COFS)above,currently supported as a primary node of the Australian Research Council Centre of Excellence for Geotechnical Science and Engineering.
[1]A.Salvador,The Gulf of Mexico basin,in:The Geology of North America,Geological Society of America,1991,pp.131-180.
[2]R.H.Gore,The Gulf of Mexico,Pineapple Press,Inc.,Sarasota,1992.
[3]W.D.Nowlin,Water masses and general circulation of the Gulf of Mexico,Oceanology 5(1971)28-33.
[4]Det Norske Veritas,Pipeline damage assessment from hurricanes Katrina and Rita in the Gulf of Mexico,Technical Report no.44814183,Houston,Texas,2007.
[5]M.Gagliano,Offshore pipeline stability during major storm events,in: Government/Industry Pipeline Research and Development Forum,New Orleans,LA,2007.
[6]J.Thomson,M.Garrett,M.Taylor,T.George,M.Melancon,K.Behrens,Sonar surveys for pipeline inspection show extent of pipeline displacement and seafloor instability following hurricane Ivan,in:Offshore Technology Conference,Houston,Texas,2005.
[7]Det Norske Veritas,Pipeline damage assessment from hurricane Ivan in the Gulf of Mexico,Technical Report no.44038570,Houston,Texas,2006.
[8]A.T.Cox,V.J.Cardone,F.Counillon,D.Szabo,Hindcast study of winds,waves,and currents in Northern Gulf of Mexico in hurricane Ivan(2004),in:Offshore Technology Conference,Houston,Texas,2005.
[9]E.G.Ward,R.Gilbert,R.Spong,2005 Hurricane Readiness and Recovery Conference:Final Conference Summary Report,Report no.10/05C155,Offshore Technology Research Center,Austin,Texas,2005.
[10]S.Mirza,J.Skinner,A.Mathew,L.Ekstrom,Hurricane Ivan—pipeline damage,integrity assessment,and on-bottom stability observations,in:Offshore Technology Conference,Houston,Texas,2006.
[11]M.C.Nodine,J.Y.Cheon,S.G.Wright,R.B.Gilbert,Mudslides during Hurricane Ivan and an Assessment of the potential for future mudslides in the Gulf of Mexico,OTRC Report Library no.10/07C185,The University of Texas at Austin,Offshore Technology Research Center,2007.
[12]M.J.Kaiser,Y.Yu,C.J.Jablonowski,Modeling lost production from destroyed platforms in the 2004-2005 Gulf of Mexico hurricane seasons,Energy 34(2009)1156-1171.
[13]PRCI,Submarine Pipeline on-Bottom Stability,PRCI,2002,Project Number PR-178-01132.
[14]Y.Tian,M.J.Cassidy,Modelling of pipe-soil interaction and its application in numerical simulation,Int.J.Geom.ASCE 8(2008)213-229.
[15]Y.Tian,M.J.Cassidy,The challenge of numerically implementing numerous force-resultant models in the stability analysis of long on-bottom pipelines,Comput.Geotech.37(2010)216-312.
[16]Y.Tian,M.J.Cassidy,Incorporating upliftin the analysis ofshallowly embedded pipelines,Struct.Eng.Mech.40(2011)29-48.
[17]Y.Tian,M.J.Cassidy,C.K.Chang,Assessment of offshore pipelines using dynamic lateral stability analysis,Appl.Ocean Res.50(2015)47-57.
[18]Det Norske Veritas,On-bottom stability design of submarine pipelines,DNVRP-F109,2007.
[19]J.Zhang,Geotechnical stability of offshore pipelines in Calcareous Sand(Ph.D. thesis),University of Western Australia,Sydney,2001.
[20]J.Zhang,D.P.Stewart,M.F.Randolph,Modelling of shallowly embedded offshore pipelines in calcareous sand,J.Geotech.Geoenviron.Eng.ASCE 128(2002)363-371.
[21]Y.Tian,M.J.Cassidy,C.Gaudin,Advancing pipe-soil interaction models through geotechnical centrifuge testing in calcareous sand,Appl.Ocean Res. 32(2010)294-297.
[22]M.S.Hodder,M.J.Cassidy,A plasticity model for predicting the vertical and lateral behaviour of pipelines in clay soils,Geotechnique 60(2010)247-263.
[23]T.Sorenson,M.Bryndum,V.Jacobsen,Hydrodynamic forces on pipelinesmodel tests.Danish hydraulic Institute(DHI),Contract PR-170-185,Pipeline Research Council International Catalog No.L51522e,1986.
[24]Dassault Systèmes,ABAQUS User’s Manual,SIMULIA,Providence,RI,2010.
[25]G.M.Wantland,M.W.O’Neill,L.C.Reese,E.H.Kalajian,Lateral Stability of Pipelines in Clay,OTC,Houston,Texas,1979.
[26]H.Brennodden,J.T.Lieng,T.Sotberg,An energy-based pipe-soil interaction model,in:Offshore Technology Conference,Houston,Texas,1989,Paper OTC 6057.
[27]D.A.Wagner,J.D.Murff,H.Brennodden,O.Sveggen,Pipe-soil interactionmodel,J.Waterway Port Coastal and Ocean Eng.ASCE 115(1989)205-220.
[28]G.J.M.Schotman,F.G.Stork,Pipe-soil interaction:A model for laterally loaded pipelines in clay,in:Offshore Technology Conference,Houston,Texas,1987,Paper OTC 5588.
[29]F.Calvetti,C.Di Prisco,R.Nova,Experimental and numerical analysis of soilpipe interaction,J.Geotech.Geoenviron.Eng.ASCE 130(2004)1292-1299.
[30]C.Di Prisco,R.Nova,A.Corengia,A model for landslide-pipe interaction analysis,Soils and Found.44(2004)1-12.
[31]A.J.Fyfe,D.Myrhaug,K.Reed,Hydrodynamic forces on seabed pipelines:large scale laboratory experiments,in:Offshore Technology Conference.,Houston,Texas,1987,Paper OTC 5369.
[32]V.Jacobsen,M.B.Bryndum,D.T.Tsahalis,Prediction of irregular wave forces on submarine pipelines,in:7th International Conference on Ocean,Offshore and Arctic Engineering,Houston,1988,pp.23-32.
[33]R.L.P.Verley,K.Reed,Use of laboratory force data in pipeline response simulations,in:Proceedings of the International Offshore Mechanics and Arctic Engineering Symposium,Hague,Netherlands,1989.
[34]H.Zeitoun,K.Tørnes,J.Li,S.Wong,R.Brevet,J.Willcocks,Advanced dynamic stability analysis,in:Proceedings of the ASME 2009 28th International Conference on Ocean,Offshore and Arctic Engineering,Honolulu,Hawaii,USA,2009.
[35]B.S.Youssef,M.J.Cassidy,Y.Tian,Balanced three-dimensional modelling of the fluid-structure-soilinteraction ofan untrenched pipeline,in:International Offshore(Ocean)and Polar Engineering Conference,Beijing,2010.
[36]B.S.Youssef,The integrated stability analysis of offshore pipelines(Ph.D. thesis),University of Western Australia,Sydney,2012.
[37]Z.J.Westgate,M.F.Randolph,D.J.White,S.Li,The influence of sea state on aslaid pipeline embedment:a case study,Appl.Ocean Res.32(2010)321-331.
[38]D.N.Cathie,C.Jaeck,J.C.Ballard,J.F.Wintgens,Pipelines geotechnics—state-ofthe-art,in:Proc.of the Int.Symp.on the Frontiers in Offshore Geomechanics: ISFOG 2005,Perth,Taylor and Francis Group,Australia,2005,pp.95-114.
∗Corresponding author.
E-mail addresses:yinghui.tian@uwa.edu.au(Y.Tian),bassem.youssef@atteris.com.au(B.Youssef),mark.cassidy@uwa.edu.au(M.J.Cassidy).
*This article belongs to the Solid Mechanics
猜你喜欢
杂志排行
Theoretical & Applied Mechanics Letters的其它文章
- Failure mechanisms of a spudcan penetrating next to an existing footprint
- Difficulties and measures of driving super long piles in Bohai Gulf
- Long-term dynamic behavior of monopile supported offshore wind turbines in sand
- Coupling model for waves propagating over a porous seabed
- Elasto-plasticity and pore-pressure coupled analysis on the pullout behaviors of a plate anchor
- Experimental study on the stability of plate anchors in clay under cyclic loading
