Failure mechanisms of a spudcan penetrating next to an existing footprint
2015-11-21VickieKongMrkCssidyChristopheGudin
Vickie Kong,Mrk J.Cssidy,Christophe Gudin
aFugro-Advanced Geomechanics,52-54 Monash Ave,Nedlands,WA,Australia
bCentre for Offshore Foundation Systems and ARC CoE for Geotechnical Science and Engineering,University of Western Australia,35 Stirling Highway,Crawley,WA 6009,Australia
Failure mechanisms of a spudcan penetrating next to an existing footprint
Vickie Konga,Mark J.Cassidyb,∗,Christophe Gaudinb
aFugro-Advanced Geomechanics,52-54 Monash Ave,Nedlands,WA,Australia
bCentre for Offshore Foundation Systems and ARC CoE for Geotechnical Science and Engineering,University of Western Australia,35 Stirling Highway,Crawley,WA 6009,Australia
A R T I C L E I N F O
Article history:
Received 7 October 2014
Accepted 18 November 2014
Available online 13 December 2014
Jack-up
Footprint
Combined loading
Spudcan
Offshore geotechnics
Reinstallation of mobile jack-up rigs next to existing footprints is a problematic operation because the spudcan located near the footprints is subjected to eccentric and/or inclined loading conditions.Geotechnical centrifuge studies have measured these loads for combinations of changing footprint geometry,footprint soil properties and the offset of the reinstallation from the footprint centre.These tests have been of full model spudcans in order to accurately measure the combined loads developed.They have not provided information on the mechanisms of failure occurring during this complex installation.Observations from a visualisation test,where a half spudcan is penetrated against a transparent window in a geotechnical centrifuge,are reported in this paper.The mechanisms of failure at different stages during the penetration are presented.
©2015 The Authors.Published by Elsevier Ltd on behalf of The Chinese Society of Theoretical and Applied Mechanics.This is an open access article under the CC BY-NC-ND license(http:// creativecommons.org/licenses/by-nc-nd/4.0/).
Jack-ups are self-elevating mobile units operating in oil and gas fields and typically consist of a floatable hull and three independent retractable truss-work legs each resting on a spudcan footing. The spudcans are between 10 and 20 m in diameter[1,2].Jack-ups often return to sites were previous operations have left footprints in the seabed.Reinstallation next to these footprints is a problematic operation because the spudcan is subjected to eccentric and inclined loading conditions.Previous experimental studies have attempted to measure the combined loading on a spudcan reinstalling at different offset distances[3-8].
A further experimental investigation is presented that focuses on understanding the mechanisms that create the development of vertical,horizontal,and moment loads during reinstallation.This was achieved by penetrating a flat-base footing nearby a manually cut footprint cavity.The main objective of the experiment was to identify the effect that the footprint geometry has on the soilflow mechanism,and subsequently the reinstallation response. The experiment was conducted in a drum centrifuge on a halffooting model penetrating slightly over-consolidated kaolin clay. Digital images were captured during the full penetration using a digital camera.The particle image velocimetry(PIV)methodology coupled with close-range photogrammmetry correction is used to present the digital output as a series of velocity vectors and velocity contours to determine the soil failure mechanism during penetration.An overview of the experimental techniques is presented,followed by a detailed description on the experimental apparatus,testing procedures and a discussion of the results.The test presented here represents just one of eight tests conducted and reported in Ref.[9],where further analysis of the other tests that investigate different offset distances and footprint shapes can be found.
PIV analysis allows precise quantification of soil flow patterns and distortion zones by comparing pairs of images.The GeoPIV8 programme developed by White et al.[10]was adopted in this study to process the digital images.From each digital image the area of interest was cropped before being divided into interrogation patches,each covering a zone of soil approximately 1 mm2. Each of these patches was tracked using a cross-correlation algorithm,to identify the movement of that patch of soil between a pair of images,with a measurement precision of 10µm for the field of view used during the experiments.Before processing,each image was corrected for image distortion arising from the non-coplanarity of the image and object planes,and non-linearity within the image resulting from lens aberrations.
The tests were performed at 100 g in the drum centrifuge facility at University of Western Australia(UWA)[11].The use of PIV analysis requires a half-symmetrical footing model,to be placed in a rectangular testing box,against a transparent Perspex window(viewing window).During the test the half-footing penetrates into the soil and digital images of the soil movement can be continuously acquired through the viewing window.The footing was made from aluminium and was comprised of a 60 mm diameter flat-base footing and a 130 mm long leg section(Fig.1). To prevent soil or water ingress between the half-footing model and the viewing window of the soil container,a 1 mm diameter o-ring was attached to the face of the footing.The model also featured a stiffening bar,attached to the back of the leg. This was to avoid losing the seal due to the bending of the leg during penetration.A digital camera with high resolution(4000×3000 pixels)was placed in front of the testing box to capture images at a rate of 1.5 frame per second(15 frame per millimeter of footing penetration depth,for footing penetration rate of 0.1 mm/s).The camera was mounted on a frame,bolted tightly onto the drum channel.A digital clock,attached to the viewing window aided to identify the time difference between images.To improve the quality of images,a lighting frame comprised of rows of LED lights and a cooling fan were also mounted on the drum channel.
The kaolin clay sample(see Refs.[12,13]for soilproperties)was firstly consolidated using a press and then consolidated again under the high gravity environment in the drum centrifuge.A large watertight strongbox of 360 mm×650 mm×325 mm(width× length×depth)was used.The soil sample was consolidated using a consolidation press.The consolidation pressure was applied in stages to the target pressure of 28 kPa.When the change in sample height under the final consolidation pressure increment reduced to below 0.1 mm/h,consolidation was considered to have been achieved.The large strongbox containing an over-consolidated soil sample was then removed from the consolidation press.The soil sample was then cut into 80 mm×257 mm×160 mmblocks using a blade.Each block was put into the testing box and covered with geo-fabric(saturated with water)to prevent drying of the soil.The testing box was then fitted into the drum channeland consolidated at 120 g under self-weight for 2 days.Each testing box contained an over-consolidated sample 120 mm deep.
The testing box was 80 mm in width and was too narrow to accommodate idealised footprint with a circular shape.Therefore, the idealised footprint cavity was simplified to a‘‘V’’shape slope. The cutting blade was mounted on top of the testing box,and was slid acrossthe testing box to remove the soiluntilthe targeted footprintdepth(zF)was reached.The testwith a cavity of60 mmwidth(1D)and 20 mm depth(1/3D)is reported(see Fig.2).Coloured flock was sprinkled on the face of soil sample facing the viewing window in order to provide the necessary contrast to run the subsequent PIV analysis.A viewing window with control markers was installed onto the soil sample.This allowed visual inspection on the soil flow during the penetration test and provided reference to quantify the soil movements in subsequent PIV analysis.
The testing box,digital camera,and other accessories for digital photography were installed onto the drum channel.The drum centrifuge was then spun up to 100 g for at least 3 h,allowing pore pressure in the soil sample to reach hydrostatic equilibrium.The top of the soil sample was filled with water to maintain the saturation of the sample.The tests were performed at 100 g and started with penetration of the half-footing model into the soil sample at a velocity(v)of 0.1 mm/s.This ensured undrained response in the soil as the normalised velocity v D/cvof~94 was greater than 30[14-16].This was essential as installation of spudcans in clay soils offshore is undrained[17].During penetration,the digital camera operated at a frame rate of 1.5 frame per second.After reaching the depth of 60 mm below the soil surface(z=D),the half-footing model was then extracted from the soil.The halfspudcan was penetrated at an offset of 60 mm(one diameter)from the centre of the footprint(see Fig.2).This offset was chosen as it was shown to induce the largest combined loading in the full spudcan tests of Ref.[8].In the testing program of Kong[9]it was entitled TB-10D-HF.Figure 2 shows the layout and the testing box afterthe completion ofthe test.Inspection showsthe soildeformed radially but was well within the walls of the testing box and the boundaries should have limited effects on the testing results.

is the effective vertical stress.For UWA kaolin clay in the centrifuge,the equation parameters adopted were a=0.17 and n=0.7,which are within the range suggested in Refs.[12,13].
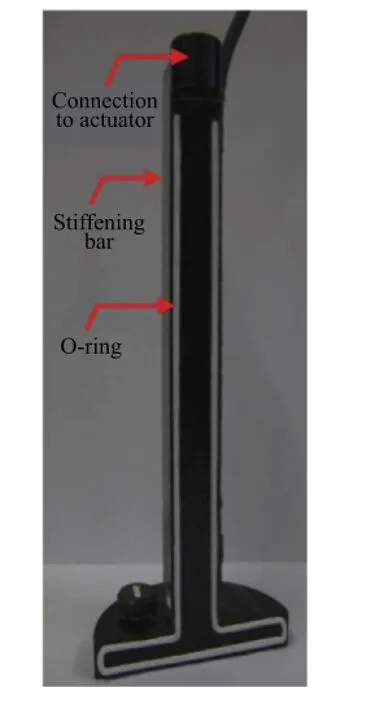
Fig.1.Half-footing model.
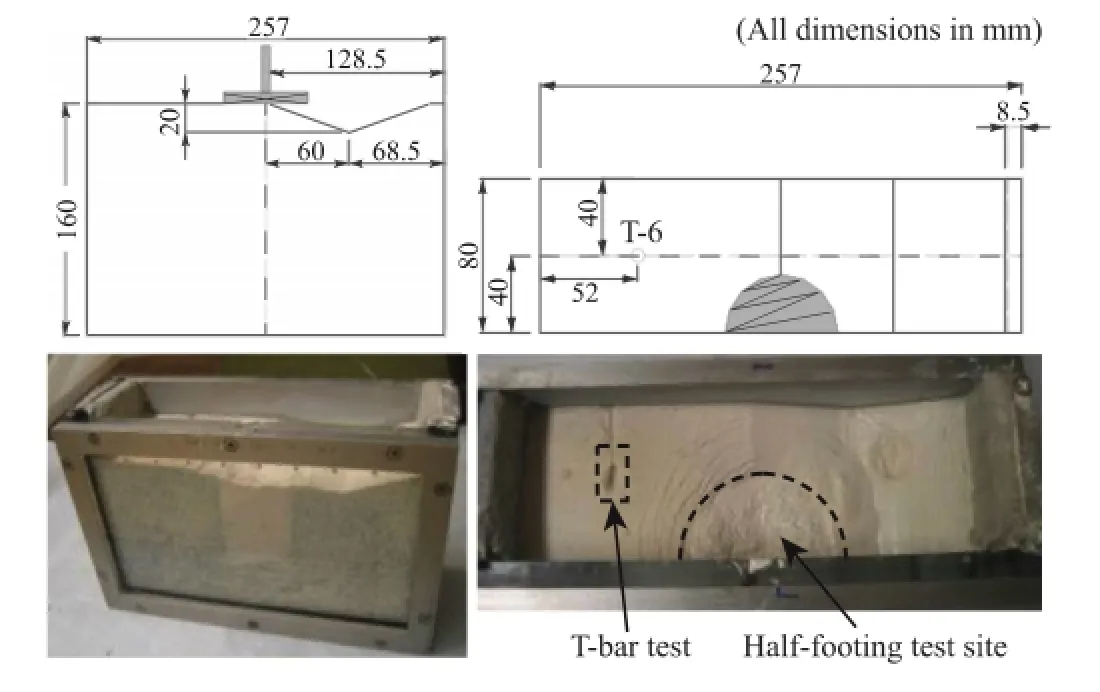
Fig.2.Box after the completion of half-footing reinstallation test.
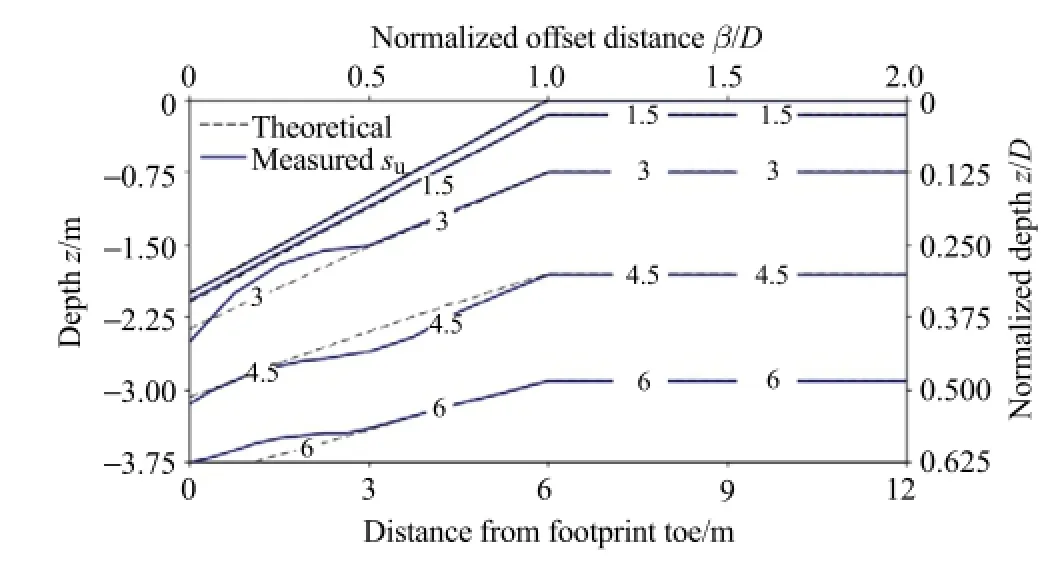
Fig.3.Contour of undrained shear strength(su)underneath the footprint cavity(units in kPa).
A detailed discussion on soil flow mechanism during jack-up reinstallation is now presented.As discussed in Ref.[8],the response of a footing reinstallation near an idealised footprint cavity exhibited a three-stage response.To capture the change ofsoilflow during these stages,PIV analysis was conducted at five different depths.(1)z/D=0.05(touchdown):Stage 1 response occurred at the touchdown level and also where the maximum moment was recorded.(2)z/D=0.10(full contact):This is approximately midway between stages 1 and 2.At this depth the footing came into full contact with the soil(i.e.,the contact width is equal to the footing diameter D).This depth is referred to as zcontactand occurred at z/D=0.10.zcontactvaries with footprint geometry and offset distance.(3)z/D=0.33(footprint toe):This is at the end of stage 2 response.This corresponds to the footprint toe level and where the maximum horizontal force is recorded.(4)z/D=0.50(zero H and M):Stage 3 response occurred below the footprint toe level.In this stage the maximum moment and horizontal forces reduced to almost zero.(5)z/D=1.00(fully localised back-flow):The effect of footprint geometry to the reinstallation response ceased when the footing was located more than 1D below the footprint toe level.
In order to determine the effect of change in soil flow on the vertical,horizontal,and moment responses of the footing,Fig.4 presents the results recorded in a geotechnicalcentrifuge for a fullfooting reinstalled at the same(1D)offset from a circular footprint of the same depth and width(size‘‘TB’’in Refs.[8,9]).It is shown here to draw conclusions between the mechanism being shown in the PIV test and the loads developed in the full spudcan test.It is noted that the half-spudcan PIV test was performed next to a V-shaped footprint whereas the full spudcan test next to a circular footprint.Comparable results were observed in full spudcan tests,thorough for a different installation offset,as discussed in Ref.[9].
The digital images of the half-footing at the five important depths are presented in Fig.5.In addition,the velocity vectors and velocity contours(normalised by footing penetration velocity)are presented with the ground profile to identify potential soil heave and back flow.Based on the velocity fields,the failure mechanisms at different penetration depths are presented in Fig.6.The shear planes are shown in red coloured lines.As the movement of the footing is restricted to be purely vertical,the horizontal,and eccentric verticalsoilreactions translate into vertical,horizontal,and moment forces.The eccentric vertical force(green arrows)and the soil movement governing the horizontal force(blue arrows)were also identified from the velocity field in Fig.6.For ease of discussion,the side of footing closer to the footprint centre is referred to as LHS and the other side is referred to as RHS.The definitions of terminologies and the simplified failure mechanisms are shown in Fig.7.
In stage 1(z/D=0.05),a two-way mechanism was observed on the partially supported footing.The observed failure was similar to the elliptical failure mechanism.This agrees with the ellipsoidal cavity expansion mechanism proposed by Osman and Bolton[19],although the point of separation of the two-way mechanism(indicated by the green arrow in Fig.5a is at a distance xneutralfrom the centreline of the footing,see Fig.6).
The passive wedge on the LHS is displaced horizontally towards the footprint centre.This is the optimal mechanism as the soil is following the path of less resistance with shear forces along the failure slip involved in the process.In contrast,the soildeformation on the RHS exhibits a typical elliptical failure mechanism.The two-way mechanism generates a penetration resistance,which is indeed lower than the one generated by a full bearing failure mechanism,as demonstrated in Fig.5b.
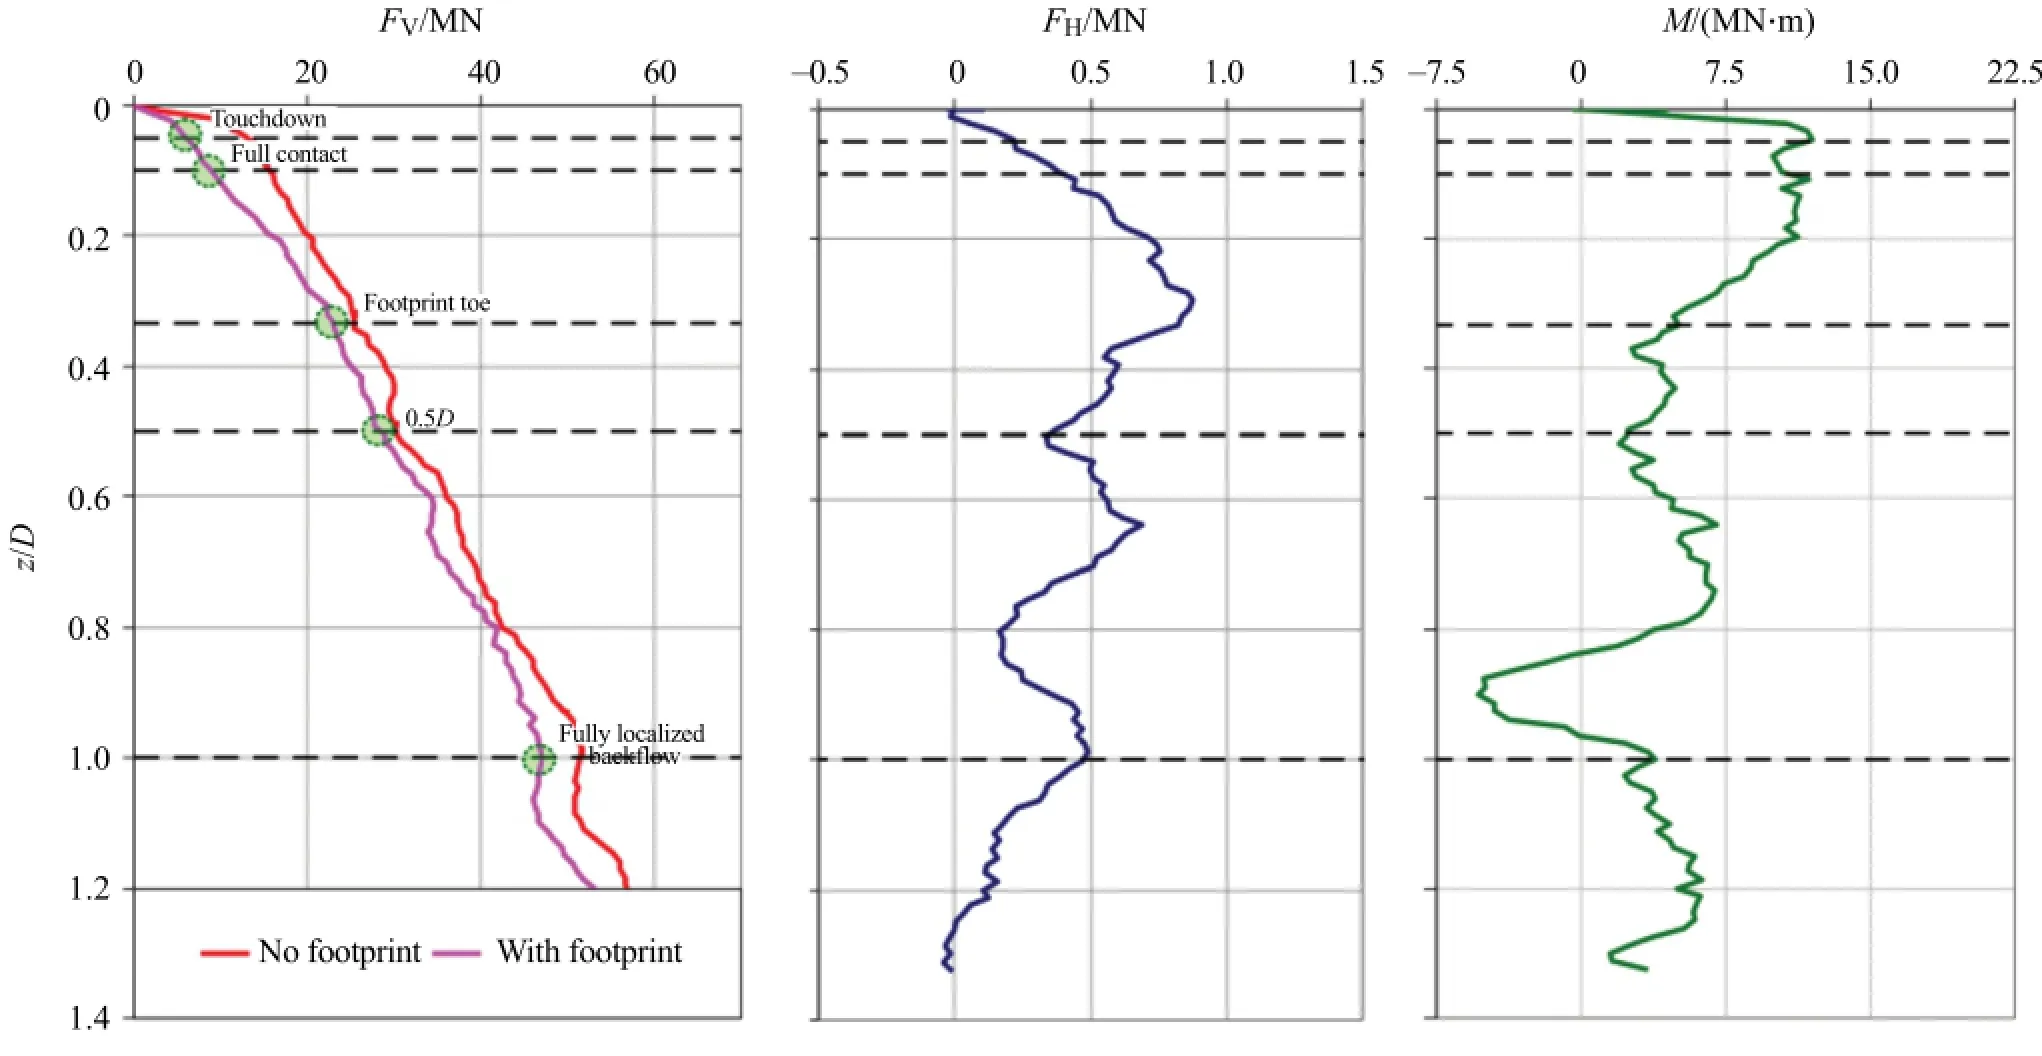
Fig.4.Vertical,horizontal forces,and moments at the five important depths for a full spudcan test at 1D offset from footprint‘‘TB’’[8,9].
The dissymmetry of the mechanism also generates an eccentricity of the resultant of the vertical stresses at the footing invert,which tends to rotate the footing away from the footprint.This translates into a moment on the leg,as the footing is prevented to rotate.As evidentin Fig.4,the maximummoment Mmaxoccurred at the touchdown level.This is where the dissymmetry of the mechanism is the most pronounced and consequently where the eccentricity is at a maximum.The footing sitting on the footprint also tends to move horizontally with the failed soil moving towards the footprint centre.Again,the movement was transmitted to a horizontal force because the footing was restricted from movement. As shown in the full spudcan test(Fig.4),the horizontal force increased gradually from the touchdown level.
As penetration continued to stage 2,the footing came into full contact with the founding soil at zcontact(z/D=0.10)and a twoway mechanism is still observed.However,the shear plane develops along a longer length and generates a higher resistance.It results in(1)a resistance stilllower than the penetration resistance of a test into a flat virgin soil[8,9],but to a lesser extent,and(2)a reduction ofthe eccentricity ofthe resultant of the verticalstresses at the footing invert.The reduction ofthe eccentricity results,however,in a marginal reduction of the moment in the footing leg,because it is compensated by the increase of vertical resistance associated with the increasing contact area between the footing and the soil.The size of the horizontal moving soil block also increased with penetration until reaching zcontact.This imposed a horizontal force on the footing sitting on top of the soil and the footprint therefore experienced an increase in horizontal force with increasing penetration depth.In addition,the RHS of the footing starts to be embedded into the soil and there was unbalanced lateral earth pressure acting on the two sides of the footing.This unbalanced earth lateral pressure contributed to the increase in horizontal force with penetration depth until the soil started to flow from the bottom around the footing.
At footprint toe level(z/D=0.33),the soil velocity field exhibits a more symmetrical pattern.As a consequence,the penetration resistance reaches values closer to a test into virgin flat soil(see Fig.5c),and the eccentricity ofthe verticalforces atthe footing invert and the resulting moment reduces to almost zero.An open cavity was formed on the LHS of the footing.An elliptical failure mechanism is observed on the LHS of the footing while full flow failure starts to occur on the RHS.Although the soil moves upward to the surface,rather than horizontally towards the footprint toe,the horizontalforce continues to increase due to the different overburden soil stress on the two sides of the footing and induces an unbalanced lateral earth pressure on the footing.
At z/D=0.50 the footing reaches stage 3 penetration response and full flow mechanism occur on both side of the footing.It results in a moment reducing to almost zero and to a relativelysmall horizontal force shown in the full spudcan test.For deeper penetration at z/D=1.0,the soilflow is perfectly symmetricaland the influence of the idealised footprint cavity is no longer noted.
This paper reports the mechanisms of combined loading on a footing penetrating next to an existing footprint.It was shown that the footing initially failed in a two-way mechanism and then the failure mechanism changed to a skewed elliptical failure near the depth of contact.With further penetration below the depth of the footprint,the mechanism changed to a one-side full flow failure until the effect of the footprint ceased.The point of separation of the two-way failure shifted closer to the footing centreline.The change of failure mechanisms with increasing penetration depth were summarised diagrammatically in the paper.The footing experienced eccentric vertical force and therefore moment in the footing.Furthermore,the combined effect of the failed soil moving horizontally and the different overburden stress on the two side of footing resulted in horizontal force acting on the footing.This paper only reported one of eight PIV tests,with descriptions of the others available in Ref.[9].The PIV test results were subsequently used to derive a simple method for predicting the response of a spudcan next to a footing.
The work forms part of the activities of the Centre for Offshore Foundation Systems(COFS),currently supported as a primary node of the Australian Research Council Centre of Excellence for Geotechnical Science and Engineering(CE110001009).
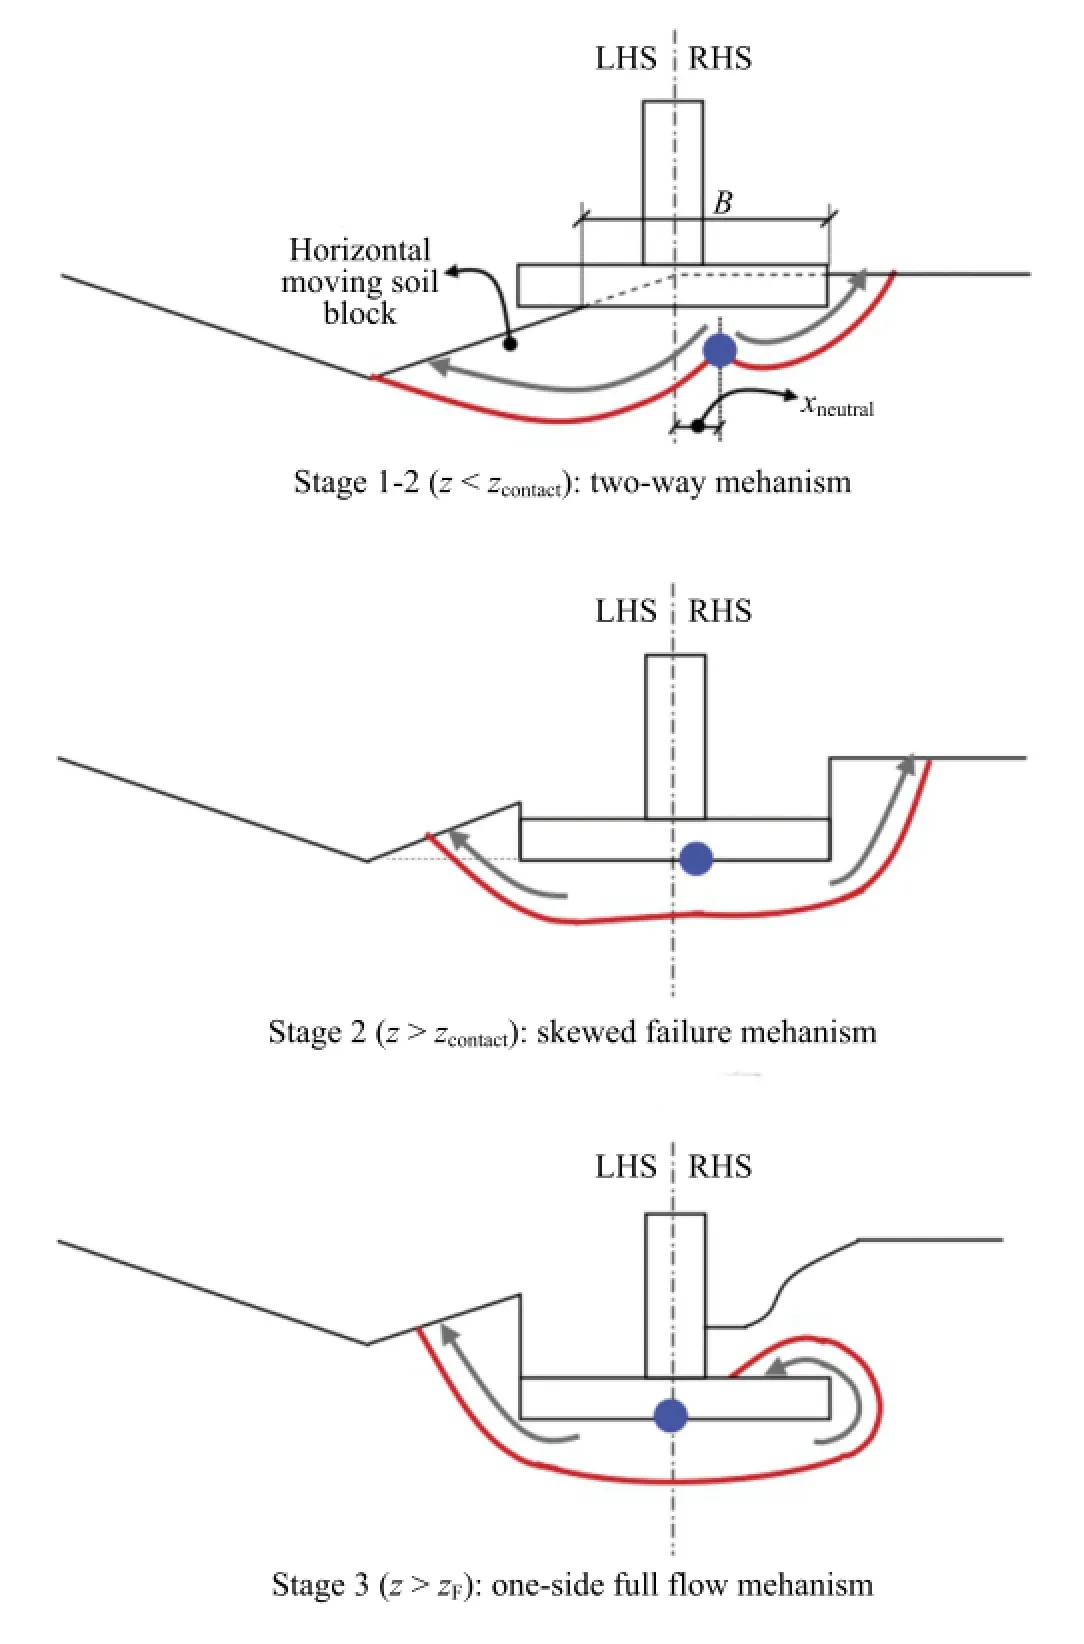
Fig.7.Typical failure modes of footing reinstallation near footprint.
[1]D.Menzies,R.Roper,Comparison of jackup rig spudcan penetration methods in clay,in:Offshore Technology Conference,Houston,Texas,US,2008.
[2]Y.Zhang,B.Bienen,M.J.Cassidy,S.Gourvenec,The undrained bearing capacity of a spudcan foundation under combined loading in soft clay,Mar.Struct.24(2011)459-477.
[3]D.P.Stewart,I.M.S.Finnie,Spudcan-footprint interaction during jack-up workovers,in:11th International Offshore and Polar Engineering Conference,Stavanger,Norway,2001,pp.61-65.
[4]C.Gaudin,M.J.Cassidy,T.Donovan,Spudcan reinstallation near existing footprints,in:Proceedings of the 6th International Conference of Offshore Site Investigation and Geotechnics,London,England,2007,pp.285-292.
[5]M.J.Cassidy,C.K.Quah,K.S.Foo,Experimental investigation of the reinstallation of spudcan footings close to existing footprints,J.Geotech.Geoenviron. Eng.,ASCE 135(2009)474-486.
[6]C.T.Gan,Centrifuge model study on spudcan-footprint interaction(Ph.D. thesis),National University of Singapore,Singapore,2009.
[7]C.T.Gan,C.F.Leung,M.J.Cassidy,C.Gaudin,Y.K.Chow,Effect of time on spudcan-footprint interaction in clay,Géotechnique 62(2012)401-413.
[8]V.W.Kong,M.J.Cassidy,C.Gaudin,Experimental study of the effect of geometry on the reinstallation of a jack-up next to a footprint,Can.Geotech.J. 50(2013)557-573.
[9]V.W.Kong,Jack-up reinstallation near existing footprints(Ph.D.thesis),University of Western Australia,Perth,Australia,2012.
[10]D.J.White,W.A.Take,M.D.Bolton,Soil deformation measurement using particle image velocimetry(PIV)and photogrammetry,Géotechnique 53(2003)619-631.
[11]C.Gaudin,M.J.Cassidy,B.Bienen,M.S.Hossain,Recent contributions of geotechnical centrifuge modelling to the understanding of jack-up spudcan behaviour,Ocean Eng.38(2011)900-914.
[12]D.P.Stewart,Lateral loading of piled bridge abutments due to embankment construction(Ph.D.thesis),University of Western Australia,Perth,Australia,1992.
[13]K.L.Teh,C.F.Leung,Y.K.Chow,M.J.Cassidy,Centrifuge modelstudy ofspudcan penetration in sand overlying clay,Géotechnique 60(2010)825-842.
[14]I.M.S.Finnie,Performance of shallow foundations in calcareous soil(Ph.D. thesis),University of Western Australia,Crawley,Australia,1993.
[15]A.R.House,J.R.M.S.Oliveira,M.F.Randolph,Evaluating the coefficient of consolidation using penetration tests,Int.J.Phys.Modelling Geotech.1(2001)17-25.
[16]M.J.Cassidy,Experimentalobservations ofthe penetration ofspudcan footings in silt,Géotechnique 62(2012)727-732.
[17]J.J.Osborne,K.L.Teh,G.T.Houlsby,M.J.Cassidy,B.Bienen,C.F.Leung,Improved guidelines for the prediction of geotechnical performance of spudcan foundations during installation and removal of jack-up units,RPS Energy Report Number EOG0574-Rev1.Final Guidelines of the InSafe Joint Industry Project,2010.
[18]C.C.Ladd,et al.,Stress deformation and strength characteristics,in:9th International Conference on Soil Mechanics and Foundation Engineering,Toyko,1977.
[19]A.S.Osman,M.D.Bolton,Simple plasticity-based prediction of the undrained settlement of shallow circular foundations on clay,Géotechnique 55(2005)435-447.
∗Corresponding author.
E-mail addresses:vickiek@ag.com.au(V.Kong),mark.cassidy@uwa.edu.au(M.J.Cassidy),christophe.gaudin@uwa.edu.au(C.Gaudin).
*This article belongs to the Solid Mechanics
杂志排行
Theoretical & Applied Mechanics Letters的其它文章
- Difficulties and measures of driving super long piles in Bohai Gulf
- Assessment of pipeline stability in the Gulf of Mexico during hurricanes using dynamic analysis
- Long-term dynamic behavior of monopile supported offshore wind turbines in sand
- Coupling model for waves propagating over a porous seabed
- Elasto-plasticity and pore-pressure coupled analysis on the pullout behaviors of a plate anchor
- Experimental study on the stability of plate anchors in clay under cyclic loading
