Maize response to elevated plant density combined with lowered N-fertilizer rate is genotype-dependent
2015-11-12AhmedMedhatAlNaggarRedaShabanaMohamedAttaTarekAlKhalil
Ahmed Medhat M.Al-Naggar*,Reda A.Shabana,Mohamed M.M.Atta,Tarek H.Al-Khalil
Agronomy Department,Faculty of Agriculture,Cairo University,Giza,Egypt
Maize response to elevated plant density combined with lowered N-fertilizer rate is genotype-dependent
Ahmed Medhat M.Al-Naggar*,Reda A.Shabana,Mohamed M.M.Atta,Tarek H.Al-Khalil
Agronomy Department,Faculty of Agriculture,Cairo University,Giza,Egypt
A R T I C L E I N F O
Article history:
6 January 2015
Accepted 16 February 2015
Available online 21 February 2015
Quadratic regression
Appropriate N rate
High-density tolerant maize
Unit area productivity A B S T R A C T
Increasing plant density and improving N fertilizer rate along with the use of high density-tolerant genotypes would lead to maximizing maize(Zea mays L.)grain productivity per unit land area.The objective of this investigation was to match the functions of optimum plant density and adequate nitrogen fertilizer application to produce the highest possible yields per unit area with the greatest maize genotype efficiency.Six maize inbred lines differing in tolerance to low N and high density(D)[three tolerant(T);L-17,L-18,L-53,and three sensitive(S);L-29,L-54,L-55]were chosen for diallel crosses.Parents and crosses were evaluated in the 2012 and 2013 seasons under three plant densities:low (47,600),medium (71,400),and high(95,200)plants ha-1and three N fertilization rates:low(no N addition),medium (285 kg N ha-1)and high(570 kg N ha-1).The T×T crosses were superior to the S×S and T×S crosses under the low N-high D environment in most studied traits across seasons.The relationships between the nine environments and grain yield per hectare(GYPH)showed near-linear regression functions for inbreds L54,L29,and L55 and hybrids L18×L53 and L18×L55 with the highest GYPH at a density of 47,600 plants ha-1and N rate of 570 kg N ha-1and a curvilinear relationship for inbreds L17,L18,and L53 and the rest of the hybrids with the highest GYPH at a density of 95,200 plants ha-1combined with an N rate of 570 kg N ha-1.Cross L17×L54 gave the highest grain yield in this study under both high N-high-D(19.9 t ha-1)and medium N-high-D environments(17.6 t ha-1).
©2015 Crop Science Society of China and Institute of Crop Science,CAAS.Production and hosting by Elsevier B.V.All rights reserved.
1.Introduction
Hybrid varieties currently released in Egypt by the National Maize Breeding Program(NMBP)are bred and grown at low plant density(57,000 plants ha-1)around half the density used in developed countries[1].This lower plant density may be one of the main reasons for lower grain yield per unit land area planted in maize than that in the developed countries.A potential method for maximizing total maize production in Egypt is raising productivity per unit of land area and thus upgrading our global rank in average productivity,especially with the irrigation system used in Egypt and weather and soil conditions better suited to maize cultivation than those of other regions in the world.Grain yield per unit land area is the product of grain yield plant-1and number of plants per unit area[2].Maximum yield per unit area may be obtained bygrowing maize hybrids that can withstand high plant density,up to 100,000 plants ha-1[3].Average maize grain yield per unit area in the USA increased dramatically during the second half of the 20th century,owing to improvements in crop management practices and greater tolerance by modern hybrids of high plant densities[4,5].
Growing hybrid varieties released by the NMBP at high plant densities causes a drastic reduction in grain yield per unit area.The reason is probably that these varieties are not tolerant of high plant densities,because of their height,one-eared bearing habit,decumbent leaf,and large-type plants.In contrast,modern maize hybrids in developed countries are characterized by high yielding ability per unit area under high plant densities,owing to morphological and phenological adaptations such as early silking,short anthesis-to-silking interval(ASI),few barren stalks,and prolificacy[6].Radenovic et al.[7]pointed out that maize genotypes with erect leaves are very desirable for increased population densities,owing to their better light interception.
Maize grain yield per plant decreases as the density per unit area increases[2].The yield decreases as a response to decreasing light and other environmental resources available to each plant[8].Reduction in yield is due mainly to fewer cobs(barrenness)[9],fewer grains per cob[10],lower grain weight[11],or a combination of these components[12].At high densities,many kernels may not develop,an event that occurs in some hybrids following poor pollination resulting from a silking period that is delayed relative to tassel emergence[13]and/or owing to a limitation in assimilate supply that causes grain and cob abortion[14].However,under optimum water and nutrient supply,high plant density can result in an increased number of cobs per unit area,with an eventual increase in grain yield[15].Liu et al.[16]reported that maize yield differed significantly at varying plant density levels,owing to differences in genetic potential.
Nitrogen is an essential nutrient for maize crop growth[17].It is the principal raw material required for the growth of plants and is an essential constituent of metabolically active compounds such as amino acids,proteins,enzymes,coenzymes,and some non-proteinaceous compounds[17,18]. Low N stress is one of the factors most frequently occurring under high plant density and limits maize production.Low N availability in soils is an important yield-limiting factor frequently found in farmers'fields where fertilization is not commonly used and organic matter is rapidly mineralized[19].Ears plant-1and anthesis-to-silking interval are considered the most important low-N adaptive traits[20].Under these circumstances,given that smallholder farmers cannot afford additional inputs,it is desirable to increase the tolerance of the crop to stresses that occur in their fields[21].
Matching the functions of optimum plant density and adequate nitrogen fertilizer application to produce the highest possible yields with the greatest maize hybrid efficiency has been the aim of many researchers[22-24].Modern hybrids have shown tendencies to withstand higher levels of stresses(such as low N and high plant densities),allowing them to better sustain suitable photosynthetic rates and sufficient assimilate supplies and to maintain plant growth rates attributable to enhanced nitrogen use efficiency[25].Along with the prevailing belief that high yields require more plants and that more plants require more N,the idea that different hybrids respond differently to both N and plant density should be considered[26].Moreover,different hybrids may behave differently in their tolerance to both low N and high-density stresses[26].The objectives of the present investigation were(i)to evaluate the effects of stresses resulting from elevating plant density combined with lowering N application rate on traits of six inbreds and their diallel F1crosses,and(ii)to match the functions of appropriate plant density and adequate nitrogen fertilizer application with greatest maize inbred or hybrid efficiency to produce the highest possible yields per unit area.
2.Materials and methods
This study was performed in the 2011,2012,and 2013 seasons at the Agricultural Experiment and Research Station of the Faculty of Agriculture,Cairo University,Giza,Egypt.Six maize inbred lines(Table 1)in the sixth selfing generation(S6),showing clear differences in performance and general combining ability for grain yield per hectare under high plant density were chosen as parents of diallel crosses.In the 2011 season,all possible diallel crosses(except reciprocals)were made among the six parents,so that seeds of 15 direct F1progenies were obtained.Two field evaluation experiments were performed in the 2012 and 2013 seasons.The climatic differences over experimental years are shown in Table 2. Each experiment included the 15 F1crosses,their six parents,and two check cultivars:SC 10(with white grains)obtained from the Agricultural Research Center(ARC)and SC 2066(with yellow grains)obtained from Hi-Tech Company-Egypt.
Evaluation in each season was performed under nine environments(from E1 to E9):three nitrogen levels:high(HN),medium(MN),and low N(LN)by addition of 570,285,and 0 kg N ha-1,respectively,in two equal doses of ureabefore the first and second irrigations,and three plant densities:high(HD),medium (MD),and low(LD)(95,200,71,400,and 47,600 plants ha-1,respectively)as follows:E1,HN-LD;E2,HN-MD;E3,HN-HD;E4,MN-LD;E5,MN-MD;E6,MN-HD;E7,LN-LD;E8,LN-MD;and E9,LN-HD.Available soil nitrogen in 30 cm depth was analyzed immediately prior to sowing.Available nitrogen(including soil N and added N)was calculated for each environment and found to be 747,462,and 177 kg N ha-1in the 2012 season and 732,447,and 162 kg N ha-1in the 2013 season,with an average across the two seasons of 740,456,and 170 kg N ha-1,respectively.A split-split plot design in a randomized complete block(RCB)arrangement with three replications was used.Main plots represented nitrogen levels(HN,MN,and LN).Subplots were assigned to plant density(HD,MD,and LD).Sub-subplots were assigned to the 23 maize genotypes(six parents,15 F1s,and two checks).Each sub-subplot consisted of one ridge 4 m long and 0.7 m wide.Seeds were sown in hills at 15,20 and 30 cm apart,and thereafter(before the first irrigation)were thinned to one plant per hill to achieve the three plant densities of 95,200,71,400,and 47,600 plants ha-1,respectively.The sowing dates in all environments were April 5 and May 2 in the 2012 and 2013 seasons,respectively.The soil analysis of the experimental site is presented in Table 3.All other agricultural practices were followed according to the recommendations of ARC,Egypt.Fertilization with calcium superphosphate was performed with soil preparation and before sowing.Weed control was performed chemically with Stomp herbicide before the first irrigation and just after sowing and manually by hoeing twice,the first before the second irrigation and the second before the third irrigation.Irrigation was applied by flooding after three weeks for the second irrigation and every 12 days for subsequent irrigations.Pest control was performed when required by spraying plants with Lannate(Methomyl)90%(manufactured by DuPont,USA)against corn borers.
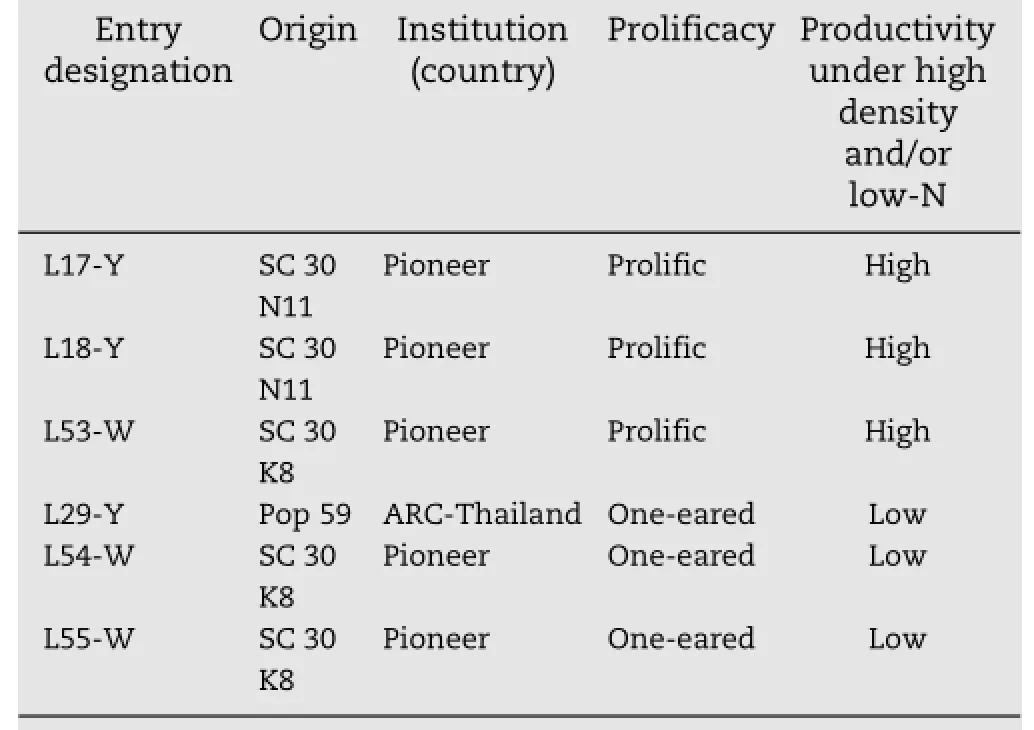
Table 1-Designation,origin,and most important traits of six inbred lines(L)used for making diallel crosses in this study.

Table 2-Some meteorological variables recorded at Giza Agrometeorological Station during two maize growing seasons.
Data were collected for 14 traits:anthesis-to-silking interval(ASI),plant height(PH),barren stalks(BS)percentage,leaf angle(LANG)measuredastheanglebetweenstemandbladeoftheleaf just above ear leaf,and chlorophyll concentration index(CCI)measured with a chlorophyll concentration meter,model CCM 200(http://www.apogeeinstruments.co.uk/apogee-instrumentschlorophyll-content-meter-technical-information/)as the ratio of transmission between 931 nm and 653 nm through the leaf of the topmost ear.At 80 days from the sowing date,light intensity was measured and the light penetrating the canopy was calculated for each genotype using a Lux-meter equipment Model ACM-DLM-2365,manufactured by ACMAS Technocracy PVT,LTD,India.Thelightintensityinluxwasmeasuredat12 AM(noon)at the top of the plant and at the base of the topmost ear. Light penetrating the canopy 80 days from sowing(PL-M80)was measuredasapercentageoflightpenetratingfromthetopofthe plant to the base of the topmost ear,as follows:100(light intensityatthebaseofthetopmostear/lightintensityatthetop of the plant).At harvest,number of ears per plant(EPP),number ofkernelsperplant(KPP),100-kernelweight(100-KW),grainyield per plant(GYPP),grain yield per hectare(GYPH),total aboveground dry matter per plant(TDM),harvest index(HI),andeconomic nitrogen use efficiency (NUEe),calculated as follows:NUEe=GDM/Ns,where GDM=grain dry matter and Ns=available soil-N according to Moll et al.[27].

Table 3-Soil analysis at 0-30 cm depth in the experimental field at Giza during two maize growing seasons.
A combined analysis of variance of split-split plot across the two seasons was performed if the homogeneity test was nonsignificant,and LSD values were calculated to test the significance of differences between means according to Snedecor and Cochran[28]using SAS(http://www.sas.com/ en_us/software/university-edition.html).Rank correlation coefficients were calculated between pairs of the nine studied environments for grain yield per hectare(GYPH).Computation was performed with SPSS 17(http://www.ibm.com/ software/analytics/spss.html)and the significance of the rank correlation coefficient was tested according to Steel et al.[29].
3.Results
3.1.Analysis of variance
The combined analysis of variance across years(Y)of the split-split plot design for the studied 23 genotypes(G)ofmaize(sixinbreds+15F1s+twocheckcommercial single-cross hybrids)under three plant densities(D)and three nitrogen(N)levels is presented in Table 4.Mean squares due to years were significant(P≤0.01)for all studied traits,except for ASI,PH,EPP,and 100-KW,indicating significant effect of climatic conditions on most studied traits(Table 2). Mean squares due to plant densities,N levels and genotypes were significant(P≤0.01)for all studied characters.Meansquares due to the first-order interaction,i.e.,N×Y,D×Y,G×Y,D×N,G×N,and G×D were significant(P≤0.01)for all studied traits,except for chlorophyll concentration index(CCI)for N×Y,ASI,and BS for D×Y,DTS,ASI,BS,EPP,KPP,HI,and NUEefor G×Y and LANG for G×N.Mean squares due to the second-order interactions D×N×Y and G×D×N were significant or highly significant for all studied traits,except ASI,BS,LANG,CCI;and 100-KW for D×N×Y and LANG for G×D×N.
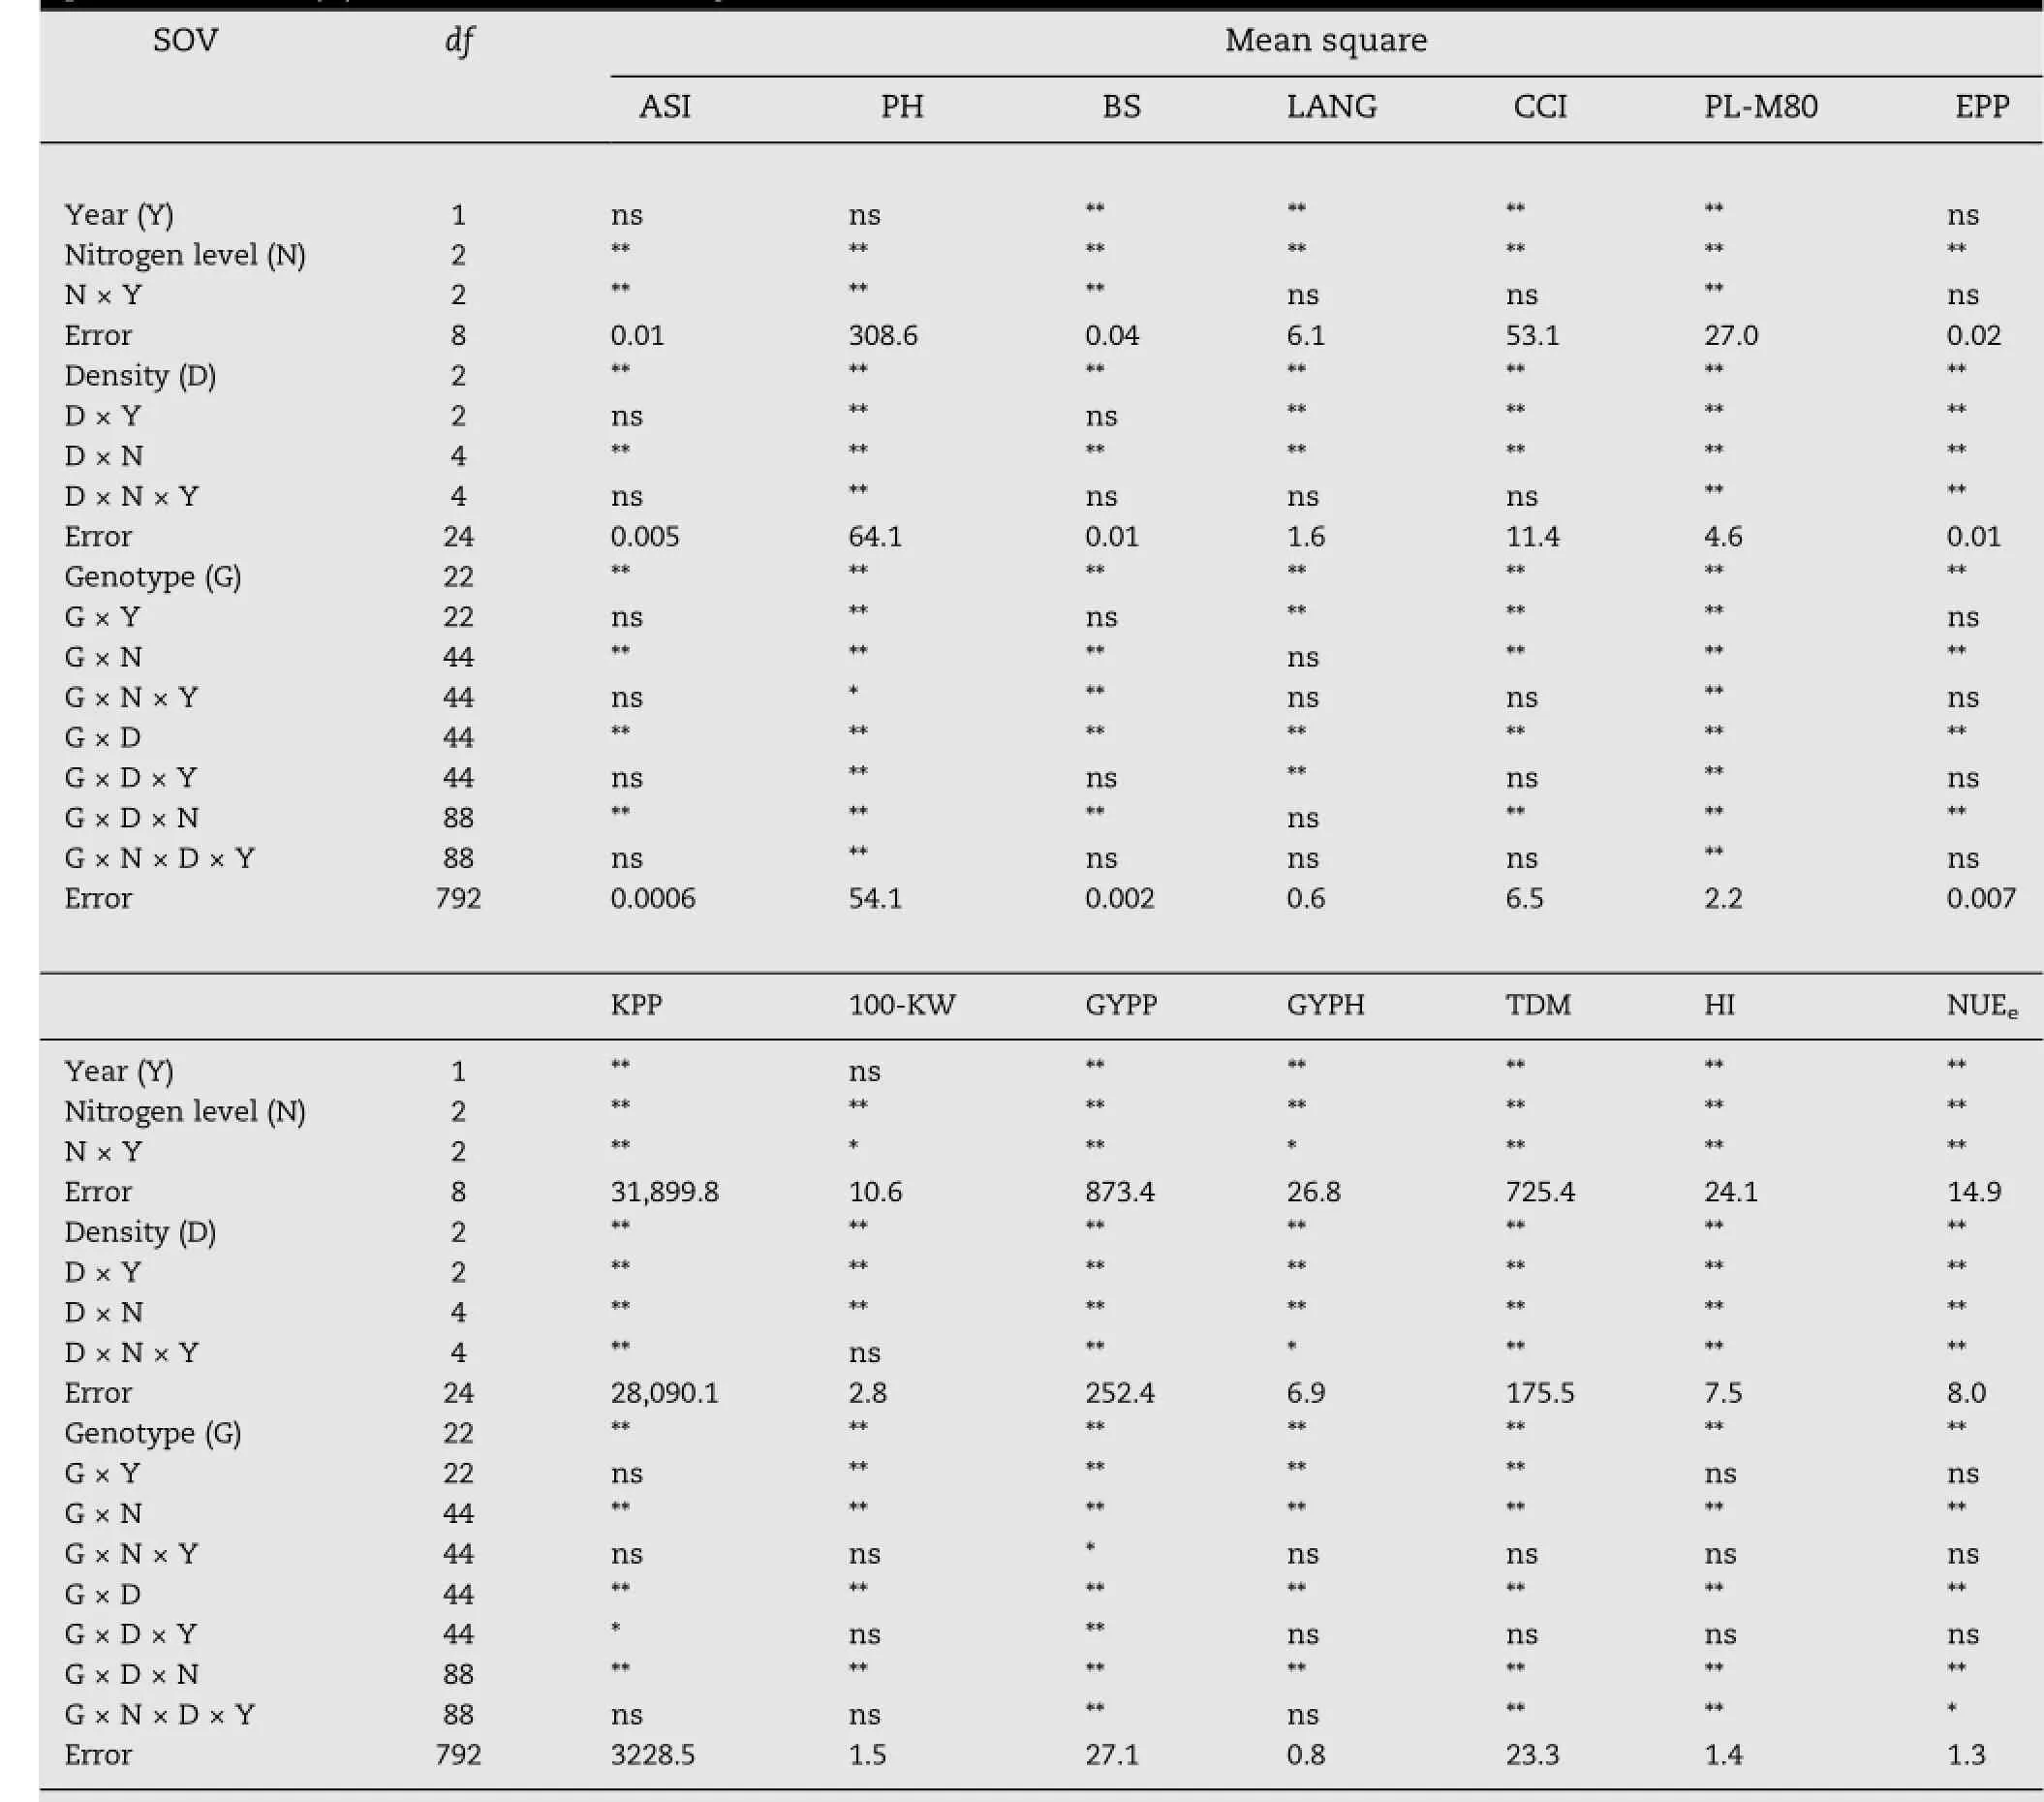
Table 4-Analysis of variance of split-split plot design for 23 maize genotypes under three levels of nitrogen(N)and three plant densities(D)combined across two years.
In contrast,mean squares due to G×N×Y and G×D×Y were not significant for all studied traits,except for PH,BS,and light penetration at the topmost ear 80 days from sowing and grain yield per plant for G×N×Y and PH,LANG,PL-M80,KPP,andGYPPforG×D×Yinteraction,whichweresignificant.Mean squares due to the third-order interaction G×N×D×Y were significant(P≤0.01)for PH,PL-M80,GYPP,TDM,HI,and NUEe.
Combined analysis of variance of a randomized complete block design was performed for 14 traits in one set of diallel crosses among contrasting maize inbreds under each of the nine environments(from E1 to E9),representing combinations of three plant densities×three N levels:E1,high nitrogen and low plant density(HN-LD);E2,high nitrogen and medium plant density(HN-MD);E3,high nitrogen and high plant density(HN-HD);E4,medium nitrogen and low plant density(MN-LD);E5,medium nitrogen and medium plant density(MN-MD);E6,medium nitrogen and high plant density(MN-HD);E7,low nitrogen and low plant density(LN-LD);E8,low nitrogen and medium plant density(LN-MD);and E9,low nitrogen and high plant density(LN-HD)across two seasons(data not presented).Mean squares due to genotypes,parents and crosses under all environments were highly significant for all studied traits,except ASI under E3,E5,E6,and E7;EPP under E8;HI under E7;and E9 and NUEeunder E9 for the inbred parents and BS under E1 through E6 for the F1progeny,indicating the significance of differences among the studied parents and among the F1diallel crosses in the majority of cases.Meansquaresdue to parents vs.F1progenieswere highly significant for all studied traits under all nine environments,except for CCI under E6 and 100-KW under E2,E3,E4,and E6. Mean squares due to the interaction parent×year(P×Y)and cross×year(C×Y)were significant and highly significant for all studied traits under all environments,except for ASI under E3,E5,E6,E7,E8,and E9 for parents×years and E1 and E6 for cross×year,PH under E1 for cross×year,BS under E6 and E8 for P×Y,and under E1,E3,E6,and E8 for C×Y,LANG under E7 for P×Y,CCI under all environments for P×Y and E1 through E5 and E7 through E9 for C×Y,EPP under E1,E2,E4 through E7 for P×Y and E2 and E4 for C×Y,KPP under E1,E2,and E4 throughE6forP×Y,GYPPunderE5forP×Y,GYPHunderE3,E5 throughE8forP×Y,TDMunderE8forP×YandHIunderE6for P×Y and under E6 and E8 for C×Y.Mean squares due to parents vs.cross×year were significant and highly significant in 101 of 162 cases.
3.2.Effects of combinations of plant density and nitrogen level
The effects of nine combinations of three levels of nitrogen and three plant densities on the studied traits are presented in Table 5.The highest GYPP was obtained from E1(a combination of highest N level and lowest plant density),which is reasonable,given that available nitrogen was at a maximumacrossseasons,andaccordinglyweinferredthatthis environment was the best one for GYPP.The percent change,either increasing or decreasing,in traits was then calculated relative to this environment.Both stresses(nitrogen and plant density)were exhibited by E9,E8,E6,and E5 environments,in descending order of severity,with minimum severity in E5,whereas the other environments exhibited only one stress(E2,E3,and E7)or no stress(E1 and E4).It can be observed that the severity of the low nitrogen and high density on GYPP was at a maximum(70.9%and 67.6%reduction for inbreds and hybrids,respectively)underenvironmentE9(LN-HD),wherebothsevere stresses(highest plant density and lowest available nitrogen)were present.The reduction in GYPP due to the effect of both stresses in different combinations showed the descending order E9,E8,E6,and E5(70.9%,61.0%,41.6%,and 32.2%,respectively,for parents and 67.6%,59.5%,39.6%,and 29.6%,respectively,for crosses).Significant reductions in GYPH of maizecrossesobservedinenvironmentsE8andE9relativetoE1(37.7%and 49.6%,respectively)were due to both N and density stresses.ItwasobservedthatreductioninGYPHofboth inbreds and crosses was at a maximum under environment E9(55.5% and 49.6%,respectively)owing to both stresses(highest plant density and lowest available nitrogen).
In contrast,GYPH of both inbreds and hybrids under environments E3 and E2 showed a tendency of increase over that under E1.The highest GYPH was obtained from E3(the combination of highest density and highest N level)for inbreds and hybrids.The maximum increase(41.1%and 18.1%)in GYPH was shown by F1progenies under E3(HN-HD)and E6(MN-HD),respectively,owing to high plant density. Reductions in grain yield resulting from both stresses(elevated plant density and reduced N level)in both inbreds and hybrids were associated with reductions in all yield components(EPP,KPP,100-KW),HI,TDM,CCI,LANG,PL-M50,and DTS.Such reductions were more pronounced in the E9 environment(maximum stresses)followed by E8,E6 and E5,in descending order.Maximum reductions were observed for kernels per plant(81.9%and 82.0%)and CCI(76.5%and 76.8%)for inbreds and hybrids,respectively,under E9,owing to severe stresses of nitrogen and plant density.In contrast,the two stresses together(shown by the four environments E9,E8,E6,and E5)caused increases in BS,ASI,and NUEe.
Rank correlation coefficients for GYPH estimated for pairs of the nine environments are presented in Table 6.In general,the magnitude and number of significant correlation coefficients for GYPH were much higher in inbreds than in hybrids. In both inbreds and hybrids,environment E7(low nitrogen and low plant density)and environment E9(low nitrogen and high plant density)showed no correlation with any other environment for GYPH.The environment E8 was correlated(0.94**)with E9 for GYPH;these two environments were the most stressful.The maximum number of significant correlations(4)in F1progenies was found between E4 and each of E1,E2,E5,and E6(Table 6).
3.3.Genotype×nitrogen×plant density interaction
Mean grain yields per hectare across years under nine combinations of N and D levels for each inbred,hybrid,andcheck are presented in Table 5.The rank of the inbred parents for GYPH was approximately similar in all nine environments,indicating little effect of interaction between inbred,nitrogen level,and plant density on GYPH.The highest GYPH was obtained from E3(HN-HD)for the first group of inbreds(L17,L18,and L53)and E1(HN-LD)followed by E2(HN-MD)for the second group(L29,L54,and L55).With respect to GYPH of the F1crosses,the rank varied from one environment(combination of N level with plant density)to another,especially between environments that combined two stresses with those with only one or no stress,indicating the presence of cross×nitrogen×density interaction and indicating that the GYPH of a cross differed from one combination(of N level with plant density)to another.The highest GYPH in this experiment was obtained under E3(high N,high D)and the highest yielding crosses in this environment were L17×L54(19.90 t ha-1),L17×L18(19.56 t ha-1),L53×L54(18.36 t ha-1),L53×L55(17.89 t ha-1),and L29×L55(17.33 t ha-1),with significant superiority over SC 10(the best check under this environment)by 26.9%,23.3%,15.8%,12.8%,and 9.2%,respectively.

Table 5-Means of studied traits for nitrogen level×plant density interaction across nine environmental conditions combined across two seasons.

Table 5(continued)
The optimum combination of plant density and N level(giving the highest GYPH)in this study was identified for each genotype(Table 7).It differed between inbreds,hybrids,and checks.The optimum environment in this study was E3(HNHD)followed by E2(HN-MD)for the three inbreds L17,L18,and L53,the crosses L18×L53,L18×L29,L18×L55,L29×L55,and L54×L55,and the check cultivar SC 10.For the remaining inbreds(L29,L54,and L55),the optimum combination of density and N level was E1(HN-LD)followed by E2.For crosses L17×L18,L17×L53,L17×L29,L17×L54,L17×L55, L53×L29,L53×L54,L53×L55,and L29×L54 and the check cultivar SC 2066,the optimum combination was E3(HN-HD)followed by E6(MN-HD)and for cross L18×L54 the optimum density was E6(MN-HD)followed by E3(HN-HD).
3.4.Superiority of tolerant(T)to sensitive(S)genotypes
The higher absolute GYPH and lower proportion of reduction in GYPH under high D combined with low N to yield under low-D combined with high-N were considered as an index of tolerance of the combined stresses.Based on this index,the tolerant inbreds were L17,L18,and L53,while the sensitive inbreds were L29,L54,and L55.The F1progenies L18×L53,L18×L55,and L18×L29 were thus considered tolerant and L53×L54,L17×L29,and L17×L18 were considered sensitive crosses.Data averaged for each of the two groups(T and S)for inbreds and hybrids differing in tolerance to both stresses together indicate that GYPH of tolerant(T)was greater than that of the sensitive(S)inbreds and crosses by 17.1%and 36.3%,respectively,under high D combined with low N(no N addition)conditions(Table 8).
Superiority of high-D-low-N tolerant(T)to sensitive(S)inbreds in GYPH under high-D-low-N was associated with superiority in most studied traits,namely GYPP(10.5%),EPP(14.3%),KPP(39.9%),100-KW(9.0%),HI(2.7%),NUEe(10.0%),BS(-11.2%),PH(-9.3%),and ASI(-5.8%).Superiority of T to S crosses in GYPH under low-N was due to their superiority in GYPP(28.3%),EPP(23.4%),KPP(8.0%),100-KW (14.1%),HI(11.6%),NUEe(32.1%),BS(-62.8%),and ASI(-21.7%).The superiority of T to S under low-N for crosses was greater than that for inbreds.
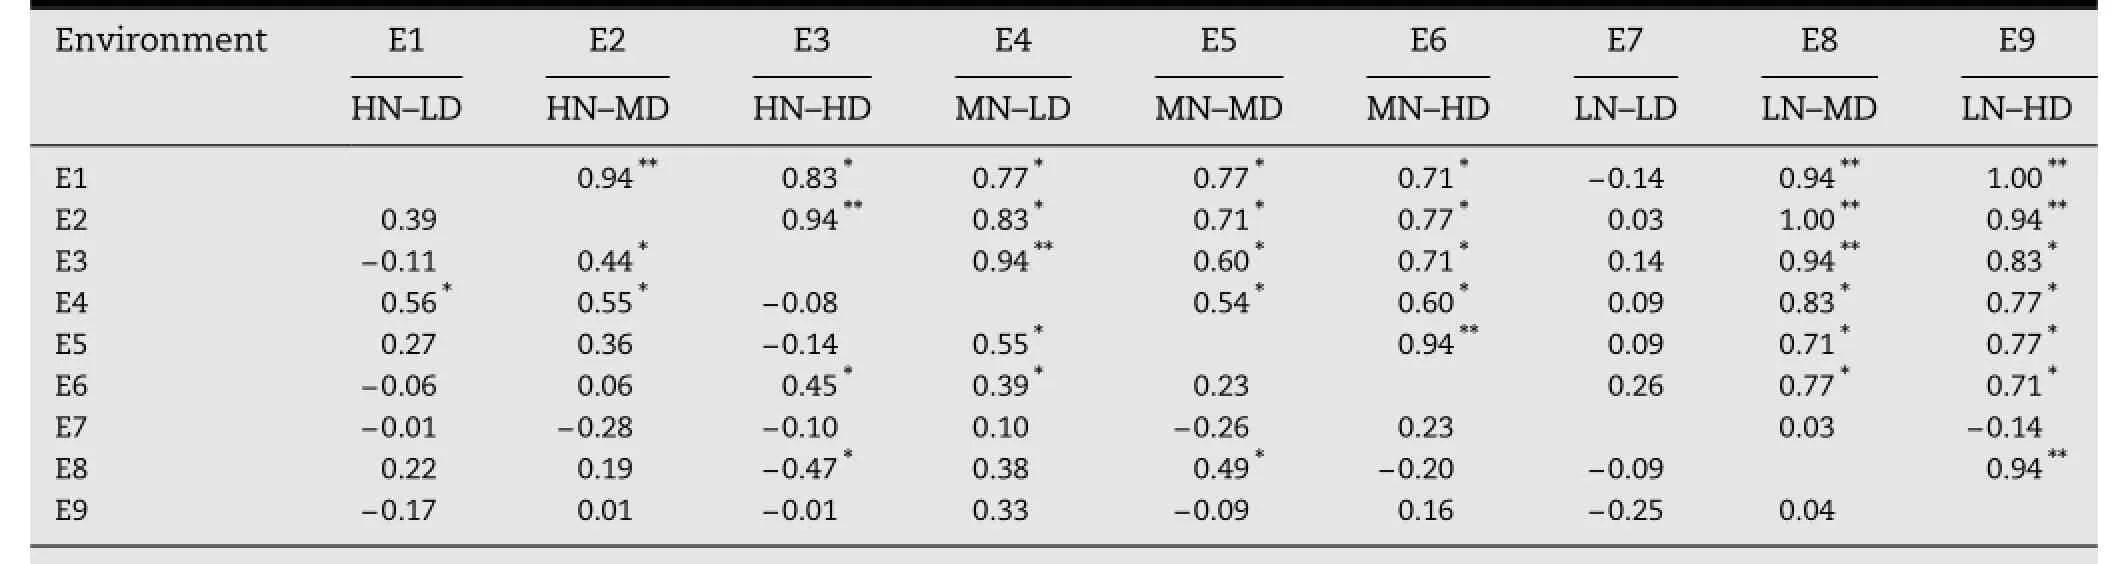
Table 6-Rank pairwise correlation coefficients among nine environments for GYPH of parental inbreds(above diagonal)and F1progenies(below diagonal)across two seasons.
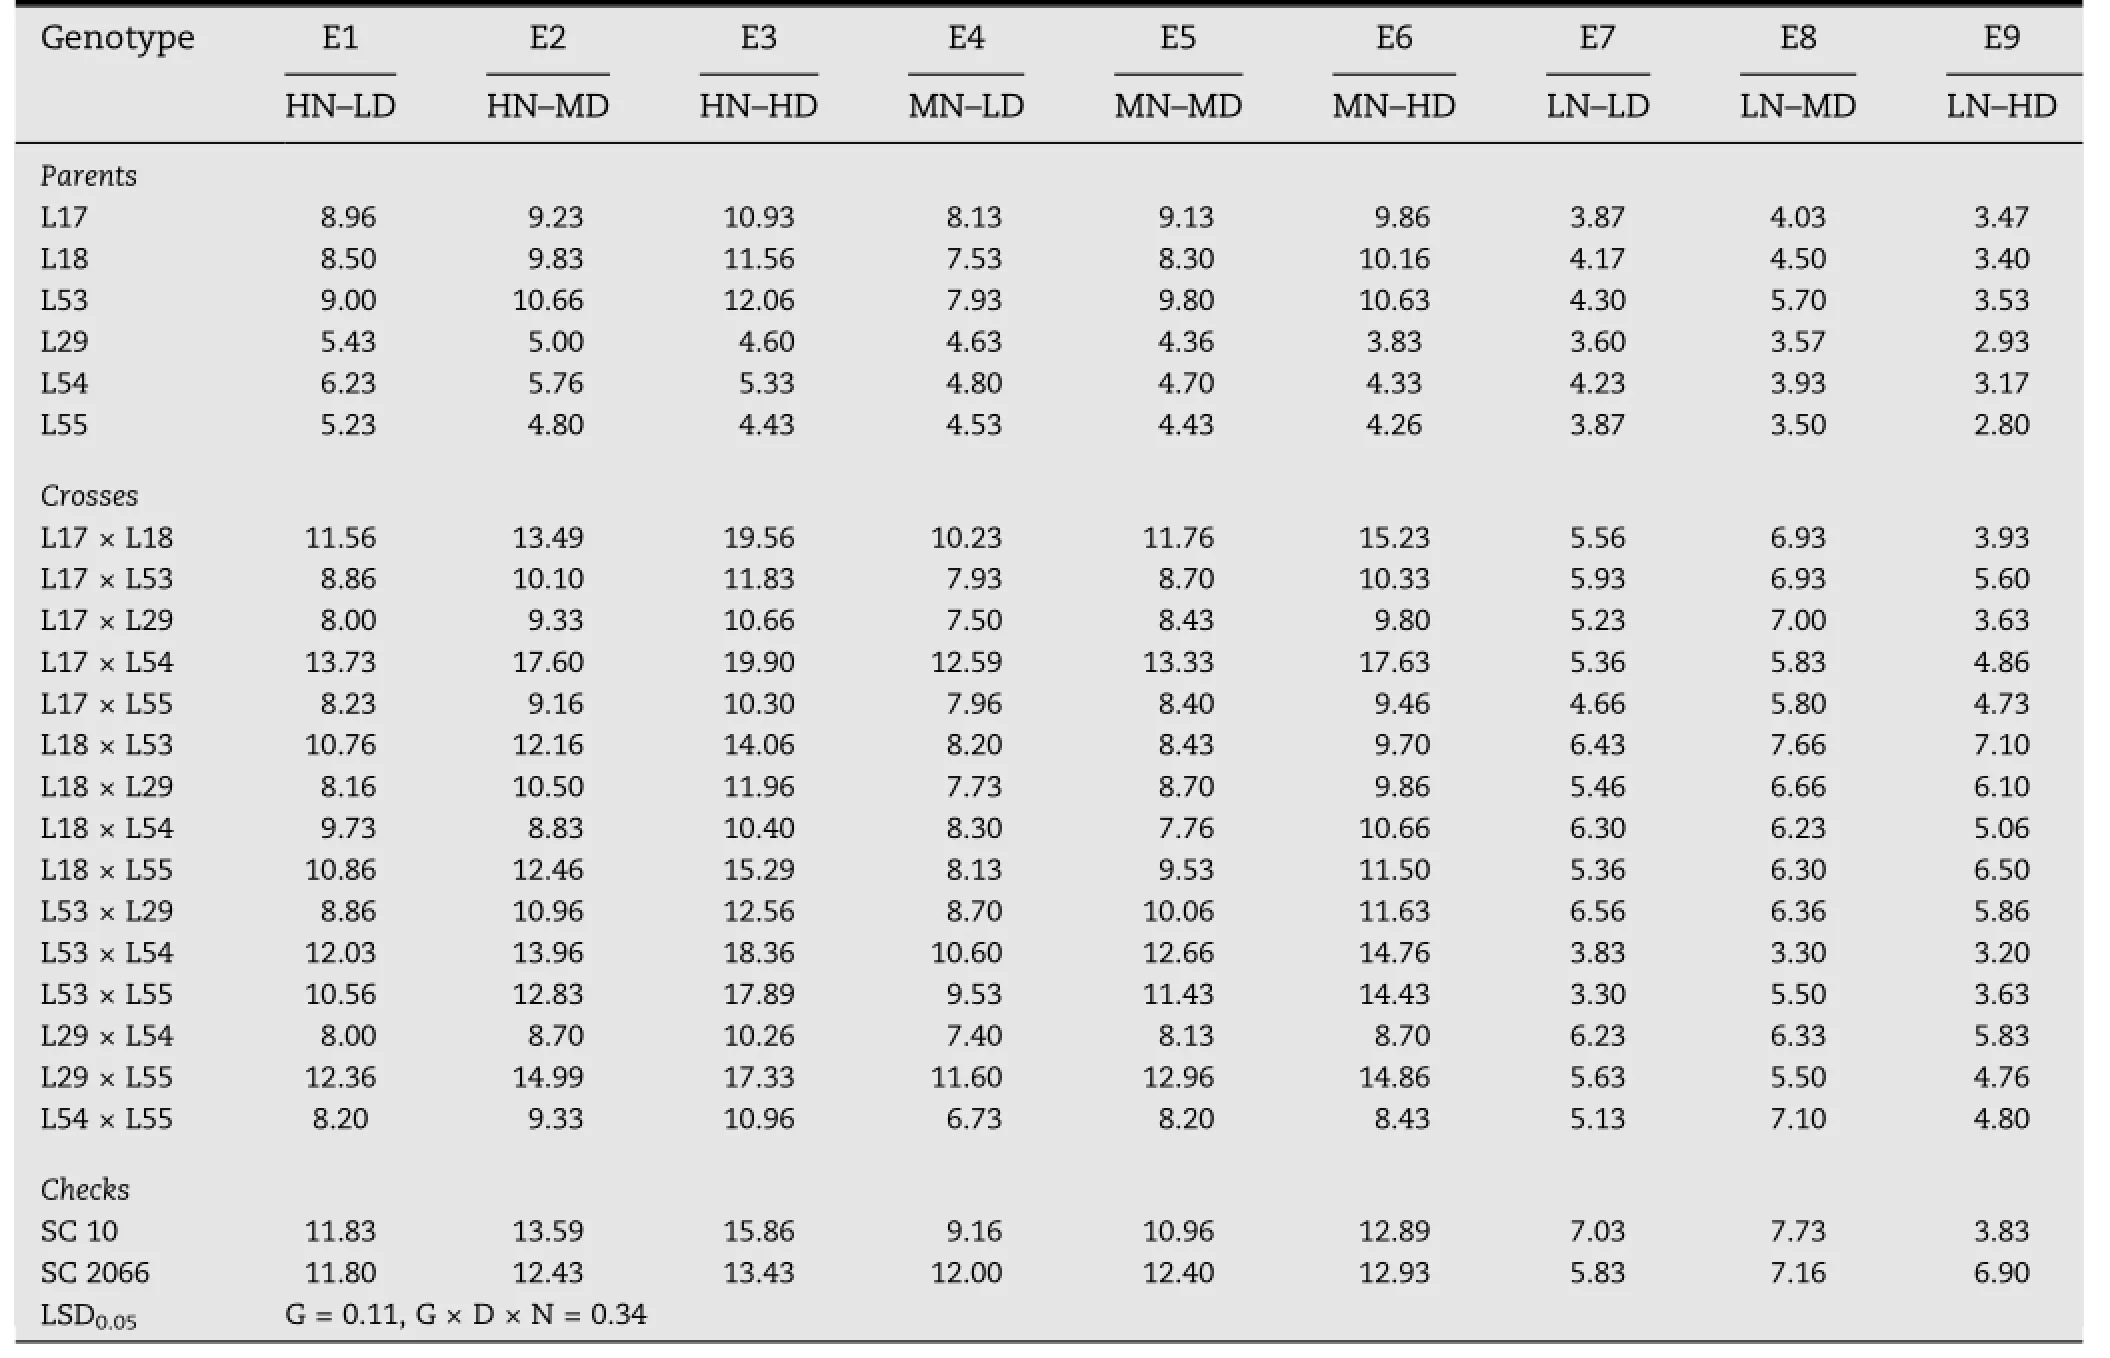
Table 7-Mean grain yield per hectare(t)under nine environmental conditions.
3.5.Differential response of T×T,T×S,and S×S crosses
Mean performance of traits were averaged across three groups of F1crosses,i.e.,T×T,T×S,and S×S groups based on grain yield per hectare of their parental lines under stress and non-stress conditions-that is,both high-D and low-N stresses together-and are presented in Table 9.The numbers of crosses were three,nine and three for the T×T,T×S,and S×S groups,respectively.In general,T×T crosses had more favorable(higher)values for grain yield and its attributes and lower(more favorable)values for DTS,ASI,BS and LANG than S×S and T×S crosses under each stress and both stresses.In general,low-N and high density T×T crosses were the most superior for all studied traits(Table 9),under the most severe environment(E9)where both severe stresses(low-N and density of 40,000 plants ha-1)were present.The T×S crosses for both stresses ranked second for superiority in ASI,PH,PL-M80,EPP,KPP,and 100-KW and the S×S crosses for both stresses ranked second for superiority in the remaining traits(BS,LANG,100-KW,GYPP,GYPH,TDM,HI,and NUEe).
Under low-N and high-D stresses together(E9),grain yield per hectare of low-N and high-D T×T crosses(5.53 t)wasgreater than that of S×S(5.13 t)and T×S(4.8 t)by 7.79%and 14.48%,respectively.This finding indicates that to obtain a cross tolerant of both stresses at the same time,the two parental inbred lines should be tolerant of the same stresses. The superiority of low-N and high-D T×T to S×S and T×S crosses in GYPH under low-N and high-D stresses was due to their superiority in GYPP by 9.5 and 11.7 g,KPP by 70.4 and 55.4,100-KW by 1.6 and 1.6 g,EPP by 0.1 and 0.1,TDM by 13.3 and18.5 g plant-1,HI by 1.7and2.0%,NUEeby4.6 and5.6 g g-1,and PL-M80 by 1.2%and 0.9%,respectively.Moreover,low-N and high-D T×T crosses were earlier in DTS by 4.7 and 1.9 days,hadASIshorterby2.1and1.5 days,PH shorterby10.8 and8.3 cm,BS lowerby 6.7%and12.7%,andLANGnarrowerby 0.1°and 1.3°than S×S and T×S crosses,respectively,under the most severe stresses in this experiment,which were present in the E9 environment.
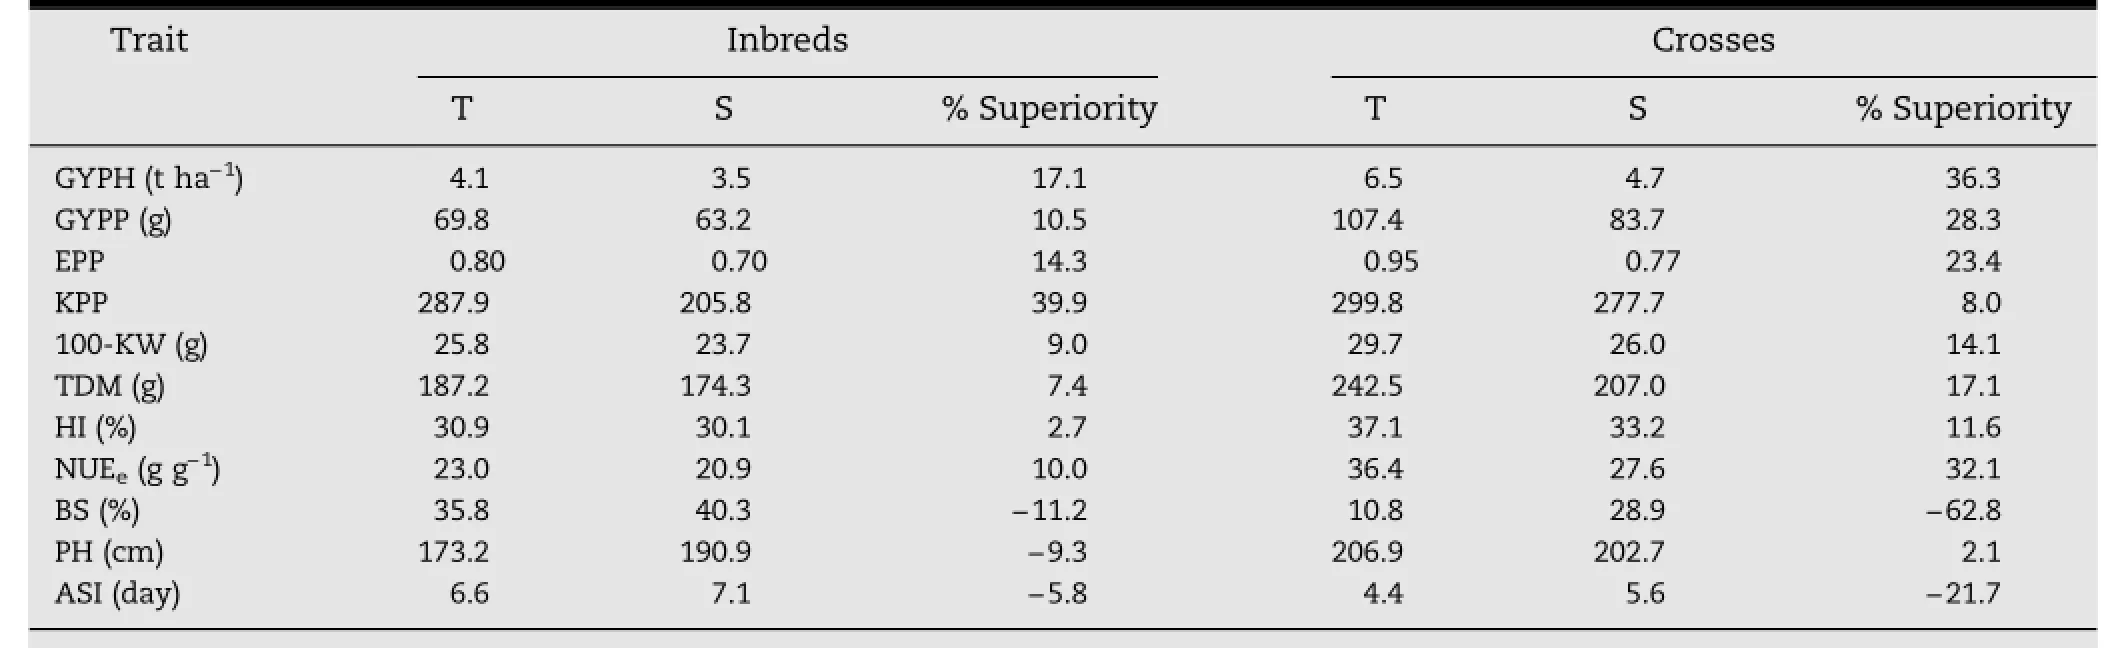
Table 8-Superiority(%)in selected traits of the most three tolerant(T)to the most three sensitive(S)inbreds and crosses to high-D-low-N under high-D-low-N combined across two seasons.

Table 9-Trait differences averaged across the T×T,T×S,and S×S groups of F1progenies for both stresses under the low nitrogen-high plant density environment(E9)across two seasons.
3.6.Grouping genotypes based on tolerance and responsiveness
The mean grain yield per plant or per hectare across years of the studied crosses under low-N-high-D together was plotted against those of the same trait of the same genotypes under high-N and low-D together(Figs.1 and 2)where numbers from 1 to 15 refer to F1hybrid names:1,L17×L18;2,L17×L53;3,L17×L29;4,L17×L54;5,L17×L55;6,L18×L53;7,L18×L29;8,L18×L54;9,L18×L55;10,L53×L29;11,L53×L54;12,L53×L55;13,L29×L54;14,L29×L55;and 15,L54×L55; making it possible to distinguish between efficient and inefficient genotypes on the basis of above-average and below-average grain yield under low-N and high-D together and responsive and non-responsive genotypes on the basis of above-average and below-average grain yield under high-N and low-D together.According to tolerance to both stresses(high density and low nitrogen together and responsiveness to high nitrogen and low-density conditions),the 15 studied crosses were classified into four groups:efficient(tolerant)and responsive,efficient(tolerant)and nonresponsive,inefficient(sensitive)and responsive,and inefficient(sensitive)and nonresponsive.Based on grain yield per plant(Fig.1)or per hectare(Fig.2),the two cross numbers 6(L18×L53)and 9(L18×L55)had the highest GYPP or GYPH under high-N low-D(E1)and low-N high-D(E9),and could thus be considered tolerant(efficient)to both stresses and responsive to the non-stressed environment.
The five cross numbers 4(L17×L54),14(L29×L55),1(L17×L18),12(L53×L55),and 11(L53×L54)were assigned as inefficient(sensitive)but responsive based on GYPP and GYPH.The group of efficient(tolerant to both stresses but not responsive)crosses included crosses 7(L18×L29),2(L17×L53),10(L53×L29),and 13(L29×L54)based on both GYPP and GYPH but included one more cross,8(L18×L54)based on GYPH alone.
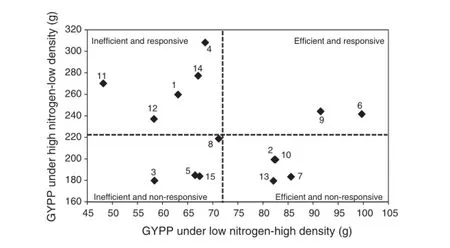
Fig.1-Relationships among grain yields per plant(GYPP)of 15 F1maize hybrids under high nitrogen-low density and low nitrogen-high density combined across two seasons.Broken lines represent means of GYPP(numbers from 1 to 15 refer to F1hybrids in Table 7).
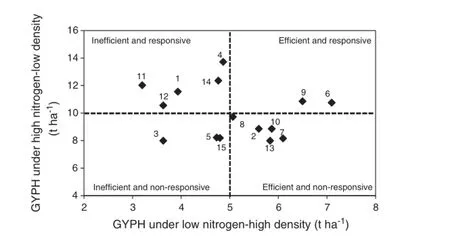
Fig.2-Relationships between grain yield per hectare(GYPH)of 15 F1maize hybrids under high nitrogen-low density and low nitrogen-high density combined across two seasons.Broken lines represent mean of GYPH(numbers from 1 to 15 refer to F1hybrids in Table 7).
In contrast,the group of inefficient(sensitive to both stresses)and nonresponsive to high-N and low-D included crosses 3(L17×L29),5(L17×L55),and 15(L54×L55)based on both GYPP(Fig.1)and GYPH,but included one more cross,8(L18×L54)based on GYPH alone(Fig.2).
3.7.Identifyingappropriatedensityand/oradequateN application
Data were reanalyzed to evaluate GYPH responses of inbreds and hybridsacross varying levelsofstress.For eachgenotypeor group of genotypes,a quadratic regression was fitted for N rate×plant density interaction.The regression functions were used to identify the treatments showing optimum value for each genotype(or group of genotypes).The relationships betweenthenineenvironments(combinationsofthreeNlevels and three plant densities)and grain yield per hectare ha across seasons are illustrated in Fig.3 for inbreds and Fig.4 for F1crosses.The nine environments are arranged in Figs.3 and 4 based on the severity of both N and plant density stresses together,where the poorest environment(E9)represents maximum stress(lowest N and highest plant density),while thebestenvironment(E1)representsthenonstressone(highest N and lowest plant density).The three inbred parents(L17,L18, and L53)showed a quadratic relationship,with the highest GYPH at a density of 95,200 plants ha-1plant density combined with N rate of 570 kg N ha-1.In contrast,the inbreds L54,L29,and L55 showed a weak quadratic relationship,very close to a linear response(Fig.3),with the highest GYPH at a density of 47,600 plants ha-1and N rate of 570 kg N ha-1.The grain yield ha-1across years of all groups of F1progenies showed a quadratic relationship under the nine combinations of plant densitiesandNlevels(Fig.4),exceptcrossesofE-Rgroup,which showed a near-linear relationship.The highest GYPH was achieved under a combination of 95,200 plants ha-1and a fertilization rate of 570 kg N ha-1across the four groups of F1crosses.The group of hybrids most responsive to the improvement of environmental conditions was the E-R group and the least responsive group was I-NR.
4.Discussion

Fig.3-Relationship between GYPH of inbreds and nine environment combinations between three plant densities and three N levels across two seasons.

Fig.4-Relationship between GYPH of four groups of F1crosses:five inefficient and responsive(I-R),two efficient and responsive(E-R),four efficient and non-responsive(E-NR)and four inefficient and non-responsive(I-NR)crosses and nine combinations between three plant densities and three N levels.
To increase maize grain yield per unit area in Egypt,breeding programs should be directed towards the development of inbreds and hybrids with traits adapted to high plant density tolerance.Although high plant density results in interplant competition(especially for light,water,and nutrients),which affects vegetative and reproductive growth of maize[5,10],the use of hybrids tolerant of high density and improvement of fertilization managementpractices would overcome the negative impacts of such competition and lead to maximizing maize productivity per unit area[23].As an alternative breeding strategy,tolerance to high plant population density has been suggested to improve performance under diverse abiotic stresses including drought and low N[30].
In the present study,analysis of variance indicated that each of the three main factors,plant density,N level,and genotype,has a marked effect on all studied traits.In that context,the ranks of maize genotype differ from one nitrogen level to another,from one density to another,and from one year to another.Selection for improved performance under a specific combination of soil nitrogen and plant density is possible,as proposed by several investigators[31-33].Significance of mean squares due to parents vs.F1progenies and those due to parents vs.cross×year indicated the presence of heterosis and indicated that heterosis differed from season to season for most studied characters.
The highest GYPP for all genotypes was achieved in environment E1(a combination of highest N level and lowest plant density).This result may be attributed to the high CCI,which promotes photosynthesis and high TDM,an indicator of high N absorption by plants(Table 5).However,the highest GYPH was obtained from E3(a combination of highest density and highest N level)for the inbreds and hybrids.This result could be attributed to the highest values of CCI and TDM and the lowest values of ASI and BS(Table 5).However the economic application of fertilizer should be taken into consideration and awaits a separate study.
Reductions in grain yield resulting from both stresses(elevated plant density and reduced N level)incurred by the four environments E9,E8,E6,and E5 in both inbreds and hybrids were associated with reductions in all yield components(EPP,KPP,100-KW),harvest index,TDM,CCI,LANG,PL-M50,and DTS.However,the two stresses together caused increases in BS,ASI(unfavorable),and NUEe(favorable). Maximum increases appeared under E9 followed by E8 environment and by BS trait(Table 5).It is noteworthy that plant height of both parents and crosses showed a tendency to increase under the E5 and E6 environments,but to decrease under E8 and E9.The PH increase under E5 and E6 may be attributed to elevated levels of plant density,whereas the reduction under E8 and E9 may be due to the severe N stress.
Correlation analysis among environments indicated that theinteractionofinbredswithdifferentenvironments(combinations of three plant densities×three N-levels)was much lower than that of F1crosses.The crosses thus have higher sensitivity to differences between environments than the inbreds,because heterozygotes are more responsive to improved environments than homozygotes,expressed in grain yield per hectare.This conclusion agrees with those of Rodrigues et al.[34]and Monneveux et al.[35].
The percent reduction in GYPH due to both stresses,relative to E3(HN-HD),which gave the highest GYPH,was smaller in the low-performing lines(L29,L54,and L55)than in the high-performing ones(L17,L18,and L53),a finding that could be attributed to the lower yield potential of the first than the second group of lines,under favorable environmental conditions.The first group of lines was accordingly considered tolerant(T)to both stresses expressed in GYPH,while the second one was considered sensitive(S).
Some hybrids in this experiment showed significant superiority to the best check in the respective environment(one cross under E9,five crosses under E6,and two crosses under E5).These superiorities reached 36.65%over SC 2066 under E6 for the cross L17×L54(the best cross in this experiment).It is noteworthy that the five crosses(L17×L54,L17×L18,L53×L54,L53×L 55,and L29×L55)were considered the most responsive,while other crosses(L18×L53,L18×L55,L18×L29,L53×L29,and L29×L54)were considered the most tolerant to both stresses(low N combined with high density).
Superiority of T to S inbreds and crosses may be attributed to the high nitrogen use efficiency traits of the hybrids,due to heterosis,relative to their inbred parents.These results are in agreement with those reported by several investigators[36-39].The superiority of modern maize hybrids tolerant of high plant density has also been attributed to decreasedbarrenness[40],more leaf erectness[7],synchronization of 50%anthesis with 50%silking[41]and increased prolificacy(more ears per plant)[42].A shortened ASI is considered an indication of higher flow of assimilates to the developing ears during the early reproductive stage under conditions of high density stress[43,44].High plant density-tolerant genotypes display shorter ASI than intolerant ones[45-47].Al-Naggar et al.[33]also reported that under high plant density,tolerant testcrosses showed 314.4%more GYPP,115.0%more KPP,48.4% heavier100-KW,42.9%moreEPP,98.2%lessBSand63.3%shorter ASI than sensitive testcrosses.Mansfield and Mumm [48]reported that in U.S.maize germplasm evaluated for plant density tolerance,a subset of traits including leaf angle,upper stem diameter,leaf area required to produce a gram of grain,kernel rows per ear,days to canopy closure,barrenness,kernels plant-1,kernel length,leaf number,upper leaf area,staygreen,zipper effect,kernels per row,and anthesis-to-silking interval were associated with grain yield across plant densities ranging from 47,000 to 133,000 plants ha-1.
CIMMYT breeders found that maize grain yield under low N was closely related to some secondary traits such as improved N-uptake,high plant nitrate content,large leaf area,high specific leaf-N content,ears plant-1,ASI and leaf senescence[19,44,49].These results are consistent with those reported by Al-Naggar et al.[32].Reduction in barren stalks and shortening in ASI of tolerant as compared to sensitive inbreds and hybrids in the present study are desirable and may be considered as important contributors to low-N as well as to high-density tolerance.Similar conclusions have been reported by several investigators[33,43-48,50].
In general,low-N and high density T×T crosses were the most superior for all studied traits(Table 9),under the most severe environment(E9)where both severe stresses(low N and density of 40,000 plants ha-1)were present.The T×S crosses for both stresses ranked second for superiority in ASI,PH,PL-M80,EPP,KPP,and 100-KW and the S×S crosses for both stresses ranked second for superiority in the remaining traits(BS,LANG,100-KW,GYPP,GYPH,TDM,HI,and NUEe). In general,crosses classified as low-N and high-density tolerant×low-N and high-density tolerant crosses in terms of grain yield under low-N and high-D stresses showed better nitrogen use efficiency traits and high density-adaptation traits such as lower values of DTS,ASI,PH,BS,and LANG than low N-and high density-sensitive×low N-and high density-sensitive crosses.
Basedonthegroupingofgenotypesproposedby Sattelmacher et al.[51],the 15 crosses in this study could be classified into four groups:efficient(tolerant)and responsive,efficient(tolerant)and nonresponsive,inefficient(sensitive),and responsive and inefficient(sensitive)and nonresponsive. Based on grain yield per plant(Fig.1)or per hectare(Fig.2),the two crosses L18×L53 and L18×L55 had the highest GYPP or GYPH under high-N low-D(E1)and low-N high-D(E9),and could thus be considered tolerant(efficient)to both stresses and responsive to the nonstress environment.
The relationships between the nine environments and grain yield per hectare(GYPH)showed near linearity for inbreds L54,L29,and L55 and hybrids L18×L53 and L18×L55,with the highest GYPH at a density of 47,600 plants ha-1and N rate of 570 kg N ha-1and curvilinearity for inbreds L17,L18, and L53 and the rest of the hybrids with the highest GYPH at a density of 95,200 plants ha-1combined with an N rate of 570 kg N ha-1.The cross L17×L54 showed the highest grain yield in this study under both high N-high-D(19.9 t ha-1)and medium N-high-D environments(17.6 t ha-1).
In this context,Shapiro and Wortmann[52]reported that corn grain yield typically exhibits a quadratic response to plant density with a near-linear increase across a range of low densities,a gradually decreasing rate of yield increase relative to density increase,and finally a yield plateau at relatively high plant density.Clark[23]reported little yield response to N rates above 90 kg N ha-1at low and high densities,as there was a curvilinear increase until a yield plateau at low density(8.1 Mg ha-1at 133.0 kg N ha-1)and high density(5.9 Mg ha-1at 102.0 kg N ha-1).He added that response to N was greatest at the middle density(83,980 plants ha-1),as there was a quadratic response with maximum yield at 188.0 kg N ha-1(8.7 Mg ha-1).He found that across the low-stress environments,the lowest density(44,460 plants ha-1)responded little to N rates above 90 kg N ha-1,whereas there was greater response to N rates at the middle density(13.5 Mg ha-1at 162.0 kg N ha-1)andthehighdensity(13.4 Mg ha-1at 174.0 kg N ha-1).He found no support for the idea that increasing corn yield requires increases in both plant density and N rate above rates typically used.In a recent Indiana study,Boomsma et al.[26]showed that under large ranges of plant density (54,000-104,000 plants ha-1)and N rate(0-330 kg N ha-1),higher densities required more N.This finding seems reasonable,given the prevailing belief that high yields require more plants and that more plants require more N.These and our results advance our understanding of N rate-plant density interaction under contrasting environmental conditions,but understanding the complexities of hybrid interactions with N rate and plant density will require additional work.
5.Conclusion
Some newly developed maize genotypes could double maize productivity,reaching 19.9 t ha-1in the cross L17×L54 on the same land unit area,if they are grown at twice the plant population density of 95,200 plants ha-1used in Egypt,but provided they are given the highest N fertilization tested in this experiment(570 kg N ha-1).Fortunately,the same cross also gave the highest grain yield(17.6 t ha-1)under medium N(285 kg N ha-1)and high plant density(95,200 plants ha-1).A cost-return analysis for extra yield and extra N for HN-HD vs. MN-HD of this cross,based on Egyptian market prices,revealed that the additional cost of extra unsubsidized N(284 kg N ha-1)was 258.8 U.S.dollars and the return due to grain yield increase(2.3 t ha-1)was 638.9 U.S.dollars,with a profit of ca.380 U.S.dollars ha-1that deserves to be considered.In this study,the best combination of plant population density and N level for giving the highest grain yield per unit land area was identifiedforthestudiedmaizegenotypes.Thebestcombination in the present study was high N(570 kg N ha-1)×high density(95,200 plants ha-1)for three of six inbreds and 14 of 15 F1crosses,whereas it was high N(570 kg N ha-1)×low density(47,600 plants ha-1)fortheremaining threeinbredsandmediumN (285 kg N ha-1)×high density(95,200 plants ha-1)for the remaining cross(L18×L54).
Acknowledgment
The authors would like to acknowledge Toshka Agric.Co.,Egypt for providing inbred lines used as parents of the diallel crosses,authorities of the Agricultural Research and Experiment Station of the Faculty of Agriculture,Cairo University for providing all the facilities needed for the present research,and professors of crop breeding in the Agronomy Department,Cairo University,especially Prof.M.S.Radwan and Prof.M.F. Abdalla,for reviewing the data and manuscript.
R E F E R E N C E S
[1]Ministry of Agriculture and Land Reclamation-Arab Republic of Egypt,Central Management of Agricultural Extension,Agronomic Practices of Maize,Ext.Bull.1283(2014).
[2]A.M.Hashemi,S.J.Herbert,D.H.Putnam,Yield response of corn to crowding stress,Agron.J.97(2005)839-846.
[3]G.K.Huseyin,M.K.Omer,Effect of hybrid and plant density on grain yield and yield components of maize(Zea mays L.),Indian J.Agron.48(2003)203-205.
[4]D.N.Duvick,K.G.Cassman,Post-green revolution trends in yield potential of temperate maize in the North-Central United States,Crop Sci.39(1999)1622-1630.
[5]M.Tollenaar,J.Wu,Yield improvement in temperate maize is attributable to greater stress tolerance,Crop Sci.39(1999)1597-1604.
[6]D.N.Duvick,J.Smith,M.Cooper,Long-term selection in a commercial hybrid maize breeding program,in:J.Janick(Ed.),Plant Breeding Reviews,John Wiley and Sons,New York,2004,pp.109-151.
[7]C.Radenovic,K.Konstantinov,N.Delic,G.Stankovic,Photosynthetic and bioluminescence properties of maize inbred lines with upright leaves,Maydica 52(2007)347-356.
[8]W.D.Widdicombe,D.Kurt.Thelen,Row width and plant density effects on corn grain production in the northern Corn Belt,Agron.J.94(2002)1020-1023.
[9]E.S.Bunting,Plant density and yield of grain maize in England,J.Agric.Sci.(Camb.)81(1973)455-463.
[10]F.Tetio-Kagho,F.P.Gardner,Response of maize to plant population density:II.Reproductive developments,yield,and yield adjustment,Agron.J.80(1988)935-940.
[11]C.G.Poneleit,D.B.Egli,Kernel growth rate and duration in maize as affected by plant density and genotype,Crop Sci.19(1979)385-388.
[12]F.J.Betran,D.Beck,M.Banziger,G.O.Edmeades,Secondary traits in parental inbred and hybrids under stress and non stress environment in tropical maize,Field Crops Res 83(2003)51-56.
[13]M.E.Otegui,Kernel set and flower synchrony within the ear of maize:plant population effects,Crop Sci.37(1997)448-455.
[14]D.L.Karlen,C.R.Camp,Row spacing,plant population and water management effects on corn in the Atlantic Coastal Plain,Agron.J.77(1985)393-398.
[15]F.Bavec,M.Bavec,Effect of maize plant double row spacing on nutrient up take,leaf area index and yield,Rost.Vyroba. 47(2002)135-140.
[16]W.Liu,M.Tollenaar,G.Stewart,W.Deen,Response of corn grain yield to spatial and temporal variability in emergence,Crop Sci.44(2004)847-854.
[17]T.D.Biswas,S.K.Mukherjee,Text Book of Soil Science,5th ed Tata McGraw-Hill,New Delhi,1993.170-197.
[18]N.C.Brady,R.R.Weil,The Nature and Properties of Soils,13th ed.Pearson Education Ltd.,USA,2002.
[19]M.Banziger,H.R.Lafitte,Efficiency of secondary traits for improving maize for low-nitrogen target environments,Crop Sci.37(1997)1110-1117.
[20]M.Banziger,G.O.Edmeades,D.Beck,M.Bellon,Breeding for drought and nitrogen stress tolerance in maize:from theory to practice(online),2000.68(Available at http:// www.cimmyt.mx/,Mexico,D.F.,CIMMYT).
[21]M.Banziger,G.O.Edmeades,H.R.Lafitte,Selection for drought tolerance increases maize yields across a range of nitrogen levels,Crop Sci.39(1999)1035-1040.
[22]P.S.Bhatt,Response of sweet corn hybrid to varying plant densitiesandnitrogenlevels,Afr.J.Agric.Res.7(2012)6158-6166.
[23]R.A.Clark,Hybrid and plant density effects on nitrogen response in corn(MS Thesis)Fac.Graduate,Illinois State University,Urbana,2013.
[24]M.I.Tajul,M.M.Alam,S.M.M.Hossain,K.Naher,M.Y.Rafii,M.A.Latif,Influence of plant population and nitrogen-fertilizer at various levels on growth and growth efficiency of maize,Sci.World J.1(2013)1-9.
[25]P.M.O'Neill,J.F.Shanahan,J.S.Schepers,B.Caldwell,Agronomic responses of corn hybrids from different eras to deficit and adequate levels of water and nitrogen,Agron.J.96(2004)1660-1667.
[26]C.R.Boomsma,J.B.Santini,M.Tollenaar,T.J.Vyn,Maize morphophysiological responses to intense crowding and low nitrogen availability:an analysis and review,Agron.J.101(2009)1426-1448.
[27]R.H.Moll,E.J.Kamprath,W.A.Jackson,Analysis and interpretation of factors which contribute to efficiency of N utilization,Agron.J.74(1982)562-564.
[28]G.W.Snedecor,W.G.Cochran,Statistical Methods,8th ed. Iowa State University Press,Ames,Iowa,1989.
[29]R.G.D.Steel,G.H.Torrie,D.A.Dickey,Principles and Procedures of Statistics:A Biometrical Approach,third ed. McGraw-Hill,New York,1997.
[30]T.A.Khaliq,A.H.Ahmad,M.A.Ali,Maize hybrid response to nitrogen rates at multiple locations in semiarid environment,Pak.J.Bot.41(2009)207-224.
[31]A.Y.Kamara,A.Menkir,I.Kureh,L.O.Omoigui,F.Ekeleme,Performance of old and new maize hybrids grown at high plant densities in the tropical Guinea savanna,Commun. Biometry Crop Sci.1(2006)41-48.
[32]A.M.M.Al-Naggar,R.Shabana,T.H.Al-Khalil,Tolerance of 28 maize hybrids and populations to low-nitrogen,Egypt.J. Plant Breed.14(2010)103-114.
[33]A.M.M.Al-Naggar,R.Shabana,A.M.Rabie,Per se performance and combining ability of 55 new maize inbred lines developed for tolerance to high plant density,Egypt.J.Plant Breed.15(2011)59-84.
[34]L.R.F.Rodrigues,N.Da Silva,E.S.Mori,Baby corn single-cross hybrids yield in two plant densities,Crop Breed.Appl. Biotechnol.3(2003)177-184.
[35]P.Monneveux,P.H.Zaidi,C.Sanchez,Population density and low nitrogen affects yield-associated traits in tropical maize,Crop Sci.45(2005)535-545.
[36]H.R.Lafitte,G.O.Edmeades,Association between traits in tropical maize inbred lines and their hybrids under high and low soil nitrogen,Maydica 40(1995)259-267.
[37]G.Shieh,C.Ho,H.Lu,The effect of nitrogen rate on the combining ability and heterosis in maize traits,J.Agric.Res. China 44(1995)15-25.
[38]J.G.Kling,S.O.O.Keh,H.A.Akintoy,H.T.Heuberger,W.J. Horst,Potential for developing nitrogen use efficient maize for low input agriculture system in the moist Savannas of Africa,Proceedings of a conference on Developing Droughtand Low N Tolerant Maize,March 25-29,1997,pp.490-501(El-Battan,Mexico).
[39]E.E.Gama,I.E.Marriel,P.E.O.Guimaraes,S.N.Parentoni,M.X. Santos,C.A.P.Pacheco,W.F.Meireles,P.H.E.Ribeiro,A.C.D. Oliveira,Combining ability for nitrogen use in a selected set of inbred lines from a tropical maize population,Rev.Bras. Milho Sorgo 1(2002)68-77.
[40]J.C.William,Corn silage and grain yield responses to plant densities,J.Prod.Agric.10(1997)405-409.
[41]G.O.Edmeades,J.Bolanos,M.Hernandez,S.Bello,Causes for silk delay in a lowland tropical maize population,Crop Sci.33(1993)1029-1035.
[42]L.C.Miller,B.L.Vasilas,R.W.Taylor,T.A.Evans,C.M. Gempesaw,Plant population and hybrid consideration for dryland corn production on drought-sensitive soils,Can. J.Plant Sci.75(1995)87-91.
[43]E.W.Dow,T.B.Daynard,J.F.Muldoon,D.J.Major,G.W. Thurtell,Resistance to drought and density stress in Canadian and European maize(Zea mays L.)hybrids,Can.J. Plant Sci.64(1984)575-583.
[44]G.O.Edmeades,J.Bolanos,S.C.Chapman,H.R.Lafitte,M. Banziger,Selection improves drought tolerance in a tropical maize population:gains in biomass,grain yield and harvest index,Crop Sci.39(1999)1306-1315.
[45]L.L.Buren,J.J.Mock,I.C.Anedrson,Morphological and physiological traits in maize associated with tolerance to high plant density,Crop Sci.14(1974)426-429.
[46]D.L.Beck,J.Betran,M.Banziger,M.Willcox,G.O.Edmeades,From landrace to hybrid:Strategies for the use of source populations and lines in the development of drought tolerant cultivars,Proceedings of a Symposium held on 25-29 March,1997,CIMMYT,El Batan,Mexico,1997,pp.369-382.
[47]B.D.Mansfield,R.H.Mumm,Survey of plant density tolerance in U.S.maize germplasm,Crop Sci.54(2014)157-173.
[48]S.K.Vasal,H.Cordova,D.L.Beck,G.O.Edmeades,Choices among breeding procedures and strategies for developing stress tolerant maize germplasm,Proceedings of Symposium held on March 25-29,1996,CIMMYT,El Batan,Mexico,D.F.,1997,pp.336-347.
[49]H.R.Lafitte,G.O.Edmeades,Improvement for tolerance to low soil nitrogen in tropical maize:I.Selection criteria,Field Crops Res.39(1994)1-14.
[50]A.M.M.Al-Naggar,R.Shabana,A.M.Rabie,Genetics of maize rapid silk extrusion and anthesis-silking synchrony under high plant density,Egypt.J.Plant Breed.16(2012)173-194.
[51]B.Sattelmacher,W.J.Horst,H.C.Becker,Factors thatcontribute to genetic variation for nutrient efficiency of crop plants,Z.fur Planzenernährung und Bodenkunde 157(1994)215-224.
[52]C.A.Shapiro,C.S.Wortmann,Corn response to nitrogen rate,row spacing and plant density in Eastern Nebraska,Agron.J. 98(2006)529-535.
1 July 2014
in revised form
.
E-mail address:medhatalnaggar@gmail.com(A.M.M.Al-Naggar).
Peer review under responsibility of Crop Science Society of China and Institute of Crop Science,CAAS.
http://dx.doi.org/10.1016/j.cj.2015.01.002
2214-5141/©2015 Crop Science Society of China and Institute of Crop Science,CAAS.Production and hosting by Elsevier B.V.All rights reserved.
杂志排行
The Crop Journal的其它文章
- Effects of cultivation of OsrHSA transgenic rice on functional diversity of microbial communities in the soil rhizosphere
- An AFLP marker linked to the leaf rust resistance gene LrBi16 and test of allelism with Lr14a on chromosome arm 7BL
- Genetic variation for phytic acid content in mungbean(Vigna radiata L.Wilczek)
- Quantifying cardinal temperatures and thermal time required for germination of Silybum marianum seed
- Characterization and mapping of QTLs on chromosome 2D for grain size and yield traits using a mutant line induced by EMS in wheat
- Reduced grain chalkiness and its possible physiological mechanism in transgenic rice overexpressingL-GalLDH