Characterization and mapping of QTLs on chromosome 2D for grain size and yield traits using a mutant line induced by EMS in wheat
2015-11-12GuizhiZhangYingyingWangYingGuoYanZhaoFanmeiKongSishenLi
Guizhi Zhang,Yingying Wang,Ying Guo,Yan Zhao,Fanmei Kong,Sishen Li*
State Key Laboratory of Crop Biology/Shandong Key Laboratory of Crop Biology,Shandong Agricultural University,Tai'an 271018,China
Characterization and mapping of QTLs on chromosome 2D for grain size and yield traits using a mutant line induced by EMS in wheat
Guizhi Zhang,Yingying Wang,Ying Guo,Yan Zhao,Fanmei Kong,Sishen Li*
State Key Laboratory of Crop Biology/Shandong Key Laboratory of Crop Biology,Shandong Agricultural University,Tai'an 271018,China
A R T I C L E I N F O
Article history:
15 November 2014
Accepted 4 January 2015
Available online 13 January 2015
Common wheat
Mutant
Simple sequence repeat(SSR)
Quantitative trait locus(QTL)
Grain size trait
Yield trait
Production of mutants with altered phenotypes is a powerful approach for determining the biological functions of genes in an organism.In this study,a high-grain-weight mutant line M8008 was identified from a library of mutants of the common wheat cultivar YN15 treated with ethylmethane sulfonate(EMS).F2and F2:3generations produced from crosses of M8008×YN15(MY)and M8008×SJZ54(MS)were used for genetic analysis.There were significant differences between M8008 and YN15 in plant height(PH),spike length(SL),fertile spikelet number per spike(FSS),grain width(GW),grain length(GL),GL/GW ratio(GLW),and thousand-grain weight(TGW).Most simple correlation coefficients were significant for the investigated traits,suggesting that the correlative mutations occurred in M8008.Approximately 21%of simple sequence repeat(SSR)markers showed polymorphisms between M8008 and YN15,indicating that EMS can induce a large number of mutated loci.Twelve quantitative trait loci(QTLs)forming QTL clusters(one in MY and two in MS)were detected.The QTL clusters coinciding with(MY population)or near(MS population)the marker wmc41 were associated mainly with grain-size traits,among which the M8008 locus led to decreases in GW,factor form density(FFD),and TGW and to increases in GLW.The cluster in the wmc25-barc168 interval in the MS population was associated with yield traits,for which the M8008 locus led to decreased PH,spike number per plant(SN),and SL.
©2015 Crop Science Society of China and Institute of Crop Science,CAAS.Production and hosting by Elsevier B.V.All rights reserved.
1.Introduction
Common wheat(Triticum aestivum L.)provides one-fifth of the calories consumed by humans[1].With increasing world population,it has been estimated that the global demand for wheat will increase by a further 40%by 2020[2].Accordingly, higher yield is the primary objective in wheat breeding programs.Grain yield can be divided into several direct components:spike number per unit area,grain number per spike,and thousand-grain weight(TGW).Mainly because of its effect on yield,increased grain size continues to be a major selection and breeding target in wheat[3,4].Grain shape and
http://dx.doi.org/10.1016/j.cj.2014.11.002
2214-5141/©2015 Crop Science Society of China and Institute of Crop Science,CAAS.Production and hosting by Elsevier B.V.All rights reserved.size,density,and uniformity are important attributes determining the market value of wheat grain,given that they influence millingperformance (flourqualityandyield). Theoretical models have predicted that milling yield could be increased by optimizing grain shape and size,with large and spherical grains being the optimum grain morphology[5].
Yield and grain size traits in wheat are complex characters,and are quantitative in nature[6].Grain-size traits are usually represented in plant breeding practice by TGW,which is determined mainly by grain width,length,and thickness[7,8]. All three aspects are positively correlated with TGW [9,10]. Quantitative traitloci(QTLs)foryieldcomponentssuchasgrain weight have been mapped on almost all 21 wheat chromosomes[11].Therehavealso been QTLstudies of grain-size traits[8-10,12-14].
A powerful approach for determining the biological functions of genes in an organism isthe production of mutants with altered phenotypes and physiological responses.Among mutagens that have been used,alkylating agents such as ethylmethane sulfonate(EMS)are particularly effective.EMS can form adducts with nucleotides,causing them to mispair with their complementary bases and introducing base changes after replication[15].EMS-induced mutants havebeen created inrice[16],maize[17],barley[18],diploid wheat[19,20],and hexaploid wheat[21,22].Some genes,such as klu,regulating seed size[23],and als3-1,required by seedlings for growth in aluminum-toxic environments[24],have been isolated using EMS-induced mutations in Arabidopsis thaliana.However,genetic studies of EMS-induced mutants in wheat are rare.
M8008 is an EMS-induced common wheat mutant with high grain weight isolated in our laboratory.The main aim of the present study was to determine the chromosomal locations of QTLs for grain size and yield-related traits using two populations derived from M8008 and Chinese winter wheat varieties.
2.Materials and methods
2.1.Plant materials
M8008 was identified from a library of mutants of the wheat cultivar Yannong 15(YN15)induced by EMS treatment of dry seeds.M8008 had a higher TGW,plant height(PH),and spike length(SL)than YN15.YN15 is a popular cultivar released in 1982 and planted over 6.7 million ha in the past 30 years in Shandong province,China.
For genetic analysis,F2populations(200 plants)and a derived F2:3progeny(200 lines)were produced from crosses of M8008×YN15(MY population)and M8008×Shijiazhuang 54(SJZ54)(MS population).YN15 and SJZ54 have lower TGW than M8008.SJZ54 is a Chinese winter cultivar released in 1964.
2.2.Field trials and trait evaluation
For the F2populations,planting rows were 2.5 m in length,spaced 23.3 cm apart and 10.0 cm between plants,in the wheat growing season of 2008-2009.Ten plants per F2:3progeny were planted in a single row with 10 cm between plants and 23.3 cm between rows in the 2009-2010 season.The trials were performed on the experimental farm of Shandong Agricultural University,Tai'an,China.Normal field management was applied during the growth season.The field had loamy soil,and the grain yield was approximately 8000 kg ha-1.
Plant morphological traits,including PH,SL,spike number per plant(SN),fertile spikelet number per spike(FSS),and grain number per spike(GN),were evaluated with three spikes of each plant ten days before harvest.After harvest,grain traits were evaluated:three samples of 20 grains from each plant were lined up lengthwise along a ruler with a precision of 0.1 mm to measure grain length(GL),and then the grains were arranged breadthwise to measure grain width(GW).The GL/GW ratio(GLW)was calculated.Factor form density(FFD),calculated as grain weight/(grain length×grain width),describes differences in grain density and the deviation of a shape from a cylindrical form [25].TGW was evaluated by weighing two samples of 100 grains from each plant.
For F2:3progeny,all investigated traits were described by the mean values of five plants for the corresponding line from each F2individual.
2.3.Simple sequence repeat(SSR)analysis
DNAwas extractedfrom fresh young leaves of eachplant inthe F2bytheSDSmethod[26].PCRamplificationwasperformedina 20 μL mixture containing 1×PCR buffer,100 ng DNA,3 mmol MgCl2,1.5 mmol dNTP,1 pmolofeach primer,and 1 UTaq DNA polymerase.Amplifications were performed under the following conditions:5 min at 94°C;35 cycles of 30 s at 94°C,30 s at 50-60°C and 30 s at 72°C;and a final extension step of 10 min at 72°C.PCR products were separated in 6%denaturing polyacrylamide gels.Bands amplified from M8008 and individuals containing its alleles were termed as“A”,those from YN15 or SJZ54 were termed as“B”,and individuals from whom both“A”and“B”could be amplified were termed as“H”.
A total of 903 SSR markers distributed evenly on the genetic map[27],and 166 expressed sequence tag(EST)-SSR markers developed by our laboratory[28],were used for a polymorphism survey.Primer sequences for SSR markers were obtained from GrainGenes 2.0(http://wheat.pw.usda. gov/GG2/).Markers were initially analyzed in the parents and a preferred small group(PSG)[29]comprising five typical lowand five high-TGW plants in the F2of the MY population.The polymorphic SSRs were further used to assay the F2populations.In a preliminary analysis to determine whether the grain size traits were controlled by loci on chromosome 2D,the SSR and EST-SSR markers on 2D were used to analyze the MY and MS F2populations.
2.4.Genetic mapping and QTL analysis
The linkage map was constructed with Mapmaker 3.0[30]. CentiMorgan units(cM)were calculated using the Kosambi mappingfunction[31].QTLswereanalyzedusingamixedlinear model in QTLNetwork 2.0[32].Composite interval analysis was performed using forward-backward stepwise multiple linear regressions with a probability of 0.05 for adding and removing markers from the model,and a window size of 10 cM. Significance thresholds for QTL detection were calculated for each dataset using 1000 permutations and genomewide error rates of 0.10(suggestive)and 0.05(significant).
3.Results
3.1.Phenotype of M8008 and its F2and F2:3populations
The whole-life phenotypic data of M8008 were collected and compared with those of YN15.Clear differences appeared after the elongation stage,especially after the booting stage(Fig.1).For PH,SL,FSS,GL,GLW,GW,and TGW,variances of M8008 were significantly greater than those of YN15 by F-test. However,for SN,GN,and FFD,the variance differences were not significant(Table 1,Fig.1).For M8008 and SJZ54,all traits were significantly different except for GLW and FFD(Table 1,Fig.1).

Fig.1-Phenotypic comparison of YN15,M8008,and SJZ54.A and E show YN15;B and F show M8008;C and G show SJZ54.For D and H,YN15 is on the left and M8008 on the right.For I and J,YN15 is at top,M8008 is in the middle,and SJZ54 is at bottom.A,B,and C:Plants at the later filling stage;D:plants at the booting stage;E,F and G:spikes at the later filling stage;H:young spikes;I and J:kernels after harvest.The scale bars are 5 cm in A,B,and C;2 cm in E,F,and G;and 5 mm in I and J.

Table 1-Phenotypic performance for grain size and yield traits of M8008,YN15,and SJZ54.
For the two F2and F2:3populations,there was a wide range of variation,with coefficients of variation(CVs)ranging from 3.65%to 34.90%in the F2and from 3.03%to 22.63%in the F2:3. Almost all CVs for corresponding traits were larger for the MS than for the MY population,indicating larger variation in the MS population(Table 2).Transgressive segregation was observed for all investigated traits(Table 1,Table 2).All traits exhibited continuous distributions,suggesting their quantitative inheritance(Fig.2).
3.2.Correlation between traits
Most simple correlation coefficients(r)were significant.All r values were significant between yield traits(PH,SN,SL,FSS,and GN)except for those for PH and GN in the F2:3of MY and SL and GN in the F2:3of MS(Table 3).All r values were significant between grain-size traits(GL,GW,GLW,FFD,and TGW),except for those of FFD and GL/GW/GLW in the F2:3of MY and GLW and GL in the F2of MY and MS.Most r values between yield traits and grain-size traits were significant. These results indicated that the traits were highly correlated. In other words,these traits showed correlative variation,determined by simultaneously mutated loci.
3.3.Polymorphism of SSR markers and map construction
A total of 1069 SSR and EST-SSR markers were used to detect polymorphism between M8008 and YN15 and 222 markers(20.8%)showed polymorphism between them.Of these,191 polymorphic markers had been located on genetic linkage maps in previous studies(http://wheat.pw.usda.gov/GG2/). The polymorphic markers were distributed on all 21 wheat chromosomes(including 66 markers located on more than one chromosome)(Table 4)and were used for further polymorphism detection in the PSG.Twenty-four markers were polymorphic in the PSG,and these markers were used to scan the F2of MY population for the preliminary analysis.Finally,marker wmc41 on chromosome 2D[27]was linked to TGW,GW,and FFD by correlation analysis,whereas the other twenty-three markers were not linked to TGW or grain-size traits.We accordingly used the markers on chromosome 2D to detect polymorphisms in the F2generation.One hundred and fifty-three polymorphic markers on chromosome 2D were used to construct linkage maps for the MY and MS populations.Of these,34 markers detected polymorphism between M8008 and YN15,while 64 detected polymorphism between M8008 and SJZ54.After the two F2populations were screened using the polymorphic markers,linkage maps of 2D having total genetic lengths of 115.2 cM for MY(Fig.3A)and 250.4 cM for MS(Fig.3B)were constructed.The map derived from the MY population was generally consistent with that from the MS population.
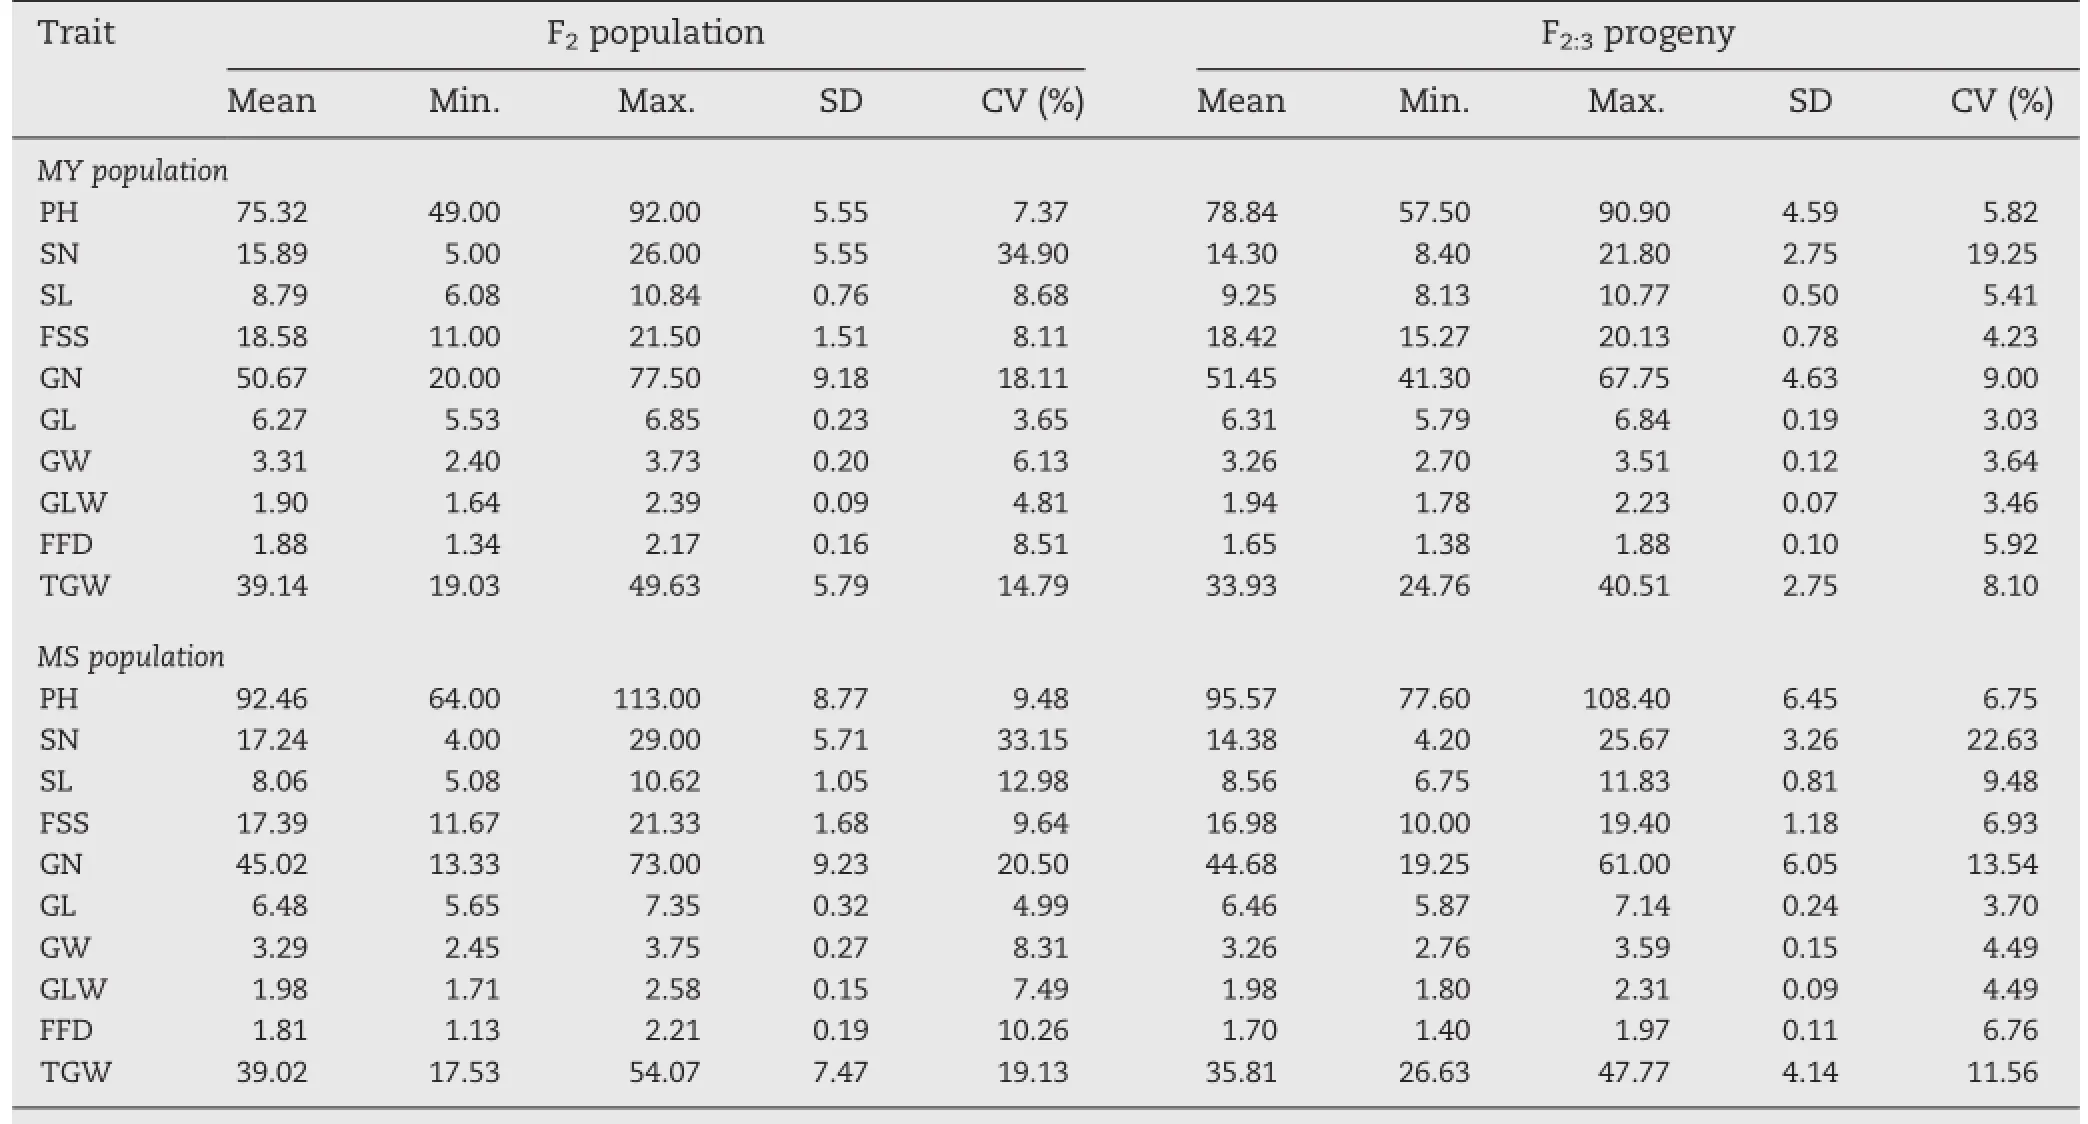
Table 2-Phenotypic performance for grain and yield traits in F2and their F2:3progeny for MY and MS populations.

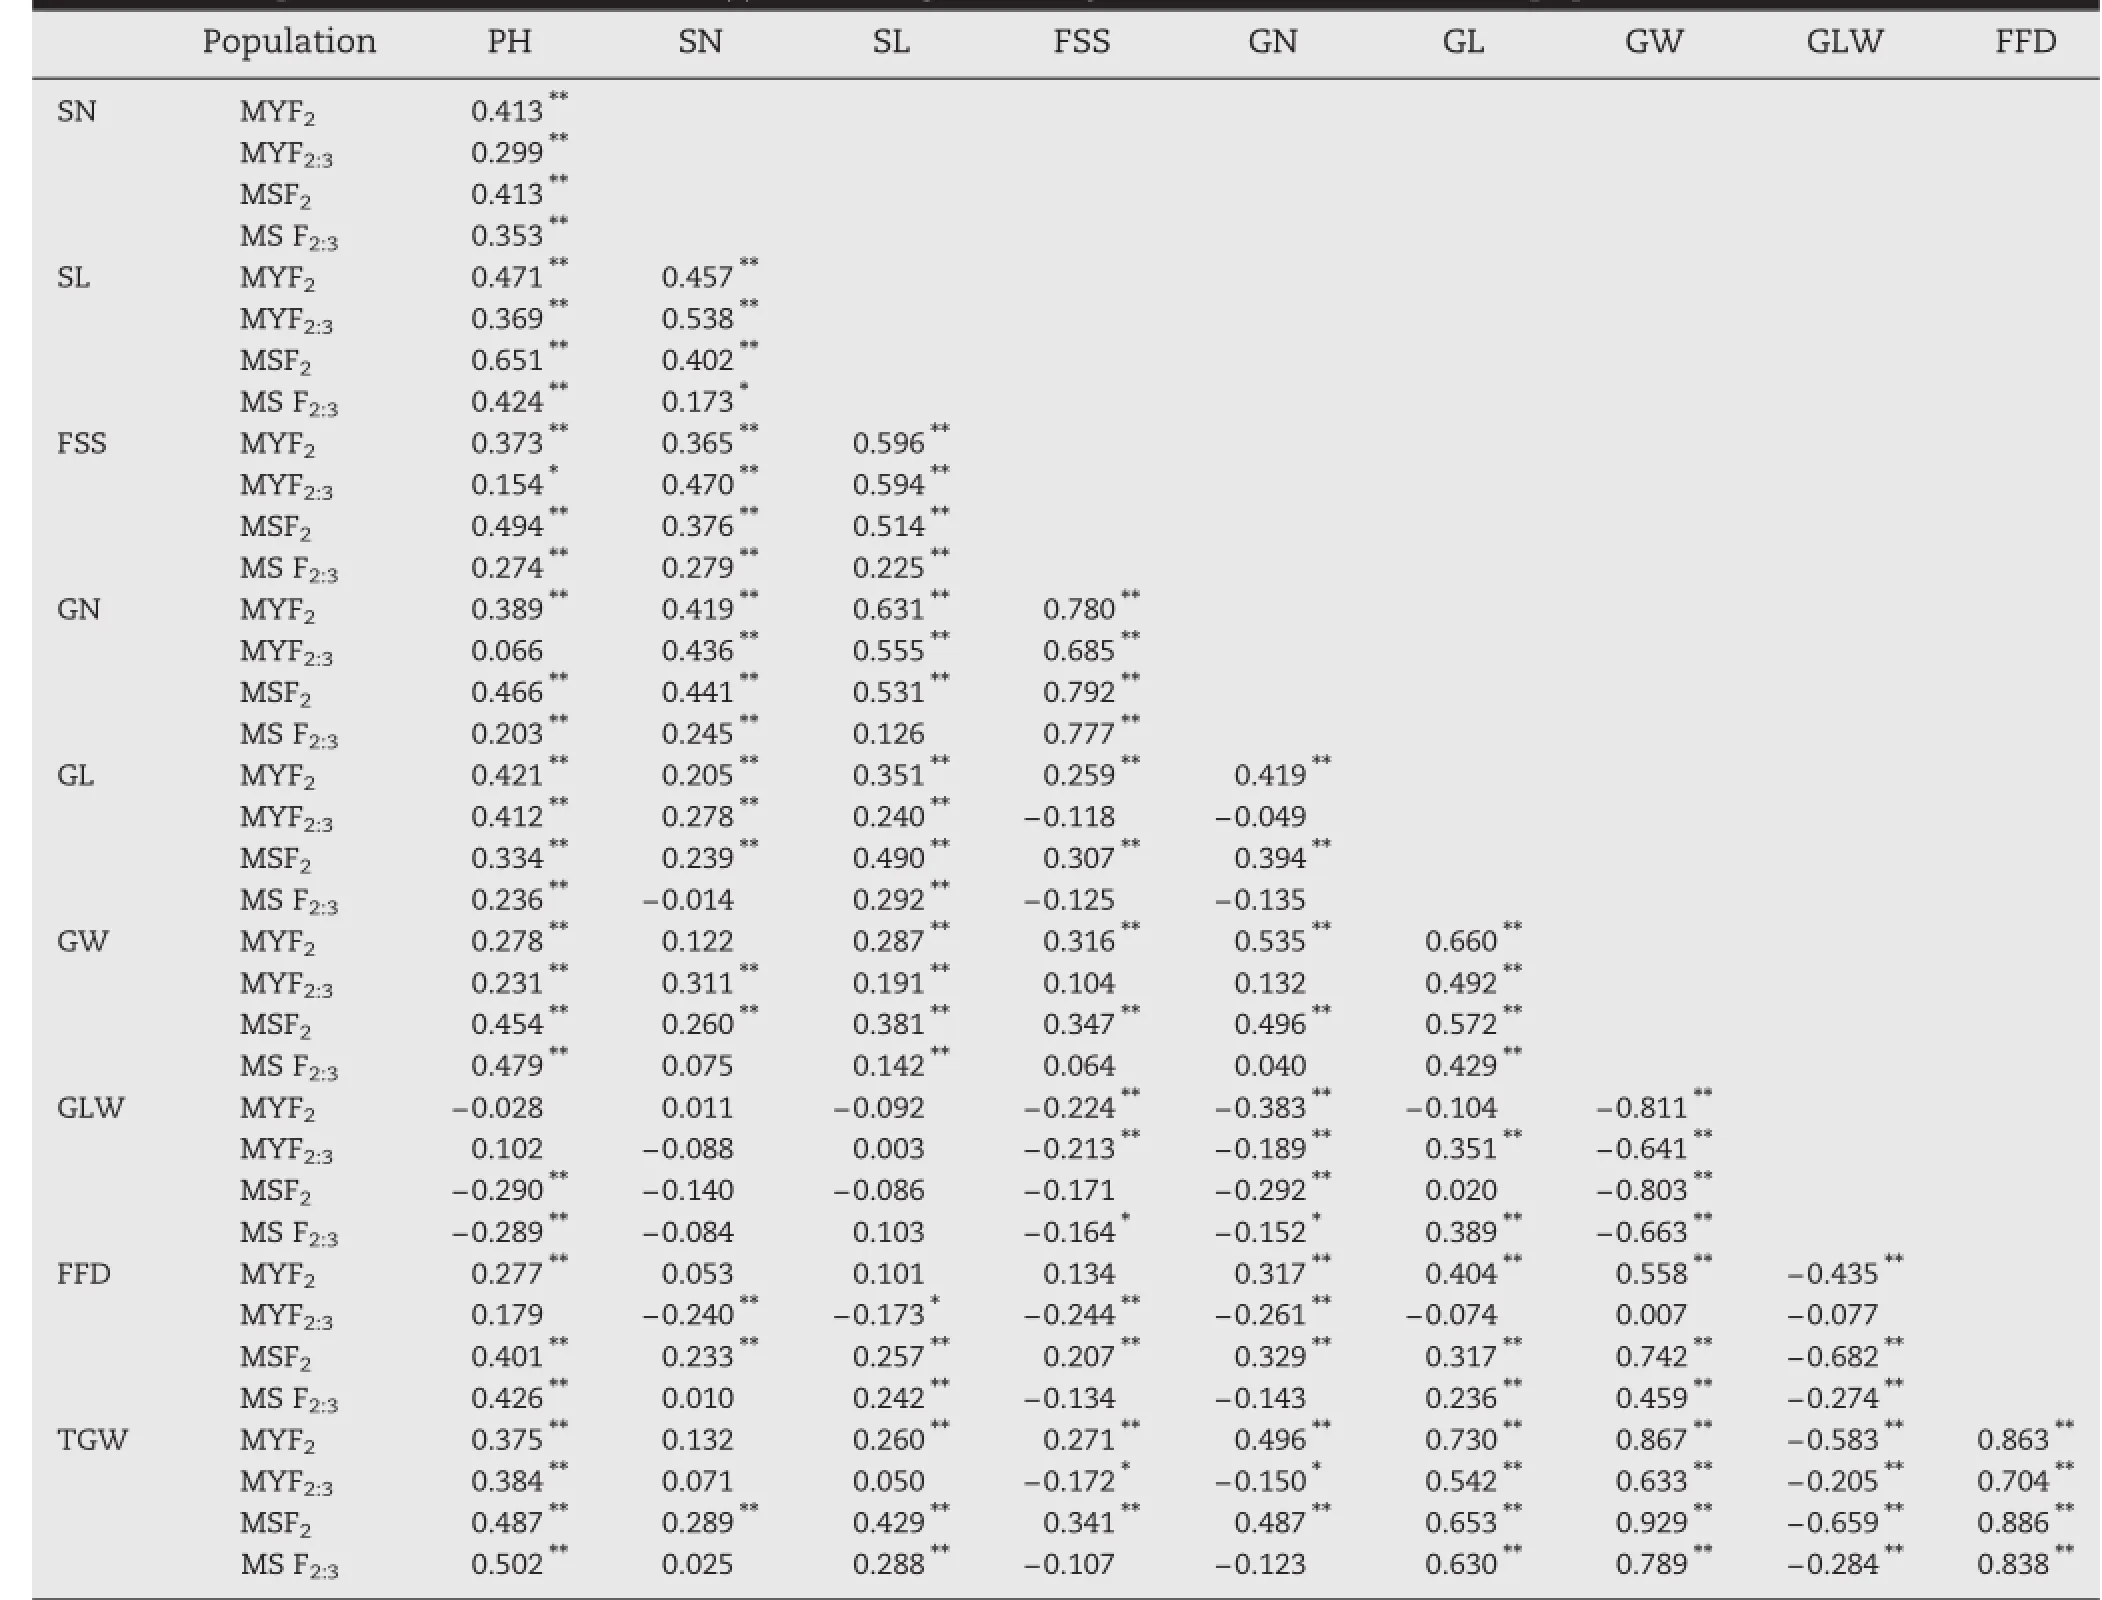
Table 3-Simple correlation coefficients(r)between grain and yield traits for MY and MS populations.
3.4.QTL analysis
For the MY population,no additive QTLs in the F2and five QTLs in the F2:3were identified(Table 5,Fig.3).Four QTLs,QSl,QGw,QGlw,and QTgw,were detected in the marker interval cfd233-gs2a and formed a QTL cluster.The additive effects of QSl and QGlw were positive,with the M8008 allele increasing the effects of the QTLs,whereas those of QGw and QTgw were negative,with the YN15 allele increasing the effects.
For theMS population,seven QTLs were identified,including four QTLs detected in both the F2and F2:3,forming two QTL clusters(Table 5,Fig.3).For the cluster in the wmc25-barc168 interval,three QTLs,QPh,QSn,and QSl were detected. Of these,QSl was found in both the F2and F2:3.The additive effects of the three QTLs were all negative,with the SJZ54 allele increasing the effects.The cluster in the gwm539-wmc41 interval comprised four QTLs,QGw,QGlw,QFfd,and QTgw.Ofthese,QGw,QFfd,and QTgw were found in both the F2and F2:3. The additive effectsofQGw,QFfd,and QTgw were negative,with theSJZ54alleleincreasing theeffects,whereasthatof QGlw was positive,with the M8008 allele increasing the effects.
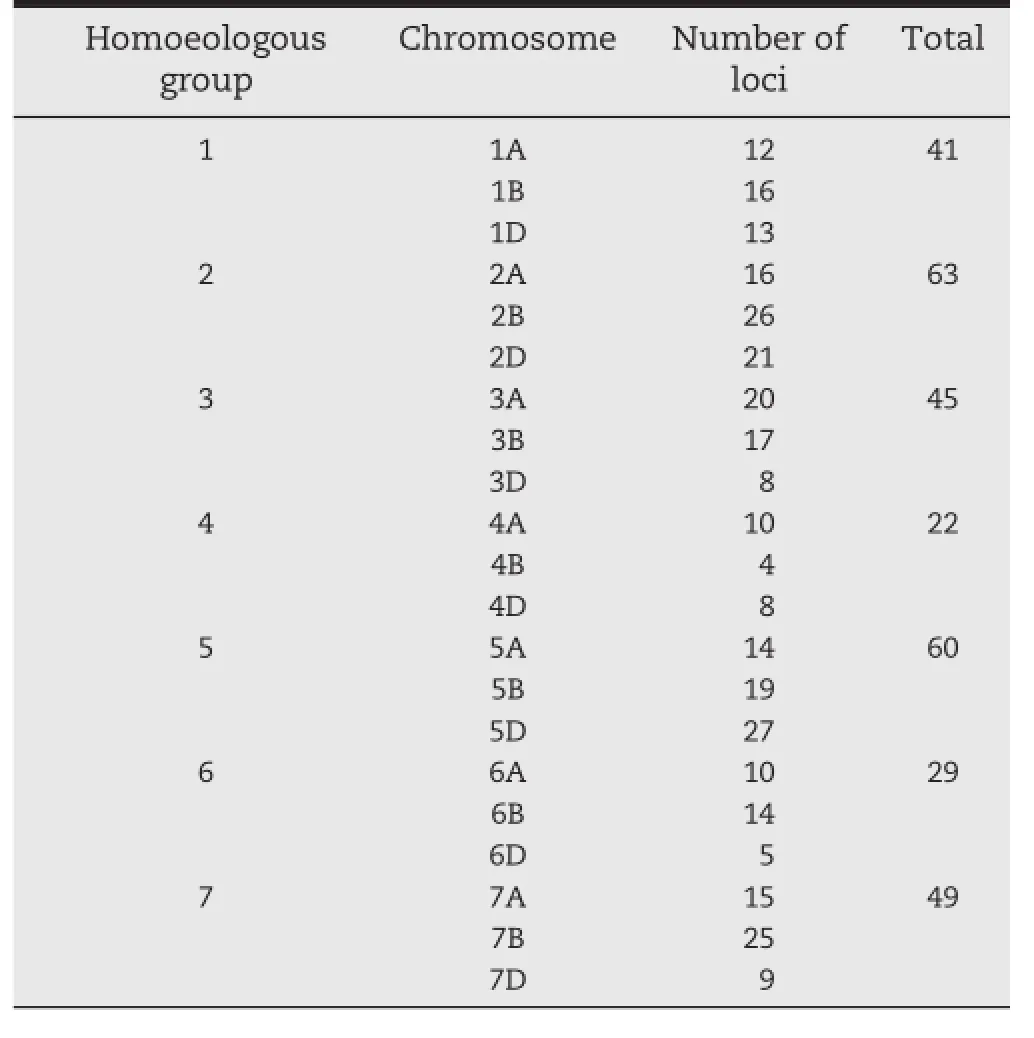
Table 4-Numbers of polymorphic loci detected between YN15 and M8008 of SSR markers distributed on chromosomes.
A single QTL was explaining 6.36-18.26%of phenotypic variations.Of which,the contributions of some QTLs were higher with more than 10%,including QSl in F2:3of MY and F2and F2:3of MS,QGw in F2:3of MY and F2of MS,QGlw in F2:3of MY,and QTgw in F2:3of MY.
4.Discussion
4.1.SSR polymorphisms and the mechanism of mutation induced by EMS
In the present study,20.8%of markers showed polymorphisms between the mutant line M8008 and the wild-type YN15 over the whole genome,indicating that EMS can induce a large number of mutated loci.However,for chromosome 2D,the number(34)of polymorphic markers between M8008 and YN15 was sharply fewer than that(64)between M8008 and cultivar SJZ54,indicating that variation between M8008 and YN15 was lower.
The polymorphic SSR fragments between M8008 and YN15 were of two types:presence or absence of the fragment(type 1),accounting for 14 polymorphic markers(41.2%)on chromosome 2D,and different fragment lengths(type 2),accounting for the other 20 polymorphic markers(58.8%)on 2D(Fig.4). Type 1 fragments may have been produced by the classical mechanism of EMS mutagenesis(a G/C-to-A/T change)in the primer binding regions of the SSR marker[15,33].Type 2 fragments,however,are likely to have been caused by the insertion or deletion of bases in the DNA sequence of the mutant,inducing a lengthening or shortening of the repeat region of the SSR marker[34,35],suggesting that other mechanisms of EMS mutagenesis(aside from transition of G/C to A/T)are very important.The mechanisms of EMS mutagenesis should be further studied.
4.2.QTL location in two populations
The QTLs for mutational traits were detected using two populations.In the MY population,no QTL was found in the F2.In the MS population,QTLs for GW,FFD,and TGW were found in both the F2and F2:3,indicating that they were stable QTLs.Furthermore,QTLsfor GW,GLW,and TGW were detected in similar regions of chromosome 2D in the two populations,which in MY covered the marker wmc41 and in MS were near wmc41.This slight difference might be explained by the different genetic maps in the two populations.
QTL effects were negative for GW and TGW,but positive for GLWinthetwopopulations.ThisresultsuggeststhatM8008has mutations at loci that influence more than one trait for grain size.Gegas et al.[12]reported a stable QTL for GLW around marker wmc41 in the Beaver×Soissons population over two years.Furthermore,themarkerintervalcontainslinkedmarkers that we associated with GL and FFD in previous studies[7,8].
4.3.Grain-size-increasing effects of QTLs in smaller-grain-size parents
The additive effects of QTLs for GW and TGW were negative,indicating that the effects of the QTLs were increased by YN15 and SJZ54 alleles,although the phenotypes of GW and TGW in these parents were lower than that of M8008.Thus,we did not detect QTL for grain size increased by the alleles of the mutant M8008 on chromosome 2D.However,this finding is not at all accidental.In previous QTL analysis,increasing effects of QTLs have frequently been supplied by the lower-value parents.Breseghello and Sorrells[36]detected a major QTL for grain weight associated with SSR marker wmc18 on chromosome 2D.At this locus,although the parent AC Reed had larger seeds than the other parent,Grandin,the Grandin allele at wmc18 was associated with an increase of approximately 1.5 mg kernel-1(3-4%).In recombinant inbred lines from Chuan 35050×Shannong 483,TGW and GW were significantly greater in Shannong 483 than in Chuan 35050,but the increasing effects of QTLs for TGW and GW on chromosomes 1D,5D,and 6A were contributed by the small-grain-size parent,Chuan 35050[10].The mutant M8008 appears to carry alleles that promote the formation of large grain size and high TGW.Unfortunately,the major mutant alleles for grain size were notfoundonchromosome2D.Thus,itwill benecessary to scan the whole genome using the two populations or introgression lines with more markers for accurate identification major QTLs for TGW and grain-size traits in M8008,for better understanding of the genetic bases of these traits.
4.4.Correlated mutations of traits and their explanation at the QTL level
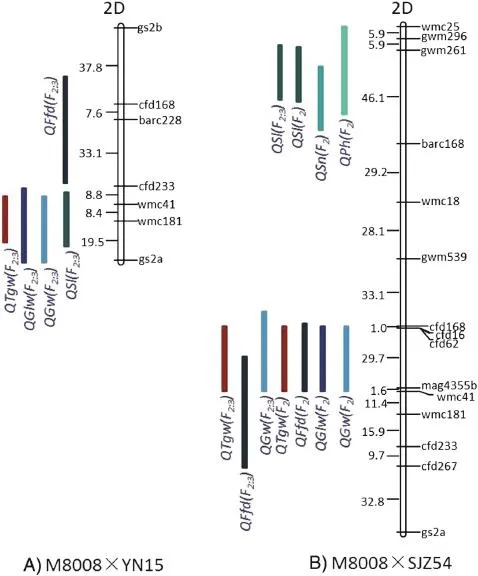
Fig.3-Locations of QTLs for grain size traits and yield traits based on the MY and MS populations.QTLs are indicated on the left side of each chromosome and markers are shown on the right.

Table 5-Additive effects of QTLs detected in MY and MS populations.
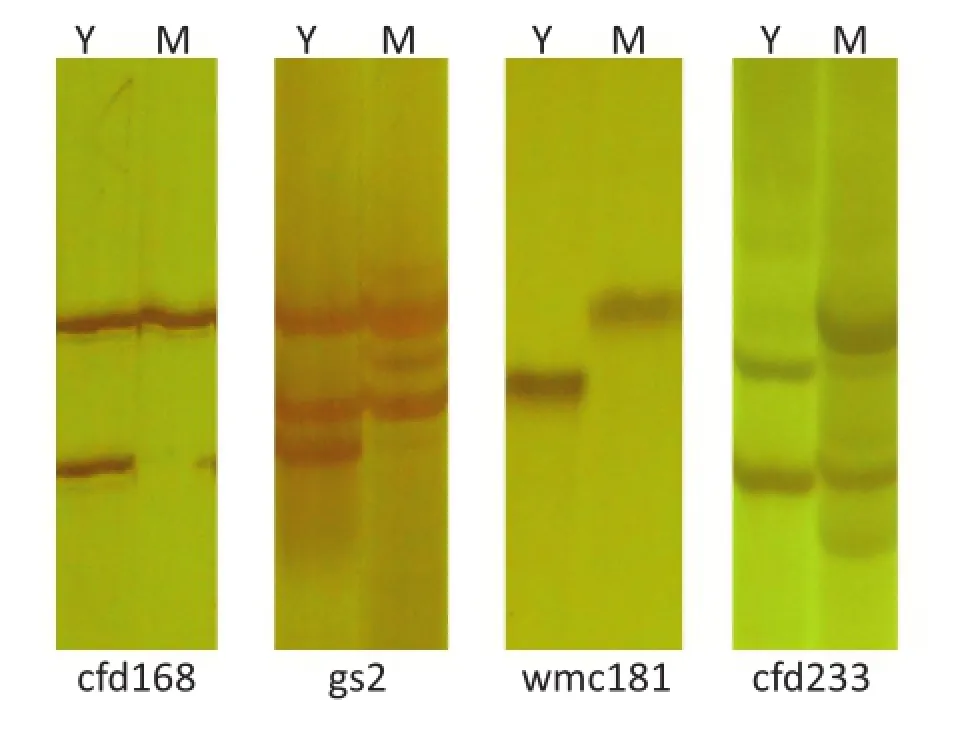
Fig.4-Polymorphic markers between M8008 and YN15.The markers cfd168 and gs2 are of type 1(presence or absence of fragments),whereas wmc181 and cfd233 are of type 2(different fragment lengths).Y represents YN15 and M represents M8008.
M8008 showed significantly increased PH,SL,GL,GLW,GW,and TGW and decreased FSS compared to YN15;and most of the correlations for tested trait pairs were significant, suggesting that correlated mutations occurred at the phenotypic level.Wu et al.[21]also reported correlated mutations in wheat,with the mutant Meh0239 showing more compact spikelet distribution,smaller and lighter grains,fewer grains per spike,slower seed germination,and higher sensitivities to glucose and ABA treatment than in the wild type.
In the present study,QTLs formed one cluster for MY and two clusters for the MS population on chromosome 2D,a finding that may partly explain the phenotype correlations between the mutations at the QTL level.The QTL clusters at or near wmc41 were associated mainly with grain-size traits(in MY,QSl,QGw,QGlw,andQTgw,andinMS,QGw,QGlw,QFfd,andQTgw),showing that this locus influences several traits at once.This mutated locus of M8008 led to decreases in GW,FFD,and TGW and increases in GLW and SL.The QTL cluster in the wmc25-barc168 intervalofMSwasassociatedwithyieldtraits(QPh,QSn,andQSl),indicating that this locus controls several traits simultaneously;in M8008,the locus leads to decreases in PH,SN,and SL.
Acknowledgment
This work was supported by the National Natural Science FoundationofChina(31271712),andtheNationalKey Technologies R&D Program of China(2013BAD01B02-8).
R E F E R E N C E S
[1]J.Dubcovsky,J.Dvorak,Genome plasticity a key factor in the success of polyploid wheat under domestication,Science 316(2007)1862-1866.
[2]S.Rajaram,Role of conventional plant breeding and biotechnology in future wheat production,Turk.J.Agric.For. 29(2005)105-111.
[3]T.A.Brown,M.K.Jones,W.Powell,R.G.Allaby,The complex origins of domesticated crops in the Fertile Crescent,Trends Ecol.Evol.24(2005)103-109.
[4]D.Q.Fuller,Contrasting patterns in crop domestication and domestication rates:recent archaeobotanical insights from the Old World,Ann.Bot.100(2007)903-924.
[5]A.D.Evers,R.I.Cox,M.Z.Shaheedullah,R.P.Withey,Predicting milling extraction rate by image analysis of wheat grains,Asp.Appl.Biol.25(1990)417-426.
[6]J.S.S.Ammiraju,B.B.Dholakia,D.K.Santra,H.Singh,M.D. Lagu,S.A.Tamhankar,H.S.Dhaliwal,V.S.Rao,V.S.Gupta,P.K.Ranjeka,Identification of inter simple sequence repeat(ISSR)markers associated with seed size in wheat,Theor. Appl.Genet.102(2001)726-732.
[7]K.G.Campbell,C.J.Bergman,D.G.Gualberto,J.A.Anderson,M.J.Giroux,G.Hareland,R.G.Fulcher,M.E.Sorrells,P.L. Finney,Quantitative trait loci associated with kernel traits in a soft×hard wheat cross,Crop Sci.39(1999)1184-1195.
[8]B.B.Dholakia,J.S.S.Ammiraju,H.Singh,M.D.Lagu,M.S. Röder,V.S.Rao,H.S.Dhaliwal,P.K.Ranjekar,V.S.Gupta,W.E. Weber,Molecular marker analysis of kernel size and shape in bread wheat,Plant Breed.122(2003)392-395.
[9]F.Breseghello,M.E.Sorrells,Association mapping of kernel size and milling quality in wheat(Triticum aestivum L.)cultivars,Genetics 172(2006)1165-1177.
[10]X.Y.Sun,K.Wu,Y.Zhao,F.M.Kong,G.Z.Han,H.M.Jiang,X.J. Huang,R.J.Li,H.G.Wang,S.S.Li,QTL analysis of kernel shape and weight using recombinant inbred lines in wheat,Euphytica 165(2009)615-624.
[11]L.Y.Zhang,D.C.Liu,X.L.Guo,W.L.Yang,J.Z.Sun,D.W.Wang,A.M.Zhang,Distribution in genome of quantitative trait loci(QTL)for yield and yield-related traits in common wheat(Triticum aestivum L.),J.Integr.Plant Biol.52(2010)996-1007.
[12]V.C.Gegas,A.Nazari,S.Griffiths,J.Simmonds,L.Fish,S. Orford,L.Sayers,J.H.Doonan,J.W.Snape,A genetic framework for grain size and shape variation in wheat,Plant Cell 22(2010)1046-1050.
[13]Y.Okamoto,A.T.Nguyen,M.Yoshioka,J.C.Iehisa,S.Takumi,Identification of quantitative trait loci controlling grain size and shape in the D genome of synthetic hexaploid wheat lines,Breed.Sci.63(2013)423-429.
[14]F.Cui,C.H.Zhao,A.M.Ding,J.Li,L.Wang,X.F.Li,Y.G.Bao,J.M.Li,H.G.Wang,Construction of an integrative linkage map and QTL mapping of grain yield-related traits using three related wheat RIL populations,Theor.Appl.Genet.127(2014)659-675.
[15]E.A.Greene,C.A.Codomo,N.E.Taylor,J.G.Henikoff,B.J.Till,S.H.Reynolds,L.C.Enns,C.Burtner,J.E.Johnson,A.R.Odden,Spectrum of chemically induced mutations from a large-scale reverse-genetic screen in Arabidopsis,Genetics 164(2003)731-740.
[16]J.H.Lee,S.Y.Lee,Selection of stable mutants from cultured rice anthers treated with ethyl methane sulfonic acid,Plant Cell Tissue Organ 71(2002)165-171.
[17]B.J.Till,S.H.Reynolds,C.Weil,N.Springer,C.Burtner,K. Young,E.Bowers,C.A.Codomo,L.C.Enns,A.R.Odden,Discovery of induced point mutations in maize genes by TILLING,Plant Biol.4(2004)12-19.
[18]D.G.Caldwell,N.McCallum,P.Shaw,G.J.Muehlbauer,D.F. Marshall,R.Waugh,A structured mutant population for forward and reverse genetics in barley(Hordeum vulgare L.),Plant J.40(2004)143-150.
[19]M.J.Ansari,R.Kumar,K.Singh,H.S.Dhaliwal,Characterization and molecular mapping of EMS-induced brittle culm mutants of diploid wheat Triticum monococcum L.Euphytica 186(2012)165-176.
[20]M.J.Ansari,A.Al-Ghamdi,R.Kumar,S.Usmani,Y.Al-Attal,A. Nuru,A.A.Mohamed,K.Singh,H.S.Dhaliwal,Characterization and gene mapping of a chlorophyll-deficient mutant clm1 of Triticum monococcum L,Biol.Plant.57(2013)442-448.
[21]K.Wu,J.Wang,Z.Kong,Z.Q.Ma,Characterization of a single recessive yield trait mutant with elevated endogenous ABAconcentration and deformed grains;spikelets and leaves,Plant Sci.180(2010)306-312.
[22]A.P.Derkx,S.Orford,S.Griffiths,M.J.Foulkes,M.J. Hawkesford,Identification of differentially senescing mutants of wheat and impacts on yield biomass and nitrogen partitioning,J.Integr.Plant Biol.54(2012)555-566.
[23]N.M.Adamski,E.Anastasiou,S.Eriksson,C.M.O'Neill,M. Lenhard,Local maternal control of seed size by KLUH/ CYP78A5-dependent growth signaling,Proc.Natl.Acad.Sci. U.S.A.106(2009)20115-20120.
[24]K.M.Gabrielson,J.D.Cancel,L.F.Morua,P.B.Larsen,Identification of dominant mutations that confer increased aluminium tolerance through mutagenesis of the Al-sensitive Arabidopsis mutant,als3-1,J.Exp.Bot.57(2006)943-951.
[25]A.Giura,N.N.Saulescu,Chromosomal location of genes controlling grain size in a large grained selection of wheat Triticum aestivum L.Euphytica 89(1996)77-80.
[26]P.J.Sharp,M.Kreis,P.R.Shewry,M.D.Gale,Location of β-amylase sequences in wheat and its relatives,Theor.Appl. Genet.75(1988)286-290.
[27]D.J.Somers,P.Isaac,K.Edwards,A high-density microsatellite consensus map for bread wheat(Triticum aestivum L.),Theor. Appl.Genet.109(2004)1105-1114.
[28]H.M.Chen,L.Z.Li,X.Y.Wei,S.S.Li,T.D.Lei,H.Z.Hu,H.G. Wang,X.S.Zhang,Development,chromosome location and genetic mapping of EST-SSR markers in wheat,Chin.Sci.Bull. 50(2005)2328-2336.
[29]Y.F.Hao,A.F.Liu,Y.H.Wang,D.S.Feng,J.R.Gao,X.F.Li,S.B. Liu,H.G.Wang,Pm23:a new allele of Pm4 located on chromosome 2AL in wheat,Theor.Appl.Genet.117(2008)1205-1212.
[30]E.S.Lander,P.Green,J.Abrahamson,A.Barlow,M.J.Daly,S.E. Lincoln,L.Newburg,MAPMAKER:an interactive computer package for constructing primary genetic linkage maps of experimental and natural populations,Genomics 1(1987)174-181.
[31]D.D.Kosambi,The estimation of map distances from recombination values,Ann.Eugen.12(1944)172-175.
[32]J.Yang,J.Zhu,R.W.Williams,Mapping the genetic architecture of complex traits in experimental populations,Bioinformatics 23(2007)1527-1536.
[33]Y.S.Kim,K.S.Schumaker,J.K.Zhu,EMS mutagenesis of Arabidopsis,Methods Mol.Biol.323(2006)101-103.
[34]W.Powell,M.Morgante,C.Andre,M.Hanafey,J.Vogel,S. Tingey,A.Rafalski,The comparison of RFLP,RAPD,AFLP and SSR(microsatellite)markers for germplasm analysis,Mol. Breed.2(1996)225-238.
[35]D.Tautz,M.Renz,Simple sequences are ubiquitous repetitive components of eukaryotic genomes,Nucleic Acids Res.12(1984)4127-4138.
[36]F.Breseghello,M.E.Sorrells,QTL analysis of kernel size and shape in two hexaploid wheat mapping populations,Field Crop Res.101(2007)172-179.
17 April 2014
in revised form
.Tel.:+86 538 8242903;fax:+86 538 8242226.
E-mail address:ssli@sdau.edu.cn(S.Li).
Peer review under responsibility of Crop Science Society of China and Institute of Crop Science,CAAS.
杂志排行
The Crop Journal的其它文章
- Effects of cultivation of OsrHSA transgenic rice on functional diversity of microbial communities in the soil rhizosphere
- An AFLP marker linked to the leaf rust resistance gene LrBi16 and test of allelism with Lr14a on chromosome arm 7BL
- Genetic variation for phytic acid content in mungbean(Vigna radiata L.Wilczek)
- Quantifying cardinal temperatures and thermal time required for germination of Silybum marianum seed
- Reduced grain chalkiness and its possible physiological mechanism in transgenic rice overexpressingL-GalLDH
- Bed planting of wheat(Triticum aestivum L.)improves nitrogen use efficiency and grain yield compared to flat planting
