Evaluating Vegetation Health Condition Using MODIS Data in the Three Gorges Area, China*
2015-07-31韩贵锋谢雨丝HANGuifengXIEYusiCAIZhi
韩贵锋 谢雨丝 蔡 智 HAN Guifeng, XIE Yusi, CAI Zhi
中图分类号 TU983
文献标识码 A
文 章 编 号 2095-6304(2015)02-0121-12
Evaluating Vegetation Health Condition Using MODIS Data in the Three Gorges Area, China*
韩贵锋 谢雨丝 蔡 智 HAN Guifeng, XIE Yusi, CAI Zhi
中图分类号TU983
文献标识码A
文 章 编 号2095-6304(2015)02-0121-12
The satellite-based vegetation condition index (VCI) and temperature condition index (TCI) have been used extensively for drought detection and tracking, the assessment of weather impacts on vegetation and evaluation of the health and productivity of vegetation. In this study, in order to detect and monitor the growth condition of vegetation, we have collected data on vegetation indices and land surface temperature derived from MODIS (2001-2012) and defined a vegetation health index (VHI) based on VCI and TCI for assessing vegetation health condition in the Three Gorges Area, China (TGA). The results of the study show that temporal and spatial characteristics of vegetation health condition can be detected, tracked and mapped by the VHI index. In most parts of the TGA, the vegetation health condition showed an overall increasing trend during the study period, especially in Wulong, Fengdu, Shizhu and other regions located in the midstream sections of the Three Gorges Reservoir. In addition, the four studied vegetation types all showed clear increasing trends during the study period. The increasing trend in the vegetation health condition shows a strong positive correlation with topographical slope and altitude (below 500 m). Over the seasons, this trend is strongest in autumn, followed by spring. However, the correlations between vegetation health condition and climatic factors are more frequently significant in summer and winter than in autumn and spring. The vegetation health condition has been low in 2006 and 2011. This finding is consistent with the extreme weather conditions in those two years. However, only in the summer is vegetation health condition significantly correlated with three climatic factors in most of the study area. This result implies that vegetation growth may show a lagged response to climatic factors and may also be affected by human activities, including agricultural activities, industrial activities and other economic activities.
Vegetation Health Condition; Vegetation Condition Index; Temperature Condition Index; Time Series Images; Three Gorges Area
1 Introduction
As the largest water conservation project in the world, the Three Gorges Project (TGP) has attracted worldwide attention. The TGP has produced significant benefits in electric power generation, flood control and shipping traffic; however, it will also have adverse impacts, e.g., on migration, environmental and cultural issues[1]. Positive impacts will be located primarily in the middle and lower reaches of the Yangtze, whereas negative impacts will be concentrated in the reservoir area. Although the TGP was successfully completed in 2009, the controversy still continues[2-4]. Vegetation, both natural and cultivated, plays an important role in the ecosystem security of the reservoir area due to important ecological functions such as water resource conservation and soil and fertility maintenance. Moreover, changes in vegetation are often viewed as the most overt evidence of biological response to climatic and other environmental factors. However, the extensive area of water and the resettlement of more than one million people resulting from the TGP may all have a direct impact on the growth dynamics and the geographic distribution of the vegetation. Accordingly, changes in vegetation cover and activity are well recognized as some of the most important indicators for regional environmental changes in the Three Gorges Reservoir area (TGA)[5]. At present, many studies of environmental issues surrounding the TGP have centered on biodiversity, water quality, fisheries, sediment flows in the river, reservoir-induced seismicity and geological instability, and social issues including population health risks, displacement and resettlement[6-10]. Han et al have found that vegetation activity has shown a clear upward trend since 1999 due to the benefits resulting from a number of environmental protections and ecological construction polices and projects[11]. However, the vegetation condition, net primary productivity (NPP), vegetation leaf area index (LAI) and fraction of photosynthetically active radiation (fPAR) are not well understood in the TGA[12]. In recent years, frequent and severe drought has been a disastrous feature of the climate throughout the TGA, especially in 2006 and 2011. What trends are occurring in the health of the vegetation in this area? To date, no in-depth research has been conducted on this question. It is well known that healthy vegetation is critical to the proper ecological functioning of the terrestrial environment. Kogan (1990) has proposed the concept of the Vegetation Condition Index (VCI)[13-15]; which not only permits the description of land cover and spatial and temporal vegetation change but also allows the quantification of the impact of weather on vegetation. He then has developed the Temperature Condition Index (TCI) using Advanced Very High Resolution Radiometer (AVHRR) thermal bands to determine the temperaturerelated vegetation stress and also stress caused by excessive wetness[14,16-18]. The VCI and TCI have been found dependent on the region and also on weather and ecological conditions[19]. Bhuiyan et al[20]have found that the correlation between the VCI and standardized precipitation index (SPI) increased during the monsoon season because vegetation health is entirely dependent on precipitation, whereas it is partly controlled by irrigation during the rest of the year[20-21]. Although station-based investigations can provide accurate point estimates of vegetation health conditions, their accuracy and level of spatial detail are a function of the density and distribution of the station network[22]. Satellite-based indices such as the Normalized Difference Vegetation Index (NDVI)-based VCI have proven to be a useful means of detecting vegetation health condition and measuring the intensity, duration and impact of drought in regions around the world[7,16-17,23-24].
The aim of this study is to evaluate vegetation health condition, detect its trends and analyze the potential relationship between vegetation health condition and climate change in the TGA from 2001 to 2012 using MODIS time series data. Our study focuses on the following three goals: to (1) evaluate vegetation health condition during the period, (2) detect trends and spatiotemporal differences in vegetation health condition and (3) reveal the potential relationships between vegetation health condition and climatic factors and causes of the changes in vegetation health condition.
2 Data and Method
2.1 Study Area
The TGA is situated in the lower section of the upper reaches of the Yangtze River, China, within E106°-115°50′, N29° 16′-31°25′, with an area of 58400km2and a population of almost 20 million (Fig. 1)[8]. It consists of 21 counties or cities of Chongqing municipality (including Jiangjin district, Banan district, Chongqing Major Area (CMA), Yubei district, Changshou district, Fuling district, Wulong county, Fengdu county, Zhongxian county, Shizhu county, Wanzhou district, Kaixian county, Yunyang county, Fengjie county, Wuxi county and Wushan county) and Hubei province (including Badong county, Xingshan county, Zigui county and Yichang city), with various geographic conditions: 74% of the region is mountainous, 4.3% is plains and 21.7% is hilly[25]. The long waterway extends approximately 660 km from the Three Gorges Project Dam to Chongqing municipality. The TGA has a humid subtropical monsoon climate with a mean annual temperature of 15~19℃, a mean annual precipitation of 1250 mm and an average relative humidity of 76%. The current land cover of the TGA is dominated by secondary vegetation and agricultural fields as a result of long-term human activity[9,26]. The forested areas are dominated by coniferous, deciduous broadleaved and subtropical evergreen broadleaved species[7].
2.2 Data
2.2.1 Data Source
The satellite data used in this study are the normalized difference vegetation index (NDVI), land surface temperatures (LST) and land cover type at 1 km spatial resolution derived from the Moderate Resolution Imaging Spectroradiometer (MODIS) sensors on board the Terra satellite. Three MODIS products (version 5) have been used: (1)8-day Land Surface Temperature & Emissivity (MOD11A2), (2) 16-day Vegetation Indices (MOD13A2), and (3)96-day Land Cover Type (MOD12Q1). These data (2001-2012) were downloaded from the LAADS Web (http://ladsweb. nascom.nasa.gov/index.html). The swath files are subsetted and regridded to a 1-km equi-rectangular grid with the MODIS Swath Reprojection Tool. The pixels on these grids potentially affected by significant cloud/snow/ice contamination are identified objectively using the quality control layer of pixel reliability in each product and are then removed. We have used a suite of land cover classifications with the primary classification scheme (IGBP) provided by MOD12Q1, including 11 natural vegetation classes, three human-altered classes, and three non-vegetated classes.
In addition, temperature and precipitation data from seven weather stations located in the TGA are obtained from the China Meteorological Data Sharing Service System (http://cdc.cma.gov. cn). Other auxiliary data include GDP and population is obtained from the Chongqing and Hubei Statistical Yearbooks (2001-2012).
2.2.2 Data Smoothing
To improve the quality of the time series data, we have used TIMESAT software (http://www.nateko.lu.se/timesat/ timesat.asp)[27-28], a useful tool to smooth and to gap-fill time series data, to smooth and reconstruct the NDVI and LST data. The program provides the following three different smoothing functions to fit the time series data: Asymmetric Gaussian, Double Logistic and Adaptive Savitzky-Golay (SG) filter. The SG filter has been used to smooth and reconstruct the time series data in this study. For NDVI data, two parameters are set in TIMESAT: adaptation strength is 2.0, and SG window size is 4. The weights are based on the pixel reliability layers associated with a given MODIS product. We have assigned high weights for higher quality retrievals and low weights for lower quality retrievals. The initial weights are assigned as follows: W=1 for NDVI retrievals from the high quality data (clear sky conditions), W=0.5 for mixed conditions and W=0 for outlier values or cloud/snow/ ice conditions. For LST data, the adaptation strength is 2.0, and the SG window size is 2. The initial weights are assigned based on the quality control (QA) layers, as for the NDVI data.
2.3 Methods
2.3.1 Vegetation health index
Many studies have effectively shown that the NDVI can be used for relatively accurate description of continental land cover, monitoring rainfall, drought detection and estimating primary production of vegetation and crop yields[17]. Over long periods, however, NDVI spatial variability is affected not only by the climate, soils, vegetation type and topography of an area but also by the water stress or drought conditions. Therefore, Kogan et al[18]have proposed the vegetation health index (VHI). The VHI is developed from the NDVI and the brightness temperature (BT) using the following processing algorithm: (1) removal of temporal high-frequency noise (e.g., clouds, sun and sensor angular effects) from annual time series; (2) calculation of climatology from many years of data; and (3) estimation of medium-to-low frequency fluctuations of NDVI and BT (departure from climatology) associated with weather variations. The final product includes three indices: NDVI-based Vegetation Condition Index (VCI), BT-based Temperature Condition Index (TCI) and Vegetation Health Index (VHI). Note that BT was calculated from AVHHR Ch4 (10.3–11.3 µm)[16]. Compared with BT, LST can better reflect the true thermal radiation condition of land surface objects and can be more easily obtained from MODIS products. Therefore, LST has been used to calculate TCI in this study. The resulting expression for VHI is

where NDVI, NDVImax and NDVImin (LST, LSTmax and LSTmin) are the smoothed 16-day NDVI (LST) and its 2001-2012 absolute maximum and minimum, respectively, and a is a coefficient quantifying the proportional contributions of VCI and TCI to the VHI. Because of spatio-temporal variations in factors such as vegetation type, climate, soils and topography, it is difficult to quantify the contributions of VCI and TCI to VHI. In general, the proportional contributions of VCI and TCI can be assumed to be equal (a=0.5) based on previous studies[29-32]. VCI and TCI primarily assess a particular year’s NDVI and LST dynamics relative to the range of their variation during extreme (stressed to favorable) conditions. The thresholds for the extreme conditions are derived by calculating maximum and minimum NDVI and LST values from 12-year satellite sensor data for each land pixel and each 16-day period. VCI, TCI and VHI characterize moisture, thermal and vegetation health conditions, respectively. The time interval for the NDVI is 16 days; however, the time interval for the LST is 8 days. Therefore, TCIs are calculated by LST time series data extracted for each 16-day period from the original dataset. VHIs are calculated every 16 days in each year from every 16-day VCI and TCI.
2.3.2 Detecting Trends in VHI
A slope test has been used to detect trends in VHI. For a pixel, a linear regression is fitted to the VHI as a function of the year of the time series. The regression slope can reveal trend in vegetation health. The F test is applied to every location (pixel)

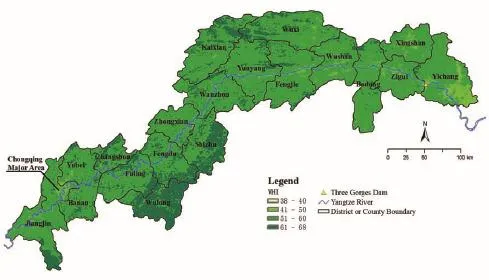
Fig.2 multi-year average VHI

Fig.3 slope of vegetation health trend in TGA

Tab.1 statistics of vegetation health trend
the mean value are considered to represent the overall trend[33]. The total area of the pixels with VHI trends with slopes between 0.0772 and 1.5803 is approximately 23626 km2(72.07%). These pixels represent a significant positive trend in the vegetation health condition in the TGA in the past 12 years. Vegetation health condition is increasing in areas with a relatively high average elevation of 931 m greater than the mean altitude (770m). The total area of pixels with slope values greater than mean+1std and less than mean+2std is approximately 7188km2(21.93%). The mean altitude of this area is 737m. The total area of pixels with slopes greater than mean+2std (approximately 2.3343) is only 786km2(2.4%). The mean altitude of these pixels ranges between 564m and 674m. The vegetation health condition shows the strongest downward trend in the area with the lowest altitude. As an important waterway for transportation, the Yangtze River makes a significant contribution to socio-economic development in the TGA. Since 2000, urbanization has been expanding rapidly along the river, and infrastructure and building are increasing in the relatively flat areas at low altitudes. Therefore, the vegetation health condition in such low-elevation areas would be affected by the increasingly intensive human activities and presents the most strongly decreasing trend.
In addition, the trend in the vegetation health condition increases as the slope of the land increases. If the slope of the land exceeds 19˚, the VHI shows an upward trend. We have divided the slopes that indicate the trend of change in the VHI into a total of 50 classes with equal intervals of 0.2. The mean topographical slope in each class is then calculated. For these 50 classes, the VHI slopes and the topographical slopes are significantly positively correlated (Fig. 4), with a Pearson correlation coefficient of 0.9629 (P<0.05). More rapid growth of the vegetation will be associated with better vegetation health conditions. In the TGA, steep slopes are difficult to develop as urban areas or crop fields. These slopes represent a perfect environment for the growth of the vegetation and suffer less impact from human activities.
Relationships between the VHI trends and temperature and precipitation trends during the analysis period have been analyzed based on circles with a radius of 3 km surrounding the meteorological stations. First, the mean VHI is calculated for each of these 3-km circles. The scatter diagram showing the mean VHI as a function of the year is shown in Fig. 5. The VHIs show significant overall upward trends at four weather stations: Fengjie, Badong, Yichang and Sanxia (Tab. 2). The overall trends are not pronounced at the Wanxian and Fuling stations, where rapid urbanization has occurred. The VHI even shows a slight downtrend at the Shapingba station as a result of its location in the old downtown area and rapid urban expansion in recent years. In addition, the VHIs are low at almost all stations in 2006. This finding is clearly a result of the drought that occurrs in southwestern China during this year. Similarly, Chongqing city suffers approximately two weeks of hot weather in the summer of 2011, resulting in low VHIs at the Shapingba, Fuling and Wanxian stations.

Fig.4 scatter diagram between the VHI trend slope and Topographya: between VHI Trend Slope and Topographical Elevation; b: between VHI Trend Slope and Topographical Slope
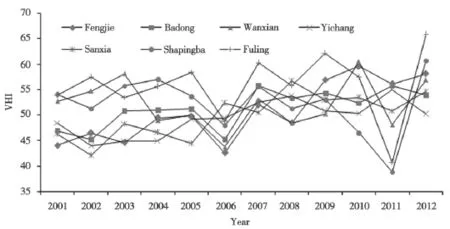
Fig.5 mean VHI in each 3-km radius area around each meteorological station during the period
Although the growth of vegetation is affected by climate and site conditions, the relationships between VHI and temperature, precipitation and sunshine duration are not significant at most stations (Tab. 2). The correlations between the annual mean VHI and the annual mean temperature are negative but are significant at only three stations: Sanxia, Badong and Fuling. Similarly, the correlations between annual mean VHI and annual total precipitation are generally positive but are significant only at Fuling station. Sunshine is also an important feature of climate that impacts vegetation growth. The correlations between annual mean VHI and annual sunshine duration are largely negative only at Badong and Shapingba stations.
In general, the relationships between VHI and the three studied climate features are not significant, although vegetation growth is evidently affected by these features. Moreover, we have calculated a multiple linear regression between VHI as a dependent variable and the three climatic factors as independent variables. The results indicate that the regression coefficients are not significant at all seven stations. In fact, the VCI responds relatively slowly[21]. The lagged response of the VCI to weather conditions most likely produces a lagged response of the VHI to weather conditions. The regression analysis of the annual VHI and annual mean temperature, total precipitation and sunshine duration could not describe these relationships.
3.3 Trends in seasonal VHI
To analyze the intra-annual variability of VHI, seasonal mean VHIs have been extracted for each spring (March to May), summer (June to August), autumn (September to November) and winter (December to next February) in every year[34]. Each seasonal trend of VHI during this period is detected by a slope test. The slope of the regression equation with an F value exceeding the critical value (a=0.1) is considered to indicate a significant trend. Fig. 6 shows the four seasonal VHI trends from 2001 to 2012. The VHI trends show obvious differences among the seasons. Overall, most of the significant slopes indicate a positive (upward) trend, whereas most of the negative trends are non-significant. In terms of the mean slope, VHI shows the strongest positive (upward) trend in the autumn, the next strongest in the spring and summer and the least strong in the winter. The standard deviations (stds) indicate that the VHI trends in winter are highly variable and that the next most variable VHI trends occurr in summer. However, the VHI trends in autumn display relatively small variation over the area of the TGA. These results imply that the trends in vegetation growth are consistently better in terms of spatial distribution in autumn during this period as well as in spring.

Tab.2 VHI trend and its correlation with four climatic factors in seven stations
During this period, vegetation growth reveals significant trends in spring only in 26.84% of the total TGA. Among these pixels, approximately 95.27% show significant positive trends, whereas approximately 4.73% display significant negative trends. The percentage of the pixels with slope values within the range of the mean±1std was approximately 88.87%. This finding indicates that most of the pixels show an upward trend. The values of these trends range from 0.674 to 2.537. In terms of its spatial distribution, the vegetation health condition in spring appear to show increasing trends, especially in downstream areas such as Kaixian, Wuxi, Fengjie, Wushan, Badong and Zigui. Additionally, in parts of Shizhu, Yubei and Jiangjin, vegetation growth also shows significant increasing trends in spring. Because such areas are often located in mountainous or hilly terrain (Fig. 1) far away from urbanized areas, vegetation, including deciduous forests and crops, begins to grow during the spring, and the vegetation health condition shows an increasing trend during this period. In contrast, the vegetation health condition appears to show a significant decreasing trend in urbanized areas along the Yangtze River such as the Chongqing Major Area, Fuling, Yunyang and Yichang.
In summer, vegetation growth displays significant trends only in 17.17% of the total TGA. In this part of the TGA, approximately 90.23% of the pixels show significant positive trends, whereas approximately 9.77% of the pixels show significant negative trends. Approximately 84.97% of the pixels show slope values within a range of the mean±1std. This finding shows that most of the pixels display an upward trend. The values of this trend range from 0.189 to 2.986. In terms of their spatial distribution, VHI trends in summer are similar to those in spring. However, the area with a significant slope in summer is less than the area with a significant slope in spring. In particular, the vegetation health condition no longer presents a significant trend in summer in parts of Jiangjin, Yubei, Shizhu, Kaixian, Wuxi and Badong. This difference may be a result of two factors. First, these areas have been suffered from heat and a lack of rain. Moreover, crops, e.g., wheat and rape, are harvested in the first half of summer. An increasing trend only shows in mountainous areas, apparently due to the growth of forests.
In autumn, vegetation health condition shows the most favorable increasing trend of all four seasons. The vegetation growth indicates significant trends over 57.63% of the total TGA. For this area, 99.39% of the pixels show positive slope values (upward trends), whereas only 0.61% of the pixels in this area show negative (downward) trends. Approximately 71.81% of the slopes have ranged within the mean±1std. This finding shows that most of the pixels showed an upward trend. These trends have ranged from 1.685 to 3.328. In terms of the spatial distribution, positive trends are clearly widespread in most districts or counties except for CMA, Banan, Fuling, and northern Jiangjin based on the values found in spring. Note that pixels in northeastern Kaixian and western Wuxi display weaker positive trends in autumn than in spring. One possible reason for this finding is that the growth season of the vegetation has been ending at high elevations (i.e., elevations greater than 1800m). Overall, the vegetation health condition appears to indicate the best upward trend in autumn during this period, both in terms of increased degree and in terms of the area of spatial distribution.
In winter, vegetation health condition present the weakest trend observed for the four seasons. The pixels with significant trends have represented only 7.79% of the total TGA. Approximately 56.89% of such pixels have shown significant positive trends, whereas approximately 42.65% of such pixels have revealed significant negative trends. Most pixels display no significant trends. Although vegetation becomes dormant in winter, the vegetation health condition still shows a significant upward trend in certain areas, such as parts of Fengdu, Shizhu, Jiangjiang and Badong, because of the presence of evergreen shrubs and forests.
The mean VHI and three climatic factors (total precipitation, mean temperature and total sunshine duration) have been calculated for each season during the 12 studied years. We have calculated Pearson correlation coefficients between the seasonal mean VHI and climatic factors, as shown in Tab. 3.

Tab.3 person’s correlation coefficients between VHI and four climatic factors in seasons

Fig.6 trend of mean VHI of each season during the period
Generally, the strongest correlations between VHI and climatic factors occur in summer, and are followed by winter. In most cases, positive correlations are found between seasonal mean VHI and total precipitation, and negative correlations have been found between seasonal mean VHI and seasonal mean temperature and total sunshine duration.
笔者以为要大力倡导以书法为载体的休闲活动,对参与其中的个体来讲,它不仅具有陶冶性情,提高审美水平的作用,而且对于整个社会来讲,更有较大的功能和意义。
At most weather stations, the correlations between VHI and climatic factors are not significant in spring and autumn. In summer, the correlations between VHI and climatic factors are all significant at four weather stations: Badong, Sanxia, Shapingba and Fuling. The VHI has been significantly correlated with seasonal mean temperature and total sunshine duration at all seven weather stations. In summer, therefore, we can state that high temperatures and sunshine would decrease the vegetation health condition, whereas abundant precipitation would improve the vegetation health condition. For example, high temperature and sunshine duration and lack of rain caused droughts in the summers of 2006 and 2011. Much of the vegetation, including crops, has died as a result of the drought.
The correlation coefficients are all significant in summer and winter only at Shapingba station. At the other stations, most correlation coefficients are significant only in summer.
The correlations between vegetation health condition and climatic factors vary in different seasons and places. However, Fig. 6 shows the interesting result that the correlation coefficients are significant in summer and winter, when the VHI trends are relatively weaker than in other seasons. In contrast, the VHIs show the most significant trends in autumn and spring, but most correlation coefficients are not significant. Similarly, although Shapingba station is near the urbanized area, the correlation coefficients at this station are significant in summer and winter. In contrast, most correlation coefficients are not significant at Badong, Fengjie and Yichang stations despite the significant upward trends of VHI at these stations.
3.4 VHI trends for vegetation types
The land cover type in one pixel may change over 12 years. In this study, the land cover maps for 12 years are combined into one raster map in which every pixel has a trajectory of changes in land cover type during the study period. In all, 26454 trajectories have been shown on the combined raster map. The pixels in which the type of vegetation has not changed during the study period have been selected for further analysis. Four vegetation types have been selected for this purpose: mixed forest (10275km2), woody savannas (477 km2), croplands (1887km2) and cropland/ natural vegetation mosaic (61km2). Other trajectories showing no change in vegetation type have represented small areas and are not considered.

Fig.7 annual mean VHI of each vegetation in each year during the period
The annual mean VHIs of each vegetation type in each year are shown in Fig. 7. Overall, the VHIs for the four vegetation types range from 45 to 65, and all present increasing trends. Mixed forest and woody savannas, two important vegetation types with the greatest area, always show more stable trends than the two other vegetation types. However, two troughs have occurred, one in 2006 and the other in 2011. These changes in the trends are consistent with the mean VHI in each 3-km (radius) circle around each meteorological station during the period (Fig. 5). The TGA has suffered severe droughts in 2006 and 2011 that may have produced low VHI values. However, we also found that mixed forest and woody savannas have been primarily distributed in mountainous areas (Fig. 2) and consist of natural vegetation and seminatural vegetation with little impact from urbanization and human activity. However, the growth of vegetation in croplands and in cropland/natural vegetation mosaics is usually controlled by human activity, such as seeding, harvest and irrigation. As a result, these two vegetation types are less resilient to variations in growing conditions than other natural and seminatural vegetation, and the trends identified for these vegetation types show obvious fluctuations when droughts or outbreaks of diseases and insect pests ravage crops. During droughts, croplands and cropland/ natural vegetation mosaic often show a low health condition.
We have extracted the mean VHI of each vegetation type based on every 16-day VHI during the past 12 years, as shown below (Fig. 8). Although the VHIs have fluctuated over the seasons in every year, the VHIs show a more or less increasing trend as a whole. Among these results, the woody savannas appear to show the most significant upward trend of the four vegetation types (Fig 8b.). Mixed forest also shows an upward trend. Lastly, croplands and cropland/natural vegetation mosaic, which represents a relatively small area within the four vegetation types, shows similar weak upward trends. In general, the trends for the four vegetation types are consistent with the trends detected with the slope test.
Additionally, we have calculated the seasonal trend for each vegetation type during the period. The resulting trends were similar to the annual trends (Fig. 7) with two obvious troughs in 2006 and 2011. The seasonal trends for each vegetation type have been accompanied by fluctuations, but all show more or less increasing trends as a whole. As in Fig. 8, however, only slight upward seasonal trends were found for croplands and cropland/natural vegetation mosaic. In contrast, mixed forest and woody savannas showed relatively marked increasing trends.
4 Conclusions
During this period, however, the vegetation health condition shows a significant increasing trend in most of the TGA (54.11% of the total area), especially in Wulong, Fengdu, Shizhu and areas downstream from Wanzhou. In contrast, the area showing a significant decreasing trend has been only approximately 2.03% of the total area and has been located in or near urbanized areas such as Chongqing Major Area, Changshou, Fuling and Yichang. A striking result is that the increasing trends in the vegetation health condition have been strongly positively correlated with topographical slope and altitude (below 500 m). This result implies that human activities, including agricultural activities, industrial activities and other economic activity, have a great influence on vegetation health condition because the steep land is difficult to develop as urban areas or crop fields. The significant overall upward trends of the VHIs at four weather stations far away from the urbanized area, Fengjie, Badong, Yichang and Sanxia, also support this implication. In addition, four vegetation types all have shown obvious increasing trends during the study period. The increasing trend shown by the vegetation health condition may indicate a beneficial effect resulting from a number of environmental protection and ecological construction policies and projects that have been conducted in recent years, such as the Grain for Green Project (2000-2008) and Greenbelt around the Three Gorges Reservoir Construction Project Planning (2004-2008). Through implementation of the Grain for Green Project in the reservoir region, the forest coverage rate in the reservoir area has increased from 21.9% in 1997 to 34.5% in 2008[8], and the ecological functions of vegetation have been rehabilitated and have improved considerably.

Fig.8 VHI trends of four vegetation types during the period
Note that the increasing trend shown by the vegetation health condition is the strongest in autumn among the four seasons and the next strongest in spring. However, the correlations between vegetation health condition and climatic factors are more significant in summer and winter than in autumn and spring. One possible reason is that crops such as winter wheat grow in spring and ripen and are harvested in autumn. Such agricultural activity impacts the vegetation signal acquired by the sensor on board the satellite and results in changes in the TCI and VCI. Moreover, mixed forest and woody savannas presents more stable and marked increasing trends than the other two vegetation types. The VHI trends of the former two vegetation types can better reflect changes in the health condition of natural and semi-natural vegetation because the influence of agricultural and industrial activities is relatively slight.
Although the vegetation health condition has increased during the study period, prolonged droughts in summer in 2006 and 2011 result in a poor vegetation health condition because of high temperatures and a lack of precipitation in the TGA. It is well known that vegetation growth is affected by climate and site conditions. Only in summer, however, was vegetation health condition significantly correlated with climatic factors in most of the area. No generally significant relationships appear to occur between VHI and three climate features, i.e., temperature, precipitation and sunshine duration. This finding may be a result of three factors. First, the vegetation has been growing during the summer, the season of the year when growth is most active. The vegetation signal can easily be acquired by the sensor on board the satellite in the presence of favorable weather conditions during the summer. Second, vegetation growth often shows a lagged response to climatic factors. Moreover, the time lags differ depending on the vegetation types (including plant species, community and ecosystem types) and site conditions (altitude, slope, soil types and soil fertility). In the TGA, the vegetation composition, diversity, functional group and productivity all differ. Additionally, conditions vary markedly in association with variation in the mountain and river landscapes. Therefore, the lagged response of vegetation growth to climatic factors becomes highly complex. The detailed properties of this response will be examined in future research by conducting long-term field experiments on a small scale. Third, the influence of human activity on vegetation growth could not be ignored. Although more than 1.3 million people have migrated from TGA to other regions, the current population density is approximately 328 persons per square kilometer, approximately
2.5 times the national average. Substantial areas of land are used to grow crops for food production. Moreover, the urban has rapidly expanded following the designation of Chongqing as a municipality city. Intense exploitative activities and urbanization in both urban and rural areas may change the original water cycle both in the soil and the air, the soil structure and the organic matter content of the soil. The landscape and the structure of vegetation are changed due to the increasing introduction of exotic tree species. In addition, pollutants in the atmosphere, water bodies and soil directly damage the structures of stems, roots and leaves and thus reduce photosynthesis by the vegetation in urban areas. Consequently, many factors mentioned above could all affect the correlations between vegetation health condition and climatic factors.
Acknowledgments
The study has been supported by the Natural Science Foundation Project of CQ CSTC (Grant No. CSTC2011jjA00025). The authors thank Dr. Z. W. Sun for his constructive comments and suggestions on this paper.
[1] Dai H C, Zheng T G, Liu D F, et al. Effects of reservoir impounding on key ecological factors in the Three Gorges region[J]. Procedia Environmental Sciences, 2010(02): 15-24.
[2] Wu J G, Huang J H, Han X G, et al. Three-Gorges Dam-experiment in habitat fragmentation? [J]. Science, 2003(300): 1239-1240.
[3] Stone R. Three Gorges Dam: into the unknown[J]. Science, 2008(321): 628-632.
[4] Tullos D. Assessing the influence of environmental impact assessments on science and policy: An analysis of the Three Gorges Project[J]. Journal of Environmental Management, 2009, 90 (SI): S208-S223.
[5] Lindquist E J, Hansen M C, Roy D P, et al. The suitability of decadal image data sets for mapping tropical forest cover change in the Democratic Republic of Congo: Implications for the global land survey[J]. International Journal of Remote Sensing, 2008, 29(24): 7269-7275.
[6] Jabbar M T, Shi Z H, Wang T W, et al. Vegetation change prediction with geoinformation techniques in the Three Gorges Area of China[J]. Pedosphere, 2006, 16 (04): 457-467.
[7] Zeng Y, Schaepman M E, Wu B, et al. Scaling-based forest structural change detection using an inverted geometricoptical model in the Three Gorges region of China[J]. Remote Sensing of Environment, 2008, 112(12): 4261-4271.
[8] Zhang J X, Liu Z J, Sun X X. Changing landscape in the Three Gorges Reservoir Area of Yangtze River from 1977 to 2005: Land use/land cover, vegetation cover changes estimated using multisource satellite data[J]. International Journal of Applied Earth Observation and Geoinformation, 2009, 11 (06): 403-412.
[9] Su X L, Zeng B, Huang W J, Xu S J, et al. Effects of the Three Gorges Dam on preupland and preriparian drawdown zones vegetation in the upper watershed of the Yangtze River, P.R. China[J]. Ecological Engineering, 2012(44): 123-127.
[10] Yang F, Liu W W, Wang J, et al. Riparian vegetation’s responses to the new hydrological regimes from the Three Gorges Project: Clues to revegetation in reservoir water-levelfluctuation zone[J]. Acta Ecologica Sinica, 2012(32): 89-98.
[11] Han G F, Yang Y C, Yan S Y, et al. Vegetation activity trend and its relationship with climate change in the Three Gorges Area, China[J]. Advances in Meteorology, 2013. http://dx.doi. org/10.1155/2013/235378
[12] Xu X B, Tan Y, Yang G S, et al. Impacts of China's Three Gorges Dam Project on net primary productivity in the reservoir area[J]. Science of the Total Environment, 2011, 409(22): 4656-4662.
[13] Kogan F N. Remote sensing of weather impacts on vegetation in nonhomogenous areas[J]. International Journal of Remote Sensing, 1990(11): 1405-1419.
[14] Liu W, Kogan F N. Monitoring regional drought using the vegetation condition index. International Journal of Remote Sensing, 1996, 17(14): 2761-2782.
[15] Gitelson A A, Kogan F N, Zakarin E, et al. Using AVHRR data for quantitative estimation of vegetation conditions: Calibration and validation. Advances in Space Research, 1998, 22(05): 613-676.
[16] Kogan F N. Application of vegetation index and brightness temperature for drought detection[J]. Advances in Space Research, 1995(15): 91-100.
[17] Unganai L S, Kogan F N. Drought monitoring and corn yield estimation in Southern Africa from AVHRR data[J]. Remote Sensing of Environment, 1998, 63(03): 219-232.
[18] Kogan F N, Stark R, Gitelson A, et al. Derivation of pasture biomass in Mongolia from AVHRR-based vegetation health indices[J]. International Journal of Remote Sensing, 2004, 25(14): 2889-2996.
[19] Singh R P, Roy S, Kogan F N. Vegetation and temperature condition indices from NOAA/AVHRR data for drought monitoring over India[J]. International Journal of Remote Sensing, 2003, 24(22): 4393-4402.
[20] Bhuiyan C, Singh R P, Kogan F N. Monitoring drought dynamics in the Aravalli region (India) using different indices based on ground and remote sensing data[J]. International Journal of Applied Earth Observation and Geoinformation, 2006(08): 289-302.
[21] Quiring S M, Ganesh S. Evaluating the utility of the Vegetation Condition Index (VCI) for monitoring meteorological drought in Texas[J]. Agricultural and Forest Meteorology, 2010, 150(03): 330-339.
[22] Brown J F, Wardlow B D, Tadesse T, et al. The Vegetation Drought Response Index (VegDRI): A new integrated approach for monitoring drought stress in vegetation[J]. GIScience & Remote Sensing, 2008, 45(01): 16-46.
[23] Anyamba A, Tucker C J, Eastman J R. NDVI anomaly patterns over Africa during the 1997/98 ENSO warm event[J]. International Journal of Remote Sensing, 2001, 22(10): 1847-1859.
[24] Ji L, Peters A J. Assessing vegetation response to drought in the northern Great Plains using vegetation and drought indices[J]. Remote Sensing of Environment, 2003, 87(01): 85-89.
[25] Peng T, Xu G, Xia D Q. Trend of geological hazards and countermeasure of disaster[J]. Journal of Mountain Science, 2004, 22(06): 719-724.
[26] Wu J G, Huang J H, Han X G, et al. The Three Gorges Dam: An ecological perspective[J]. Frontiers in Ecology and the Environment, 2004, 2(05): 241-248.
[27] Jonsson P, Eklundh L. Seasonality extraction and noise removal by function ftting to time-series of satellite sensor data[J]. IEEE Transactions of Geoscience and Remote Sensing, 2002(40): 1824-1832.
[28] Jonsson P, Eklundh L. TIMESAT-A program for analyzing time-series of satellite sensor data[J]. Computers & Geosciences, 2004, 30(08): 833-845.
[29] Kogan F N. Operational space technology for global vegetation assessment[J]. Bulletin of the American Meteorological Society, 2001, 82(09): 1949-1964.
[30] Kogan F N. World droughts in the new millennium from AVHRR-based vegetation health indices[J]. Eos, Transactions, American Geophysical Union, 2002, 83(48): 557-564.
[31] Kogan F N, Gitelson A, Zakarin E, et al. AVHRR-based spectral vegetation indices for quantitative assessment of vegetation state and productivity: Calibration and validation[J]. Photogrammetric Engineering and Remote Sensing, 2003, 69(08): 899-906.
[32] Mu L L. Suitability and uncertainty analysis of agricultural drought indicator with remote sensing[D], Beijing: Institute of Remote Sensing Applications, Chinese Academy of Sciences, 2006.
[33] Budde M E, Tappan G, Rowland J, et al. Assessing land cover performance in Senegal, West Africa using 1-km integrated NDVI and local variance analysis[J]. Journal of Arid Environments, 2004(59): 481-498.
[34] Lin D S, Wu C G, Zhou Z X, et al. Trends of air temperature variations in Three Gorges reservoir area from 1960 to 2006[J]. Resources and Environment in the Yangtze Basin, 2010, 19(09): 1037-1043.
图片来源:
图1-8:作者绘制
(编辑:卢一欣)
2014-02-28
10.13791/j.cnki.hsfwest.20150223
韩贵锋, 谢雨丝, 蔡智. Evaluating vegetation health condition using MODIS data in the Three Gorges Area, China[J]. 西部人居环境学刊, 2015, 30(02): 121-132.* Natural Science Foundation Project of CQ CSTC (CSTC2011jjA00025)
Author Information:
Han Guifeng: Associate Professor, Key Laboratory of New Technology for Construction of Cities in Mountain Area of Education Ministry, College of Architecture and Urban Planning, Chongqing University, hangf@cqu. edu.cn
XIE Yusi: Postgraduate, College of Architecture and Urban Planning, Chongqing University
CAI Zhi: Postgraduate, College of Architecture and Urban Planning, Chongqing University
