Effects of Fe2+, Co2+and Ni2+Ions on Biological Methane Production from Residual Heavy Oil
2015-06-22
(College of Chemical Engineering, China University of Petroleum, Qingdao 266555)
Effects of Fe2+, Co2+and Ni2+Ions on Biological Methane Production from Residual Heavy Oil
Liu Chunshuang; Ma Wenjuan; Zhao Dongfeng; Jia Kuili; Zhao Chaocheng
(College of Chemical Engineering, China University of Petroleum, Qingdao 266555)
On the basis of single factor tests, the effect of trace elements—Fe2+, Co2+and Ni2+ions—on biological methane production from heavy oil was investigated by the response surface method. A three-level Box-Behnken design was employed to study the relationship between the independent variables and the dependent variable by applying initial Fe2+, Co2+and Ni2+concentration as the independent variables (factors) and using the methane production after 270 days of cultivation as the dependent variable (response). A prediction model of quadramatic polynomial regression equation was obtained. The results showed that the methane production could be as high as 240.69 µmol after optimization compared with 235.74 µmol obtained under un-optimized condition. Furthermore, the microbial communities before and after biodegradation were analyzed by PCR-DGGE method. The dominant bands were recovered and sequenced. Three strains were obtained; the strain T1 has 97% similarity with Bacillus thermoamylovorans, the strain H3 has 97% similarity with Bacillus thermoamylovorans and the strain H4 has 99% similarity with Bacillus vietnamensis.
residual heavy oil; methane; PCR-DGGE; response surface method
1 Introduction
Greatly enhancing oil recovery rate and extending the life of the reservoir development have been the basic focus and the difficulty of petroleum industry[1]. Microbial conversion of residual oil to methane is a new technology to extend the life of the oil reservoir, which converts heavy residual oil to methane by bacteria under the anaerobic condition. Then the residual oil can be exploited in the form of methane or be reserved underground as a kind of strategic resources[2]. The process of methane production from petroleum hydrocarbons is feasible in theory and has been confirmed under the laboratory conditions[3-8].However, the rate is very low. Usually it takes several months for bacteria to convert petroleum hydrocarbons into methane.
The microbial metabolism is usually influenced by trace elements, because trace elements play an important role in the microbial enzyme system[9-11]. In this study, the effect of elements—Fe2+, Co2+and Ni2+—on methane production from residual heavy oil was investigated for the first time. Then the microbial communities before and after biodegradation were analyzed by PCR-DGGE.
2 Materials and Methods
2.1 Tests
In the single factor tests, 1 ml of produced water obtained from the Shengli Oilfield was fed into each of the serum bottles filled with 89 mL of sterilized medium which had the following composition: 1.0 g/L of KCl, 1.0 g/L of NaCl, 1.0 g/L of NH4Cl, 0.42 g/L of K2HPO4·3H2O, 0.3 g/L of KH2PO4, 0.6 g/L of MgCl2·6H2O, 0.12 g/L of CaCl2·2H2O, and 0.5 g/L of L-cysteine. One gram of heavy oil was added into the medium as carbon resources. Ten milliliter of vitamin solution was added for each liter of fed medium with the following composition: 2.0 mg/L of biotin, 2.0 mg/L of folate, 10.0 mg/L of pyridoxine hydrochloride, 5.0 mg/L of thiamine, 5.0 mg/L of riboflavin, 0.1 mg/L of vitamin B12, 5.0 mg/L of PABA and 5.0 mg/L of lipoic acid. The pH of the suspension was maintained at 7.5 by adding 5 mL of 1 M HCl.The concentration of trace elements—Fe2+, Co2+and Ni2+—was added as required (Table 1). The trace element-free control was pre-pared with 100 ml of sterilized medium. All serum bottles were purged by nitrogen gas to produce the required anaerobic conditions, were wrapped with aluminum foil to prevent possible effects of light, closed using a butyl rubber septum, and sealed with a metal cap. The seeded bottles were incubated at 55 ℃ for 270 days on a shaker vibrating at a rate of 130 rpm.Based on the single factor tests, the response surface methodology was used to determine the optimum trace element conditions of methane production from heave oil. The Box-Behnken design employed thereby had three independent variables, viz.: the concentration of Fe2+(A), Co2+(B) and Ni2+(C) ions. Each of the independent variables was studied at three levels (-1, 0, +1), with 17 experiments and one control. The methane production was chosen as the control variable. Coded and actual values of variables used in the study are presented in Table 2 and the experimental matrix for Box-Behnken design suitable for general optimization is presented in Table 3. The second-order polynomial coefficients were calculated and analyzed using the ‘Design Expert” software (Version 7.1.4.0, Stat-Ease Inc., Minneapolis, USA) statistical package. Statistical analysis of the model was performed to evaluate the analysis of variance (ANOVA).

Table 1 The concentration of trace elements for single factor tests

Table 2 Coded and actual values of variables used in the response surface study

Table 3 Experimental matrix and results for Box-Behnken design
2.2 DNA extraction, PCR, DGGE, and sequence analysis
The DNA of microorganisms in the samples was extracted using a bacteria DNA extraction mini kit (Watson Biotechnologies Co. Ltd., Shanghai, China) according to the manufacturer’s instructions. DNA extracts were used as the template for PCR amplification of the 16S rDNA. The 16S rDNA was amplified, both with a pair of universal primers (BSF101F-TGGCGGACGGGTGAGAA, and BSF534R-ATTACCGCGGCTGCTGG), and GC-clamp- CGCCCGCCGCGCGCGGCGGGGCGGGGGCACGGGGGG (Invitrogen, Co., Ltd., Shanghai, China) as described by Watanabe, et al12]. The reaction mixture (50 µL) contained 10×PCR buffer, 10 mmol/L of tri/HCl, 0.2 mmol/L of dNTP, 2.5 U of Tap DNA polymerase, 0.5 µmol/L of forward primer and 0.5 µmol/L of reverse primer, and 0.4 mg/L of template DNA. The samples were amplified using an 9700PCR meter (Bio-Rad Laboratories, Hercules, USA) with the following thermal profile: 95 ℃ for 4 min; 35 cycles of 40 s at 95 ℃, 40 s at 55 ℃, and 1 min at 72 ℃ with a 0.1 ℃ decrease in annealing temperature per cycle until the temperature reduced to 55 ℃. The DGGE test was performed using a DCode universal mutation detection system (Bio-Rad Laboratories, Hercules, USA) with a denaturing gradient ranging from 30% to 60%. The 100% denaturing agent corresponds to a mixture composed of a 7 M urea solution containing 40 % (v/v) of deionized formamide. Electrophoresis was run for 30 min at 20 V and for 11 h at 60 V at 60 ℃. The obtained gels were silver-stained[12]. Prominent DGGE bands were selected and used for excision. The re-amplified products were puri fied by the Gel Recovery Puri fication Kit (Watson Biotechnologies Inc., Shanghai, China) and cloned by the pMD19-T plasmid vector system (Takara Company, Dalian, China) according to the manufacturer’s instructions. The DNA sequences were determined with the chain-termination method on an ABI 3730 DNA sequencer by a commercial service (Sangon, China). All sequences were aligned in the GenBank database using the BLASTN program.
2.3 Chemical analysis
Methane was determined by a gas chromatograph (GC-3800, Varian) equipped with a FID detector and Al2O3column (50 m×0.53 mm×20 μm). The column temperature was increased from the initial value of 40 ℃ to 100 ℃ within 2 min, and then increased to 170 ℃ at a rate of 10 ℃/min. The inlet temperature was 100 ℃. The carrier gas was the high-purity helium.
3 Results and Discussion
3.1 Effect of Fe2+, Co2+and Ni2+ions on methane production from heavy oil

Figure 1 Effect of Fe2+, Co2+and Ni2+ions on the methane production from heavy oil
The methane production under different Fe2+, Co2+and Ni2+conditions is shown in Figure 1. Under different Fe2+addition conditions, the methane production increased slowly in the first 120 days and began to rapidly rise af-ter 150 days of cultivation (Figure 1(a)). The maximum methane production was 0.874 6 mmol/d upon adding a Fe2+ion concentration of 1.1 mg/L during 210 days of cultivation. However, the control test indicated that the methane production was equal to merely 0.102 µmol/d. The addition of Fe2+ions could significantly increase the methane production from heavy oil.
Under different Co2+addition conditions, methane production increased slowly within the first 90 days and began to rapidly grow after 120 days of cultivation (Figure 1(b)). The maximum methane production was 0.941 2 µmol/d under the condition of adding 0.8 mg/L of Co2+ions during 180 days of cultivation. However, the control test indicated that the methane production was only equal to 0.102 µmol/d. The addition of Co2+ions could signif icantly increase the methane production from heavy oil.
As shown in Figure 1(c), methane production increased slowly in the first 90 days and began to rapidly rise after 120 days of cultivation. The maximum methane production was 1.177 62 µmol/d upon adding a Fe2+ion concentration of 0.07 mg/L during 240 days of cultivation. The addition of Ni2+ions could significantly enhance the methane production from heavy oil.
Trace elements — Fe2+, Co2+and Ni2+ions could promote the growth of methanogen and enhance the activities of several kinds of enzymes, and then accelerate the synthesis of methane. Fe2+and Co2+ions take part in the form of carbon monoxide dehydrogenase which plays an important role in the formation of acetic acid. Ni2+ion is an important component element of E430. So Ni2+ion is necessary for methanogenic bacteria which produce methane utilizing CO2and H2as substrates.
3.2 Natural attenuation and Box-Behnken design results
The optimal level of the trace elements (Fe2+, Co2+, Ni2+) and the effect of their interactions on methane production were further explored by the Box-Behnken design of RSM (Table 4). By applying multiple regression analysis on the experimental data, the following second-order polynomial equation was established to explain the oilremoval process:
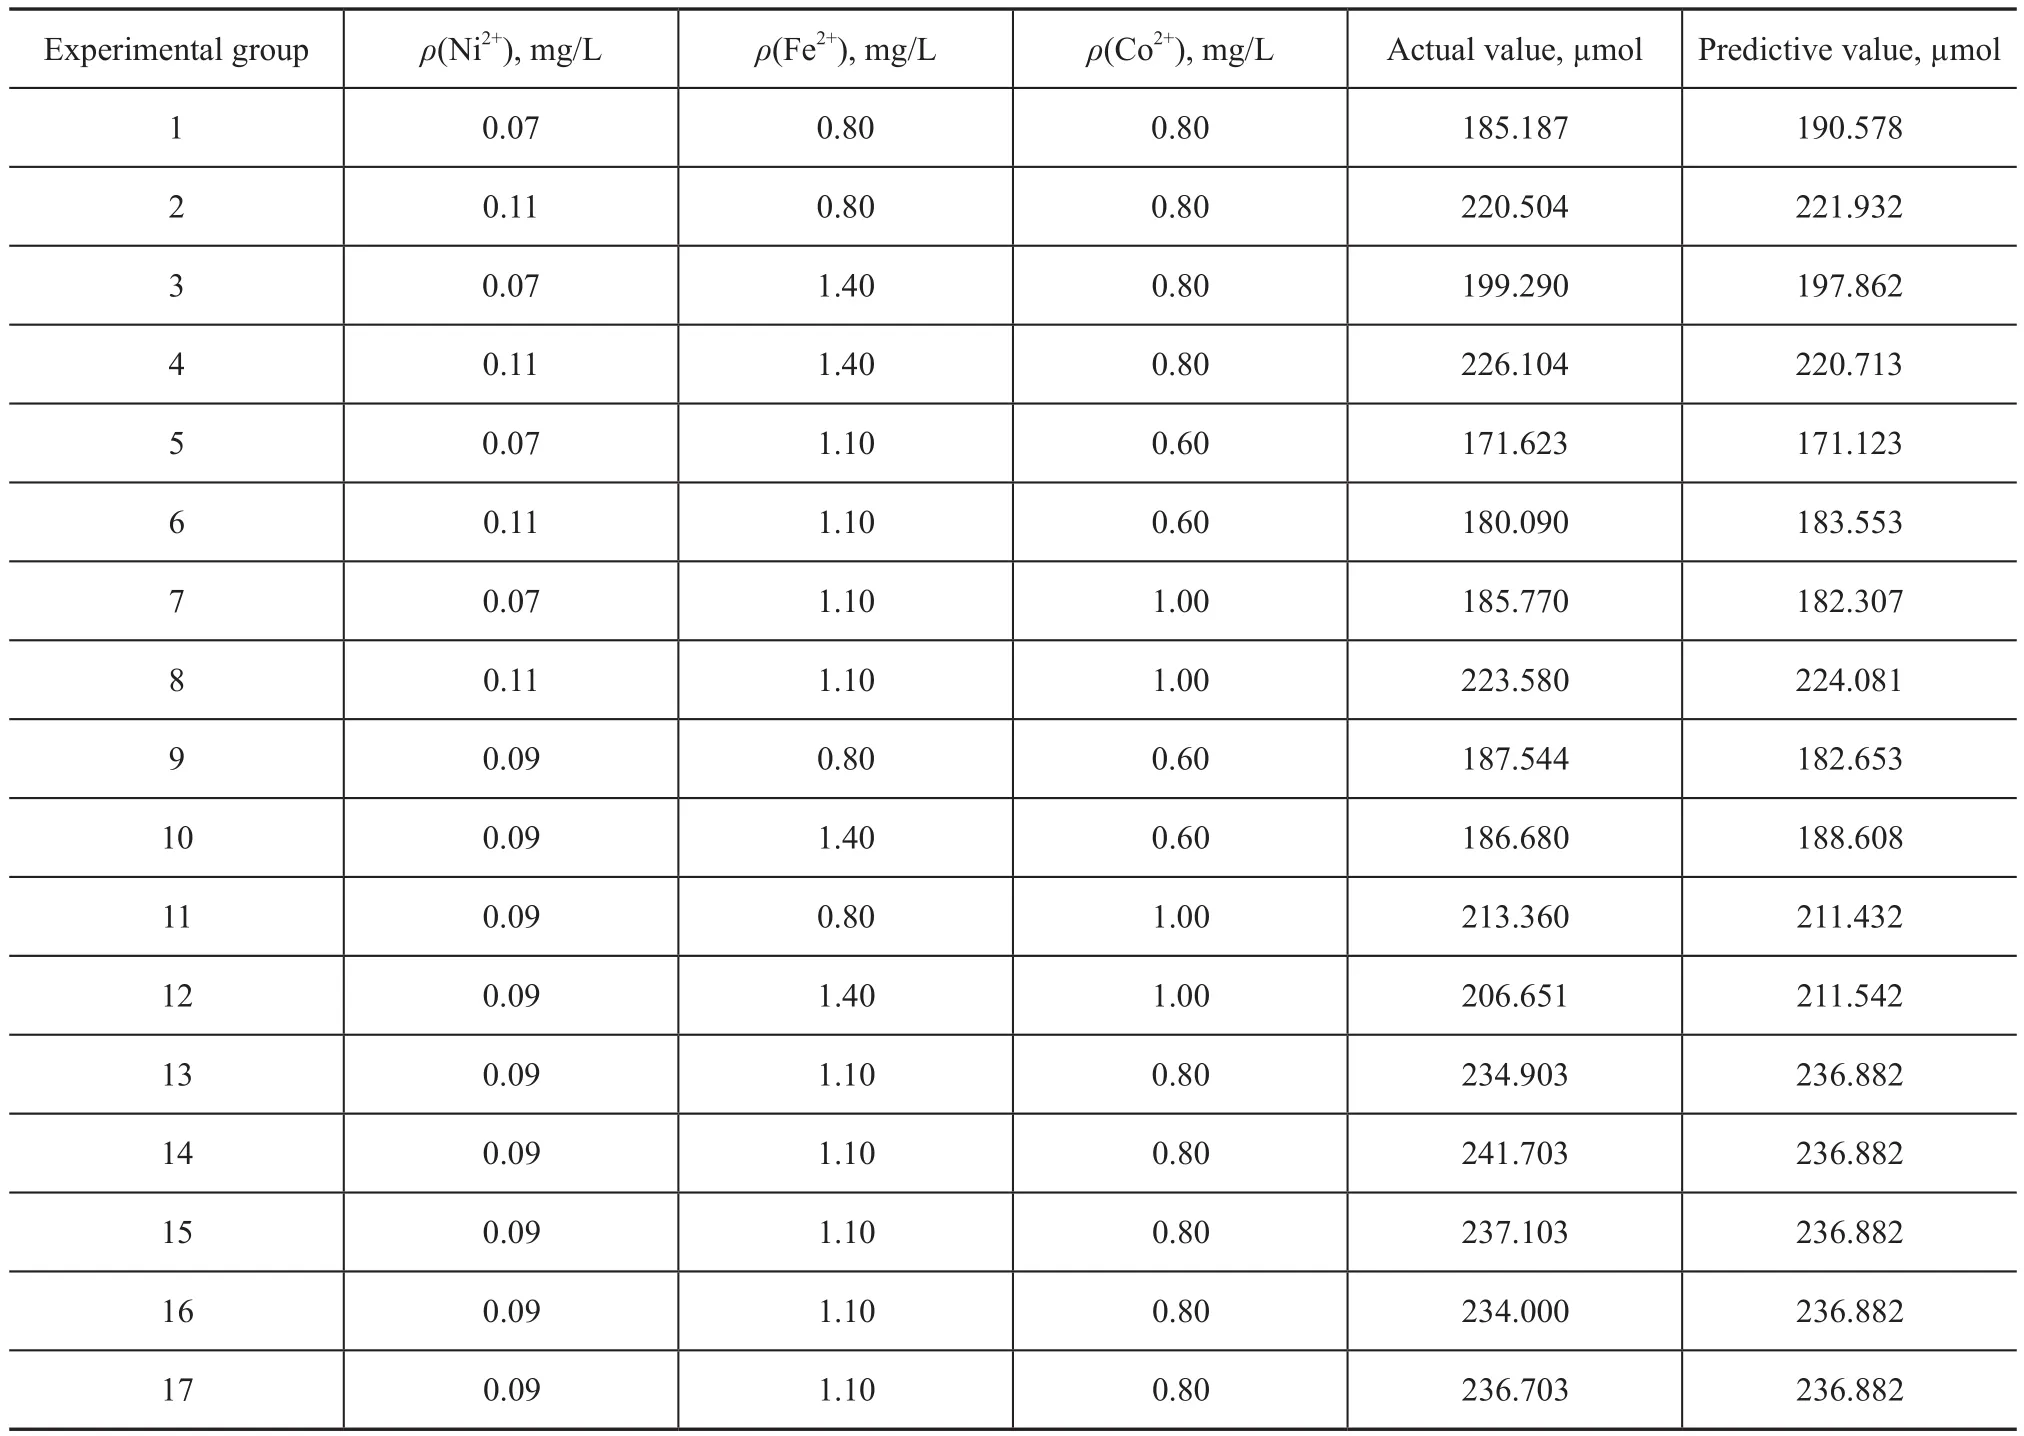
Table 4 Test design and test results
Y=236.88+13.55A+1.52B+12.93C-2.13AB+7.34AC-1.46BC-18.70A2-10.41B2-27.91C2
where, Y is the predicted methane production rate; A, B and C are the coded values of crude Fe2+, Co2+and Ni2+ions, respectively. The analysis of variance (ANOVA) was conducted to test the significance of the fit of the secondorder polynomial equation for the experimental data as shown in Table 5.
The model F-value of 38.47 implies that the model is significant. There is only a 0.01% chance that a “model F-value” could occur due to noise. The P-values are used as a tool to check the significance of each variable, which also indicates the interaction strength between each independent variable[13]. The smaller the P-values are, the bigger the significance of the corresponding variable would be[14]. P-values in this study that are less than 0.05 indicate that the model terms are significant. In this case AC, C, A2, B2, C2 are signif icant model terms. The insignificant effects (factors and interactions) with P-values that are higher than 0.100 are ignored. Thus, statistical analysis of all the experimental data showed that Fe2+, Co2+and Ni2+ions had a significant effect on methane production during the study. Here the R2value was 98.06%, which could explain a 98.06% variability of the response. It indicates a good agreement between experimental and predicted values and implies that the mathematical model is very reliable for determining the methane production in the present study.
The graphical representation of the response shown in Figure 2 (a-c) can help to visualize the effect of Fe2+, Co2+and Ni2+ions on removal of crude oil. The effect of interaction of Fe2+and Co2+ions on methane production is illustrated in Figure 2 (a). The most production yield was observed at the concentration of Fe2+and Ni2+ions equating to 1.1 mg/L and 0.09 mg/L, respectively. Figure 2(b) shows the 3D surface plot of the effect of interaction between Co2+ions and Ni2+ions. It can be seen that higher yield of methane production was obtained at a Co2+ion concentration of 0.8 mg/L, and Co2+ions had strong interaction with Ni2+ions. Finally, Figure 2(c) shows the response surface 3D plot of the effect of interaction between Co2+and Fe2+concentrations. This plot demonstrates that both Co2+and Fe2+have the best performance at optimum concentrations. It was also observed that excessive Co2+concentration does not have much effect on increasing the bioremediation yield.
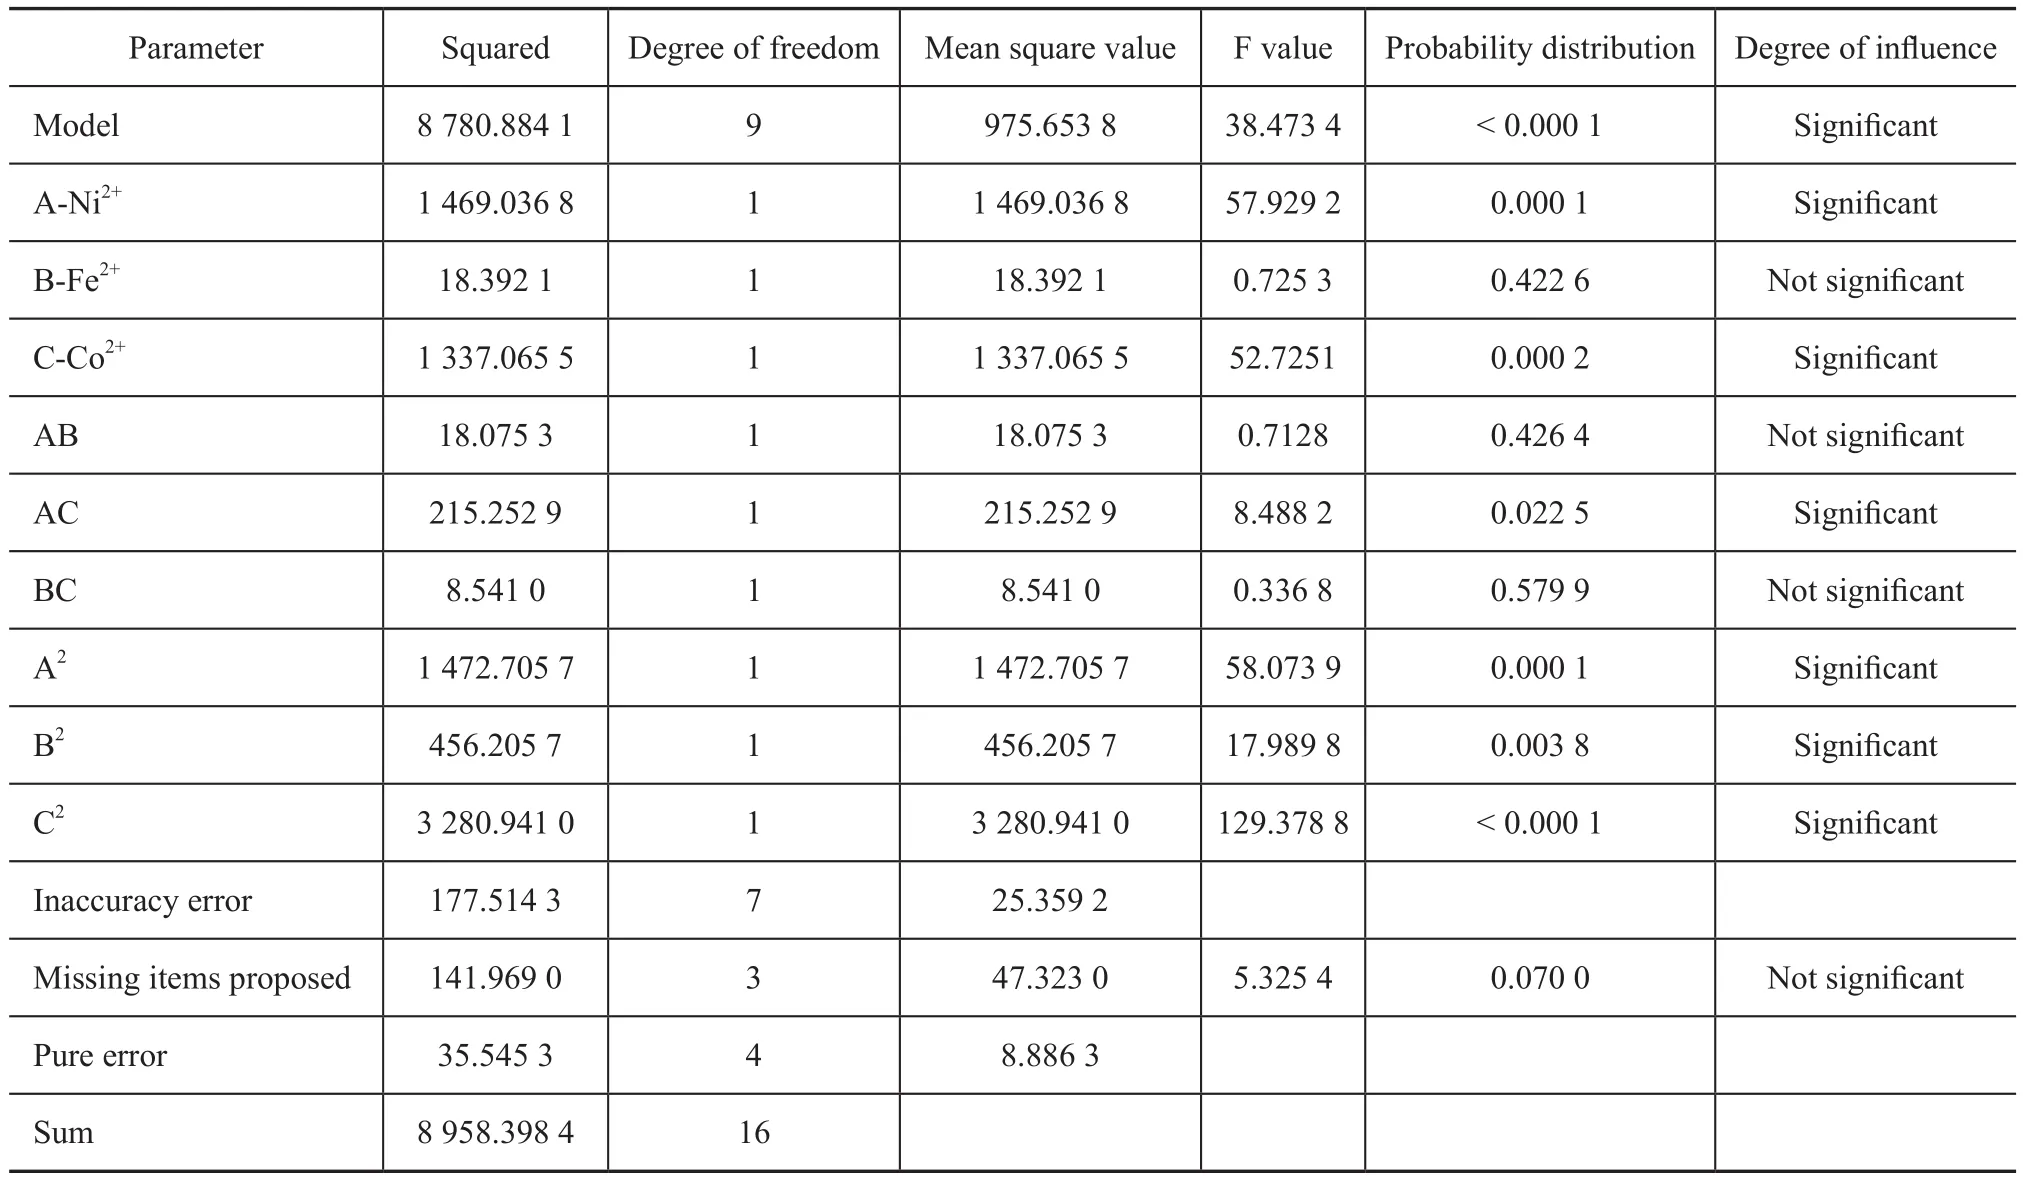
Table 5 ANOVA for response surface quadratic model terms

Figure 2 Response surface 3D plots indicating interaction effects of (a) Fe2+and Co2+, (b) Co2+and Ni2+and (c) Fe2+and Co2+
3.3 Validation of the models
It can be seen from Table 6 that under the un-optimized condition the highest methane production was 236.88 µmol. While uder the optimized condition the highest methane production was 241.57 µmol. The experimental results show that the predicted values are very close to the experimental values. In a word, the model is appropriate and effective.
3.4 DGGE analysis
Total bacterial DNA in tests of samples containing 1.1 mg/L of Fe2+(A), 0.8 mg/L of Co2+(B), 0.09 mg/L of Ni2+(C) and a mixture comprised of 1.1 mg/L of Fe2+, 0.8 mg/L of Co2+and 0.09 mg/L of Ni2+, respectively, were extracted. Based on DGGE bands under different trace element conditions, it can be seen that microbial diversity appeared dramatically different from each other (Figure 3). Total bands increased obviously from 12 in the original solution to 15 after addition of trace elements. Upon analyzing the sample containing Fe2+ions, the band T1 appeared. Upon analyzing the sample containing a mixture of Fe2+, Co2+and Ni2+ions, the bands H1 and H2 appeared. The bands H3 and H4 were dominant in all samples. A part of dominant bands in Figure 3 was cut out for DNA sequencing analysis. The sequences with similarity greater than 97% were considered as the same operational taxonomic unit (OTU). Bands T1, H3 and H4 correspond to Bacillus spp. (Table 7), one of members of which was isolated and indentified as a crude oil-degrader[15].

Figure 3 DGGE analysis of patterns
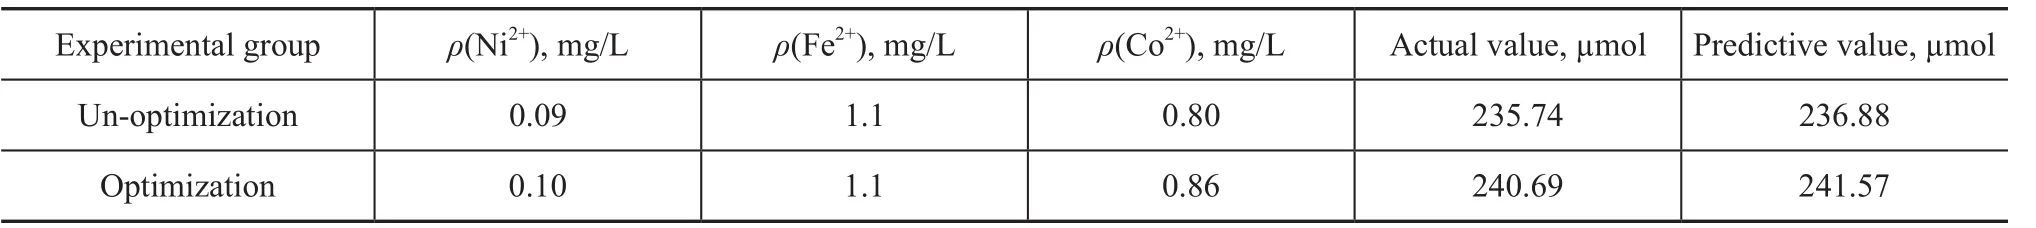
Table 6 Methane production after optimization based on Box-Behnken design

Table 7 Results of recycling sequencing analyses
4 Conclusions
Trace elements — Fe2+, Co2+and Ni2+have significant effect on biological methane gas production from heavy oil. The response surface method is a reliable and powerful tool for modeling and optimizing the methane production. The proposed model equation illustrated the quantitative effect of variables and also the interactions among the variables on methane production. Under the optimum conditions, the methane production was 240.69 µmol compared to 18.74 µmol obtained under the control test. The strains Bacillus spp. likely played an important role in methane production from heavy oil.
Acknowledgements: This research was supported by the National Natural Science Foundation of China under Grant No. 21307160, the Natural Science Foundation of Shandong Province under Grant No. ZR2013EEQ030, and the Fundamental Research Funds for the Central Universities under Grant No. R1404005A.
[1] Li Xia, Chen Lei, Deng Yu. Progress in anaerobic biodegradation of petroleum hydrocarbons [J]. Applied and Environmental Biology, 2008, 14(2): 283-289
[2] Wang Weidong, Wang Jing, Geng Xueli, et al. Status of residual oil reservoir and prospect of bio-gasification technology[J]. Petroleum Geo-Engineering, 2012, 26(1): 78-81
[3] Zengler K, Richnow H H, Rossello-Mora R, et al. Methane formation from long-chain alkanes by anaerobic microorganisms[J]. Nature, 1999, 401(6750): 266-269
[4] Anderson R T, Lovley D R. Hexadecane decay by methanogenesis[J]. Nature, 2000, 404(13): 722-723
[5] Jones D M, HeadiM, Gray N D, et al. Crude oil biodegradation via methanogenesis in subsurface petroleum reservoirs[J]. Nature, 2008, 451(7175): 176-180
[6] GieglM, Duncan K E, Suflita J M. Bioenergy production via microbial conversion of residual oil to natural gas[J]. Applied and Environmental Microbiology, 2008, 74(10): 3022-3029
[7] Townsend G T, Prince R C, Suflita J M. Anaerobic oxidation of crude oil hydrocarbons by the resident microorganisms of a contaminated anoxic aquifer[J]. Environmental Science & Technology, 2003, 37(22): 5213-5218
[8] Liu Chunshuang, Zhao Dongfeng, Zhang Yunbo. Effects of temperature, acetate and nitrate on methane generation from petroleum hydrocarbons[J]. China Petroleum Processing and Petrochemical Technology, 2014, 16(4): 24-31
[9] Zandvoort M H, Hullebusch E D, Fermoso F G, et al. Trace metals in anaerobic granular sludge reactors: Bioavailability and dosing strateries[J]. Eng Life Sci, 2006, 6(3): 293-301
[10] Scherer P, Lippert H, Wolff G. Composition of the major elements and trace elements of 10 methanogenic bacteria determined by inductively coupled plasma emission spectrometry[J]. Biol Trac Elem Res, 1983, 5: 149-163
[11] William D M, Lvanden B. Effects of Nickel, Cobalt and Molybdenum on Performance of Methanogenic Fixed-Film Reactors[J]. Appl Environ Microbio, 1981, 42(3): 502-505
[12] Watanabe K, Kodama Y, Harayama S. Design and evaluation of PCR primers to amplify bacterial 16S ribosomal DNA fragments used for community fingerprinting[J]. Journal of Microbiological Methods, 2001, 44: 253-262
[13] Liu J Z, WenglP, Zhang Q L. Optimization of glucose oxidase production by Aspergillus niger in a benchtop bioreactor using response surface methodology[J]. World Journal of Microbiology and Biotechnology, 2003, 19: 317-323
[14] Muralidhar R V, Chirumamila R R, Marchant R. A response surface approach for the comparison of lipase production by Candida cylindracea using two different carbon sources[J]. Biochemical Engineering Journal, 2001, 9(1): 17-23
[15] Schippers A, Bosecker K, Spröer C, et al. Microbacterium oleivorans sp. nov. and Microbacterium hydrocarbonoxydans sp. nov., novel crude-oil-degrading Gram-positive bacteria[J]. International Journal of Systematic & Evolutionary Microbiology, 2005, 55: 655-660
date: 2014-11-28; Accepted date: 2015-02-05.
Zhao Dongfeng, Telephone: +86-532-86981576; E-mail: zhaodf@vip.sina.com.
杂志排行

中国炼油与石油化工的其它文章
- Pyrolysis Characteristics and Kinetics of Methyl Oleate Based on TG-FTIR Method
- Development of RSDS-III Technology for Ultra-Low-Sulfur Gasoline Production
- A Highly Efficient and Selective Water-Soluble Bimetallic Catalyst for Hydrogenation of Chloronitrobenzene to Chloroaniline
- Curing Mechanism of Condensed Polynuclear Aromatic Resin and Thermal Stability of Cured Resin
- A Novel Thermally Coupled Reactive Distillation Column for the Hydrolysis of Methyl Acetate
- Synthesis of Waterborne Polyurethane Modified by Nano-SiO2Silicone and Properties of the WPU Coated RDX