Kinetic Study on Liquid-Phase Hydrodesulfurization of FCC Diesel in Tubular Reactors
2015-06-22LiHuaYangJinliangWengHuixinWangJiming
Li Hua; Yang Jinliang; Weng Huixin; Wang Jiming
(1. East China University of Science and Technology, Shanghai 200237; 2. SINOPEC Changling Petrochemical Company, Yueyang 414012; 3. SINOPEC Group, Beijing 100728)
Kinetic Study on Liquid-Phase Hydrodesulfurization of FCC Diesel in Tubular Reactors
Li Hua1,2; Yang Jinliang1; Weng Huixin1; Wang Jiming3
(1. East China University of Science and Technology, Shanghai 200237; 2. SINOPEC Changling Petrochemical Company, Yueyang 414012; 3. SINOPEC Group, Beijing 100728)
According to the characteristics of FCC diesel, a technology of liquid-phase hydrodesulfurization of the diesel in tubular reactors was proposed and lab-scale experiments were carried out. A kinetic model for the hydrodesulfurization process was developed and verified. The model was utilized to predict the sulfur content of products under different operating conditions. The effects of temperature, space velocity, pressure, and hydrogen concentration on the desulfurization rate were investigated.
FCC diesel; liquid-phase; hydrodesulfurization; kinetic model
1 Liquid-phase hydrodesulfurization of FCC diesel
Up to now, sulfur content is the most important quality item for diesel fuel specification. To meet the increasingly stringent environmental regulations, diesel will be requested to have lower sulfur and aromatic content. However, as high as 30% of diesel pool in China are produced by FCC units. This diesel fraction features high sulfur and aromatic content but low cetane number[1-3]. The hydrogenation of FCC diesel is a key technology to improve the quality and hence upgrade the standard for the clean diesel fuel in China. In the meantime, the upgrading of the standard for clean diesel fuel has also promoted the development of the diesel desulfurization technologies, among which the hydrodesulfurization (HDS) technology is widely used.
A technology of FCC diesel liquid-phase hydrogenation (FCCD-LPH) aimed at hydrodesulfurization in tubular reactors was proposed by a domestic refinery and has been rapidly developing in recent years. It is more economic than the conventional HDS technology in the sense that: (1) Only a small amount of dissolved hydrogen enters the fixed bed reactor so that less hydrogen has to be circulated; (2) The configuration of reactors is simplified, e.g., a proper gas-liquid distribution or a high degree of wetting of the catalyst are not needed as in the HDS technology, which probably will reduce the reactor size; (3) No practical scale-up problems are needed since the reactor can beregarded as a plug flow reactor[4]; (4) The hydrogen gas is supplied at different positions of the reactor, which can replace circulating hydrogen in HDS technology; and (5) All the hydrogen needed for the liquid-phase hydrogenation is dissolved in the liquid through the hydrogen mixing device prior to entering the reactor, while eliminating the influence of gas-liquid mass transfer in the reactor[5]. In this work, the lab-scale experiments on FCCD-LPH were carried out and a kinetic model was developed. The most important reactions, i.e., hydrodesulfurization (HDS), hydrodenitrogenation (HDN) and aromatics saturation have been taken into account in the model. The parameters of the model were estimated by the least square method using experimental data. The model was then used to assess the effect of operating conditions on the hydrogenation process.
2 Experimental
Figure 1 shows the flow diagram of the experimental setup. The experiments were carried out over the RS-2000 catalyst in a 100-mL fixed-bed tubular reactor. The liquid hourly space velocity (LHSV) was 1 h-1—5 h-1. The reaction temperature varied from 330 ℃ to 380 ℃. The initialhydrogen concentration was between 0.42% and 1.12%, and the pressure ranged from 5 MPa to 8 MPa. The properties of FCC diesel are shown in Table 1 and the experimental results are presented in Table 2 and Table 3.
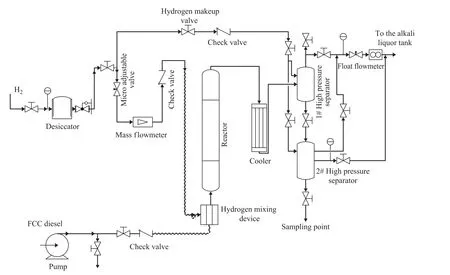
Figure 1 Flow diagram of the liquid-phase hydrogenation process in a tubular reactor

Table 1 Properties of FCC diesel
3 Kinetic Model
3.1 Formulation of the kinetic model
The main reactions in the system cover hydrodesulfurization (HDS), hydrodenitrogenation (HDN) and dearomatization. It is observed from the experimental results (Table 2) that sulfur and nitrogen content in all products decreased with an increasing temperature and initial hydrogen concentration and a decreasing liquid hourly space velocity. The influence of the pressure was negligible. Similar phenomena have also been observed by Schmitz, et al.[6]The reason may be caused by the fact that all the hydrogen needed for the reaction is dissolved in the liquid before the liquid enters the reactor and hence for the liquid phase the influence of pressure can be negligible. So we used the hydrogen concentration to replace the hydrogen pressure in the kinetic model.
A number of studies[6-13]have been conducted to develop the kinetic model for the HDS and HDN reactions. The common approaches are based on the power-law or the Langmuir-Hinshelwood kinetic models. In this study, HDS reaction and HDN reaction were described by the power-law and the n-order reactions were assumed.
It can be seen from the experimental results (Table 3) that the diaromatics content in all products decreased rapidly with an increasing temperature and initial hydrogenconcentration and a decreasing space velocity, while the monoaromatics content in all products increased sharply. This indicated that the main reactions of aromatics hydrogenation under the experimental conditions were related with the saturation of diaromatics to monoaromatics. This phenomenon resulted in a negligible change in the total
aromatics content in the product. The kinetics of dearomatization reaction was also studied by many researchers[14-16]. Chowdhury, et al.[14]considered that mono-, di-, and poly-aromatics undergo different hydrogenation reactions that are all reversible under normal hydrogenation conditions. Then they formulated the kinetic equations for the hydrogenation of mono-, di- and poly-aromatics based on the above assumption. In this study, the kinetic equations for dearomatization that were similar to Chowdhury’s[14]were established. The forward reactions are n-order ones with respect to aromatics and hydrogen. The backward reactions are first order ones with respect to the products.

Table 3 Aromatic concentration of the products

Table 2 Experimental results of FCCD-LPH process in a tubular reactor
It also can be found out from the test results that the naphthenes content almost showed no change. This might occur because the hydrogen concentration was so low that it was difficult to saturate mono-aromatics into naphthenes. For this reason, in this study the hydrogenation of mono-aromatics to naphthenes was neglected and the backward reaction of mono-aromatics to the di-aromatics was taken into account. Upon comparing the traditional hydrogenation technology with the liquid-phase hydrogenation technology, the main difference is the concentration of hydrogen flowing along the reactor. For the FCCD-LPH technology, there is no hydrogen supplied during the reaction, so the hydrogen concentration reduces significantly along the reactor. Therefore, it is necessary to consider the change in the hydrogen concentration in the liquid-phase[17-18].
Based on the above analyses, the reaction kinetic model for the FCCD-LPH process in tubular reactors was formulated as follows:
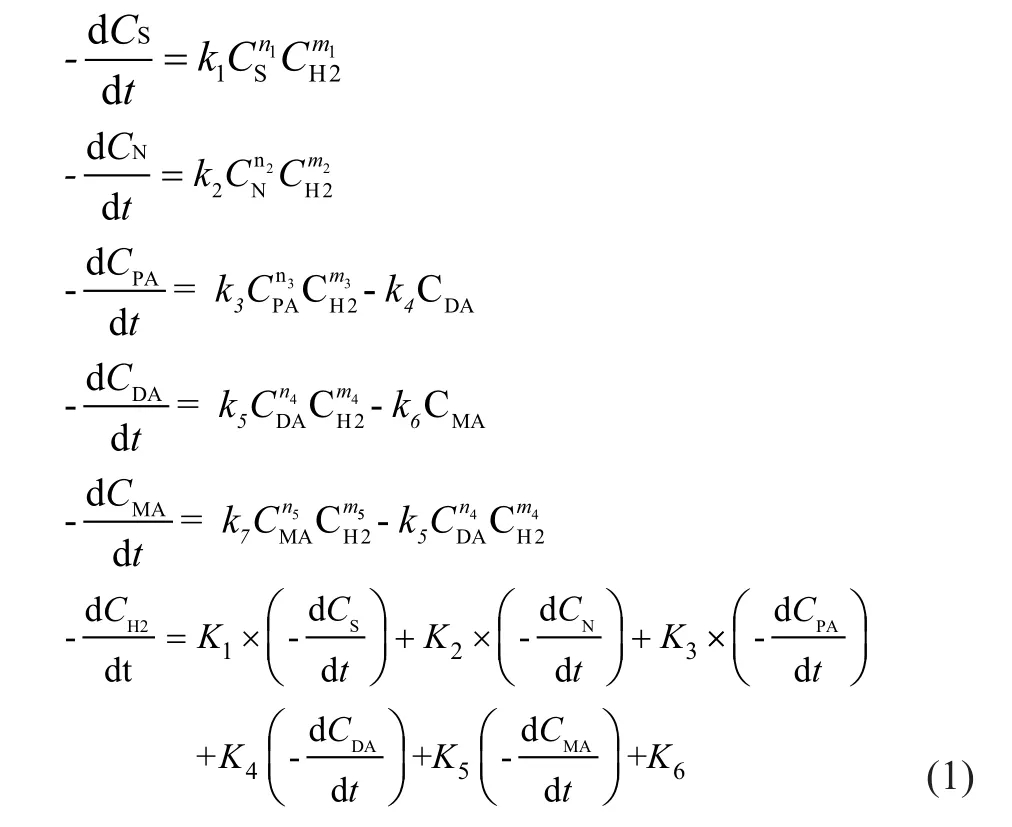
where Ciis the concentration of the reactants in liquidphase (%) andistands for the following reactants: S, N, PA (poly-aromatics), DA (di-aromatics), MA (monoaromatics) and H2. In these equations n1—n5are the reaction orders with respect to reactants; m1—m4are the reaction orders with respect to hydrogen. kiis the reaction rate constant of each reaction in liquid-phase and its relationship with the temperature obeys the Arrhenius equation, and the formula is presented below:
ki=k0i·exp(-Eai/RT), in which k0i(h-1) refers to the preexponential factor, Eaiis the activation energy (kJ/mol) of reaction, T (K) is the reaction temperature, R is the gas constant, which is equal to 8.314 5 J/(mol·K), andirefers to 1—7; K1—K5are the proportions of hydrogen consumed in various main reactions and K6is the proportion of hydrogen consumed in the other reactions in the hydrogenation process (%/h).
3.2 Estimation of kinetic parameters and model validation
3.2.1 Estimation of kinetic parameters[19]
Estimation of kinetic parameters is an important step in the development of models. The model presented above is described by a series of ordinary differential equations (ODEs) with unknown parameters. The optimization problem is supposed as a Non-Linear Programming (NLP) problem and is solved with a nonlinear least-squares method.
The unknown kinetic parameters in this work can be fitted by the experimental data. The top 11 sets of the experimental data (Table 2 and Table 3) were used to fit the kinetic parameters. The parameters fitted are shown in Table 4.Figure 2 shows the comparison between the experimental and the calculated mass concentrations of sulfur, nitrogen and hydrogen as a function of reaction time. All the calculated values are in good agreement with the experimental data. Figure 3 shows the comparison between the calculated and the experimental values of desulfurization rate. It can be seen that the calculated values are in good agreement with the experimental values.
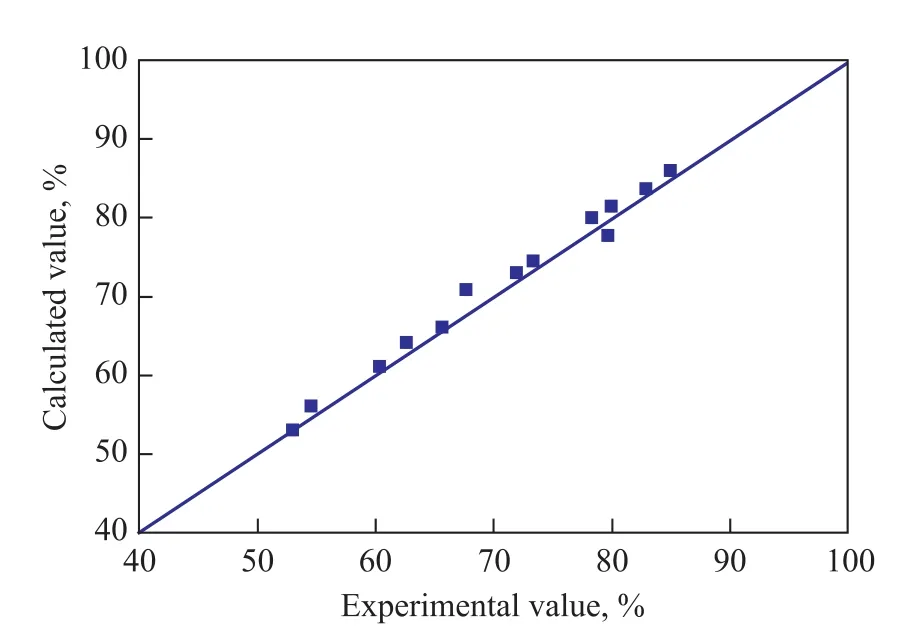
Figure 3 Comparison of the desulfurization rate between the calculated values and the experimental values
3.2.2 Model validation
The kinetic model has been validated with the last 4 sets of experimental data in Table 2 and Table 3. Tables 5 and 6 show the comparison between the calculated results and the experimental values.
As shown in Tables 5 and 6, the average errors of both sulfur content and aromatic groups contents are less than 10%, which can meet the requirements of industry application. The average error for nitrogen is 13.81%, because the nitrogen content is lower than that of sulfur and aromatics.
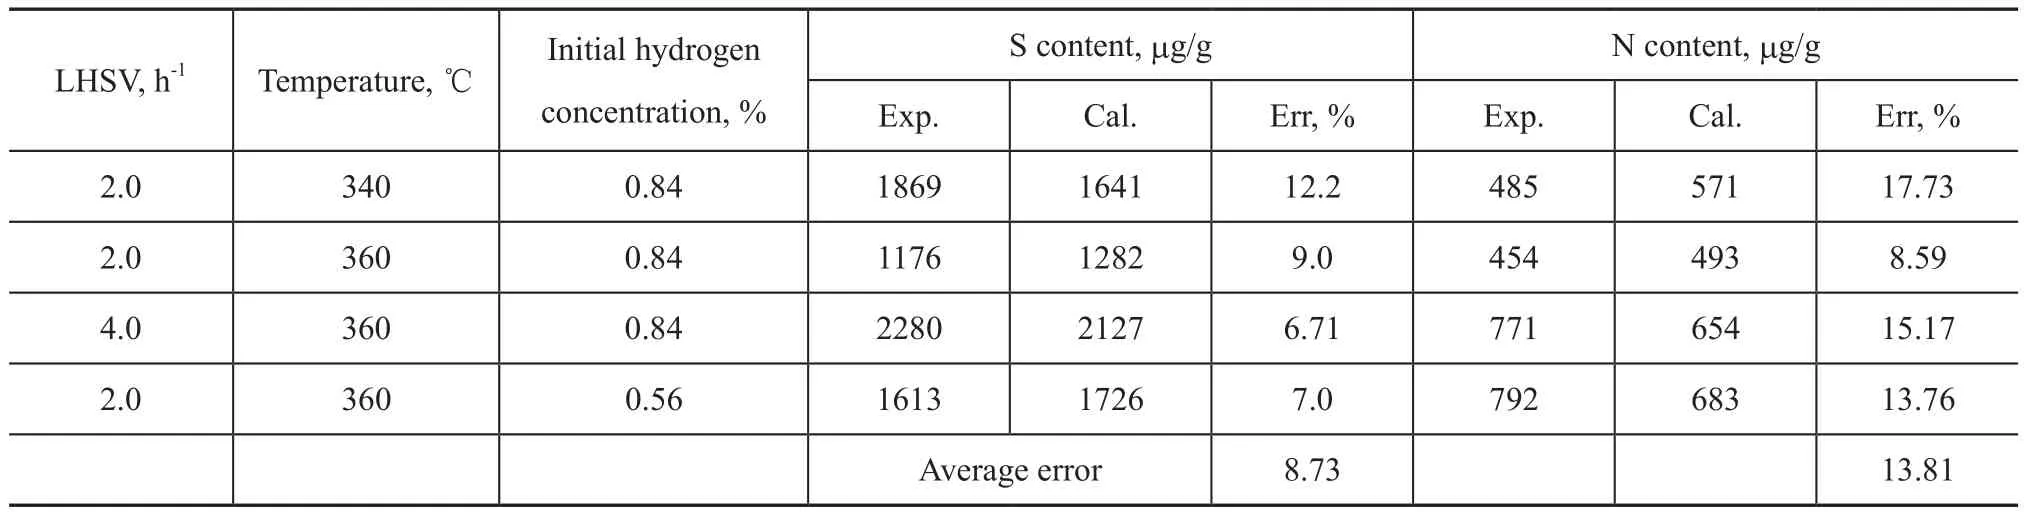
Table 5 Comparison between the calculated and the experimental content of S and N
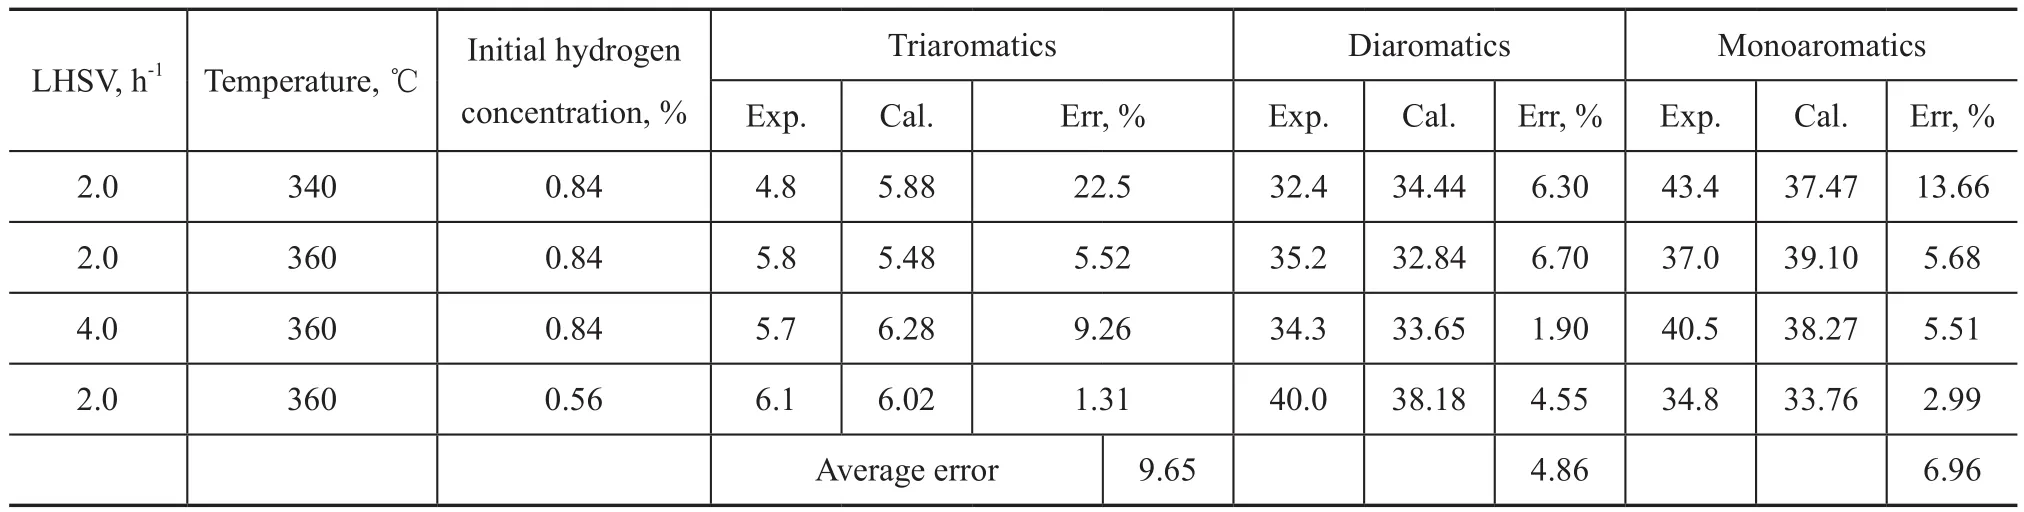
Table 6 Comparison between the calculated and the experimental content of aromatics
4 Model Prediction
4.1 Operating conditions
The kinetic model was used to predict the FCCD-LPH performance in tubular reactors under different operating conditions to optimize the conditions for the hydrodesulphurization of FCC diesel. The investigated conditions are as follows: reaction temperature (330 ℃—390 ℃), initial hydrogen concentration(0.42%—1.40%), LHSV (1 h-1—5 h-1) and pressure (6.4 MPa).
4.2 Results and discussions
Figure 4 shows the predicted desulfurization rate as a function of reaction temperature and liquid hourly space velocity(LHSV) under the conditions of specified pressure(6.4 MPa) and initial hydrogen concentration(1.4 %). With the increase of temperature, the sulfur content of product decreased along with the increase in desulfurization rate. The desulfurization rate increased with the decrease in liquid hourly space velocity. The predicted highest desulfurization rate was 95.65% at a reaction temperature of 390 ℃ and a LHSV of 1 h-1. The resultant sulfur content in the products was 250 μg/g. Figure 5 shows the predicted desulfurization rate as a function of reaction temperature and the initial hydrogen concentration at a pressure of 6.4 MPa and a LHSV of 2 h-1. With an increasing initial hydrogen concentration, the desulfurization rate increased. The sulfur content of product decreased sharply with the increase in reaction temperature, and the desulfurization rate also increased dramatically. The predicted highest desulfurization rate was 89.6% at a reaction temperature of 390 ℃ and an initial hydrogen concentration of 1.4%.
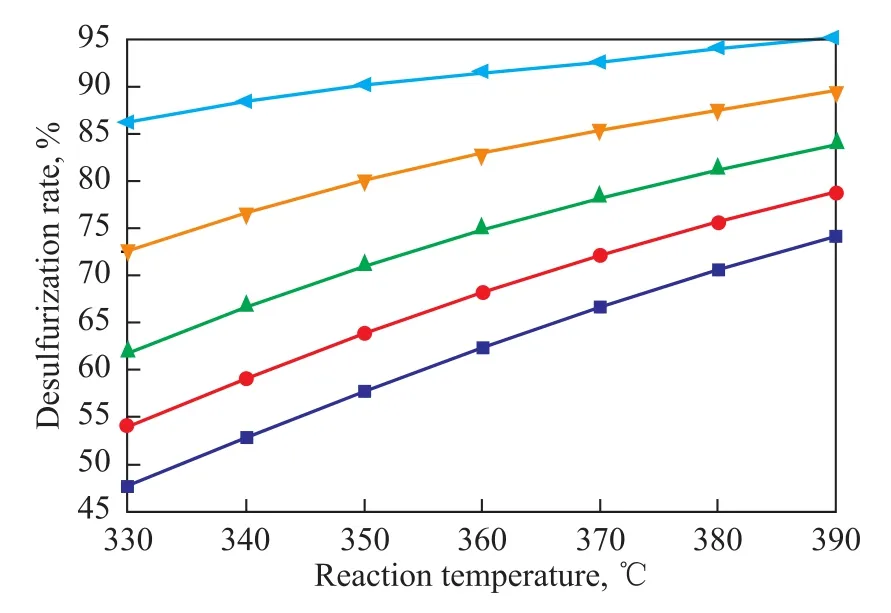
Figure 4 Predicted desulfurization rate under different LHSVs and reactor temperatures at a pressure of 6.4 MPaand an initial hydrogen concentration of 1.4%
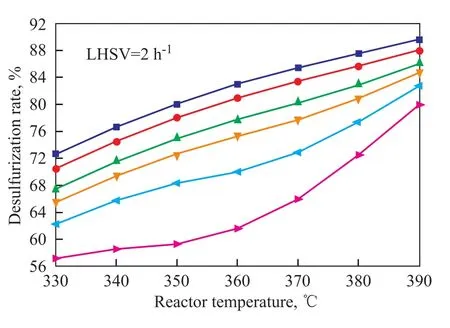
Figure 5 Predicted desulfurization rate under different initial hydrogen contents and reactor temperatures at apressure of 6.4 MPa and a LHSV of 2 h-1
Although the increase in reaction temperature could increase the desulfurization rate, it would also promote cracking reactions and enhance the coke formation on catalyst. For this reason, the temperature of the reactor cannot be casually increased. There should be a limit. The decrease in LHSV means an increase in the residence time, and the product quality will be improved, but the production capacity will be decreased. Therefore the LHSV should also be limited to make the reactor throughput reasonable.
In addition, the desulfurization rate increases with an increasing initial hydrogen concentration as a higher hydrogen concentration will speed up the reaction. But in this hydrogenation process the initial hydrogen concentration is not sufficient for undergoing the reaction. So supplying more hydrogen is necessary for the FCCD-LPH process. Figures 6 and 7 show the predicted concentration of hydrogen in products with different initial hydrogen concentrations as a function of reaction temperature and LHSV at a pressure of 6.4 MPa. Figure 6 shows that the concentration of hydrogen decreased with an increasing temperature at the same initial hydrogen concentration. For example, at a LHSV of 2 h-1, the hydrogen concentra-tion in the products decreased from 0.5% to 0.11% when the temperature increased from 330 ℃ to 390 ℃.
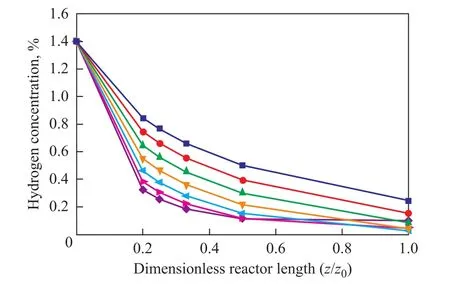
Figure 6 Predicted concentration of hydrogen at different reactor temperatures along the reactor at p=6.4 MPa and an initial concentration of hydrogen equating to 1.4%
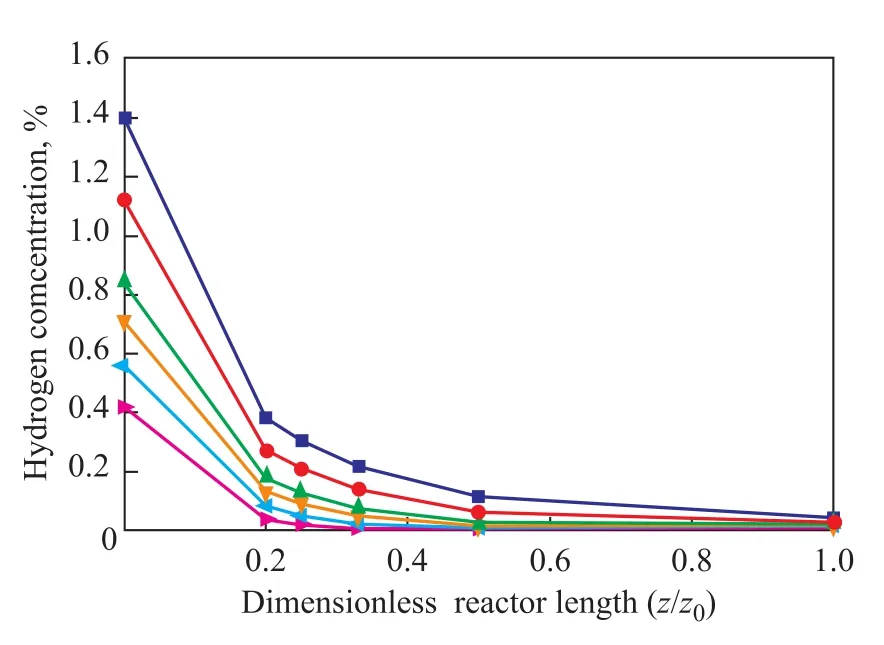
Figure 7 Predicted concentration of hydrogen at different initial concentrations of hydrogen along the reactor at p=6.4 MPa and T=380 ℃
In Figure 7 the predicted concentration of hydrogen is plotted against LHSV at different initial hydrogen concentrations in the liquid-phase at 380 ℃. It can be seen that with an increasing initial hydrogen concentration, the rate of hydrogen consumption increased. It also can be seen that hydrogen decreased sharply along the reactor axis and almost all hydrogen stream in liquid-phase has been consumed in the middle of the reactor at a LHSV of 2 h-1. This means that hydrogen should be supplied before this position of the reactor under these operating conditions.
5 Conclusions
A reliable kinetic model for the FCCD-LPH process in tubular reactors has been developed. The predictions of the model indicated: With an increasing reactor temperature or a decreasing LHSV at a constant initial hydrogen concentration, the desulfurization rate increased; The sulfur content in the products under different operating conditions was still very high. The main reason is that the hydrogen in liquid-phase was not sufficient and it is necessary to supply more hydrogen along the reactor; The experimental results and the model predictions showed that the FCCD-LPH technology can be used to achieve deep desulfurization of diesel.
Acknowledgement: The authors sincerely thank the financial support from the SINOPEC (No. 2014310031600599).
Reference
[1] Si Yunhang, Zhu Yuqin, Zou Rongmei, et al. Current situation and development trend of automobile diesel standards in China[J]. Chemical Engineering of Oil & Gas, 2014, 43(1): 82-86 (in Chinese)
[2] Zheng Renyang, Xin Jing, Zhang Runqiang, et al. Influence of hydrotreating depth on properties of LCO[J]. Petroleum Processing and Petrochemicals, 2014, 45(10): 1-7
[3] Wang Fujiang, Zhang Yuying, Long Xiangyun, et al. Study on cetane number improvement of LCO by hydrotreating[J]. Petroleum Processing and Petrochemicals, 2013, 44(10): 28-32
[4] Wache W, Datsevich L, Jess A, et al. Improved deep desulphurization of middle distillates by a two-phase reactor with pre-saturator[J]. Fuel, 2006, 85(10/11): 1483-1493
[5] Hao Zhenqi, Liang Wenping, Xiao Junquan, et al. Commercial application of diesel liquid phase recycling hydrogenation technology[J]. Petroleum Processing and Petrochemicals, 2013, 44(12): 20-22 (in Chinese)
[6] Schmitz C, Datsevitch L, Jess A. Deep desulfurization of diesel oil: Kinetic studies and process-improvement by the use of a two-phase reactor with pre-saturator[J]. Chemical Engineering Science, 2004, 59(14): 2821-2829
[7] Liu Kaixiang, Li Hao, Sun Lili, et al. Control measures of maintaining continuous liquid-phase within up-flow hydrogenation reactor[J]. Petroleum Processing and Petrochemicals, 2012, 43(8): 7-12 (in Chinese)
[8] Liu Feng, Xia Guofu, Chu Yang, et al. Study on kineticmodels for hydrodesulfurization of jet fuel[J]. Petroleum Processing and Petrochemicals, 2013, 44(1): 36-40 (in Chinese)
[9] Huang Haitao, Qi Yanhua, Shi Yulin, et al. Study on kinetic models for deep hydrodesulfurization of LCO[J]. Petroleum Processing and Petrochemicals, 1999, 30(1): 55-59 (in Chinese)
[10] Dong Zhenguo, Yu Xizhi, Li Kai, et al. Kinetics of the hydrodenitrogenation of quinoline over a commercial NiW/ Al2O3catalyst[J]. Journal of Chemical Engineering of Chinese Universities, 2006, 20(5): 717-722 (in Chinese)
[11] Xu Zhengli, Wu Hui, Li Chenglie. Hydrodenitrogenation kinetic model[J]. Journal of East China University of Science and Technology, 2001, 27(1): 42-45 (in Chinese)
[12] Zhou Xingbiao, Liang Jialin, Jiang Donghong, et al. Deactivation kinetic model of VGO HDS catalyst RN-32V[J]. Petroleum Processing and Petrochemicals, 2014, 45(8): 1-5
[13] Liu Lihua, Liu Shuqun. Ni2P-MoS2/γ-Al2O3catalyst for deep hydrodesulfurization via the hydrogenation reaction pathway[J]. China Petroleum Processing and Petrochemical Technology, 2014, 16(4): 12-18
[14] Chowdhury R, Pedernera E, Reimert R. Trickle-bed reactor model for desulfurization and dearomatization of diesel[J]. AIChE J, 2002, 48(1): 126-135
[15] Rodriguez M A, Ancheyta J. Modeling of hydrodesulfurization (HDS), hydrodenitrogenation (HDN), and the hydrogenation of aromatics (HAD) in a vacuum gas oil hydrotreater[J]. Energy & Fuels, 2004, 18(3): 789-794
[16] Bao Hongzhou, Fang Xiangchen, Liu Jihua, et al. Advance in kinetics model of diesel hydrodearomatization reaction[J]. Chemical Industry and Engineering Progress, 2011, 30(5): 948-952 (in Chinese)
[17] Li Dadong. Hydrotreating Process and Engineering [M]. Beijing: China Petrochemical Press, 2004: 676-679 (in Chinese)
[18] Zhang Ning. Dynamic mathematical models for residue hydrotreating[J]. Petroleum Refinery Engineering, 2001, 31(6): 52-55 (in Chinese)
[19] Huang Huajiang. Practical Computer Simulation of Chemical Process [M]. Beijing: Chemical Industry Press, 2004: 219-246 (in Chinese)
date: 2015-02-02; Accepted date: 2015-04-07.
Profeesor Weng Huixin, Telephone: +86-21-64252816; E-mail: hxweng@ecust.edu.cn.
杂志排行
中国炼油与石油化工的其它文章
- A Highly Efficient and Selective Water-Soluble Bimetallic Catalyst for Hydrogenation of Chloronitrobenzene to Chloroaniline
- Development of RSDS-III Technology for Ultra-Low-Sulfur Gasoline Production
- Effects of Fe2+, Co2+and Ni2+Ions on Biological Methane Production from Residual Heavy Oil
- Pyrolysis Characteristics and Kinetics of Methyl Oleate Based on TG-FTIR Method
- A Novel Thermally Coupled Reactive Distillation Column for the Hydrolysis of Methyl Acetate
- Synthesis of Waterborne Polyurethane Modified by Nano-SiO2Silicone and Properties of the WPU Coated RDX