SsPmp震相地壳探测方法
2015-03-07刘震田小波朱高华梁晓峰段耀晖张洪双滕吉文
刘震, 田小波, 朱高华,2, 梁晓峰, 段耀晖, 张洪双, 滕吉文
1 中国科学院地质与地球物理研究所, 北京 100029 2 中国科学院大学, 北京 100049 3 中国地质科学院地质研究所, 北京 100037
SsPmp震相地壳探测方法
刘震1,2, 田小波1, 朱高华1,2, 梁晓峰1, 段耀晖1,2, 张洪双3, 滕吉文1
1 中国科学院地质与地球物理研究所, 北京 100029 2 中国科学院大学, 北京 100049 3 中国地质科学院地质研究所, 北京 100037
SsPmp波是远震S波经地表反射转换的P波在莫霍面发生反射后被地表台站接收得到的震相.震中距在30°~50°之间的远震S波震相经地表反射转换的P波射线参数较大,在莫霍面发生全反射,使得台站接收的SsPmp波具有较强的能量,能够从地震记录中清楚地识别出来,为探测台站附近的莫霍面形态提供新的途径.本文通过合成理论地震图分析了SsPmp震相与地壳厚度、射线参数和Pn波速度之间的关系.结果表明:对于水平界面,地壳厚度只影响SsPmp与Ss波之间的相对到时差;Pn波速度只影响SsPmp的相位;射线参数既对SsPmp波的相对到时有影响,也会引起SsPmp波的相位变化.对于复杂的界面,SsPmp反映的深度与速度梯度最大的深度接近,而反映的Pn波速度与实际的Pn波速度一致.
虚拟震源地震测深; 全反射; 地壳厚度; 莫霍面; Pn波速度
1 引言
莫霍面是地球内部重要的间断面之一,其形态可直接反映地壳的构造变形和构造环境.稳定的克拉通地区的莫霍面较为平滑,地壳厚度接近全球大陆平均地壳厚度(30~40 km)(Cawood et al., 2013;Zhang et al., 2011b;Teng et al., 2013, 2014;Zeng et al., 1995),例如我国的鄂尔多斯高原(李英康等,2014;徐树斌等,2013)和四川盆地(李志伟等,2011;楼海等,2008);挤压造山带地区的莫霍面起伏较剧烈,地壳厚度通常较大,例如青藏高原及其周边地区受印度-欧亚板块汇聚的影响,莫霍面深度从周边盆地的40~50 km(Sinha,1987;Tapponnier et al.,2001;管烨等,2001;李志伟等,2011;楼海等,2008)急剧加深到高原地区的60~80 km(Zhang et al., 2011a;Gao et al., 2013;Shi et al., 2009;Xu et al., 2010;丁志峰等,1999;孙长青等,2013;赵金仁等,2005;李永华等,2006;卢占武等,2006);相反,拉张环境地区的莫霍面相对较浅,例如我国东部地区,地壳厚度只有30~40 km(Li et al., 2013;Zhang et al., 2014a;嘉世旭和张先康,2005;罗艳等,2008;郭震等,2012;葛粲等,2011;叶卓等,2013;危自根和陈凌,2012).因此,通过研究莫霍面形态和地壳厚度有助于理解研究区域的构造环境,并为深部精细探测提供约束.
深地震测深一般使用炸药作为爆炸源激发地震波(Zhang et al.,2013;高锐等,2002;徐涛等,2014;白志明和王椿镛,2006),可以事先知道爆破的准确时间和位置,避免了震源误差造成的影响,并且可以根据需要选择观测地点,所以可以得到精度很高的走时曲线和地壳结构信息,但是深埋在地下的爆炸不但成本高,而且会对地表造成破坏.Tseng等(2009),Yu等(2012,2013),Chen等(2013)利用震中距在30°~50°之间的天然地震S波震相在地表激发的下行P波在莫霍面反射的震相(记为SsPmp),得出了青藏高原、华北以及鄂尔多斯地区的地壳厚度.这些成功的应用实例表明SsPmp震相能量大,且无需炸药作为爆炸源,避免了对地表生态环境的破坏,因此,可以用于探测地壳厚度.
该方法利用S波在地表激发的P波探测地壳厚度,激发点类似于人工源炮点,故称为虚拟震源地震测深(Virtual Deep Seismic Sounding,简称VDSS).
2 基本原理
利用SsPmp震相探测地壳厚度的原理如图1所示.
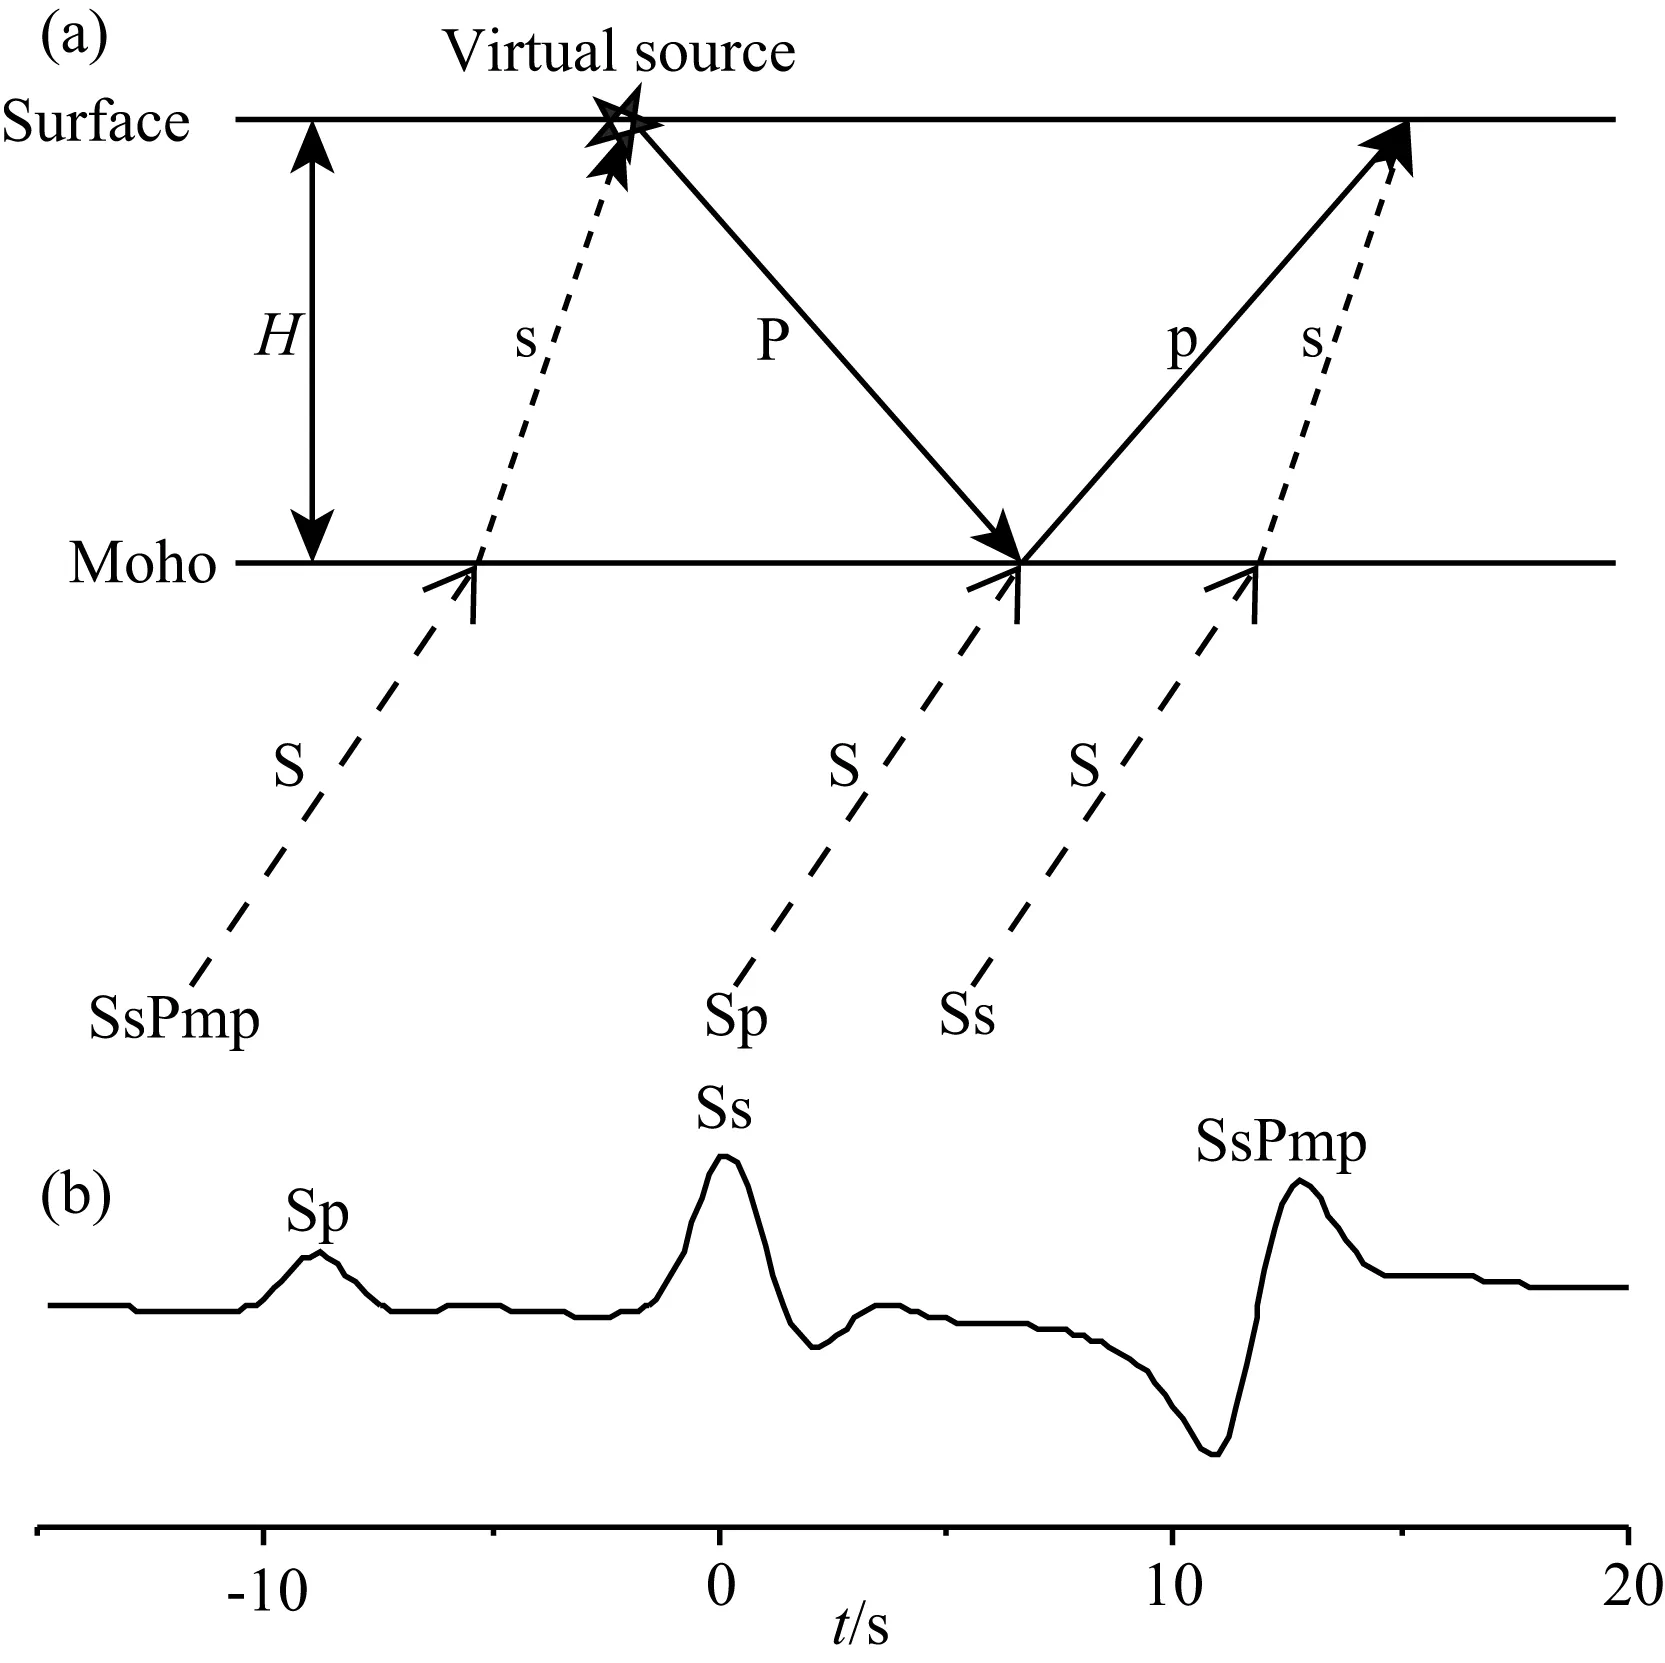
图1 虚拟震源地震测深方法原理示意图(a)为Ss、Sp、SsPmp震相路径示意图; (b)表示在给定模型下(地壳厚度60 km,地壳内P波速度为6.2 km·s-1,Pn波速度为8.1 km·s-1,射线参数0.13 s·km-1)Ss、Sp、SsPmp震相到时之间的关系.Fig.1 A diagram shows the principle of virtual deep seismic soundingFig. (a) shows the paths of Ss, Sp and SsPmp; (b) A seismogram synthesized through a certain model shows the relationship of the arrival time among the different phases (Model parameter: the crustal thickness of 60 km, the velocity of P wave in the crust is 6.2 km·s-1, the uppermost mantle velocity is 8.1 km·s-1, the ray parameter is 0.13 s·km-1).
为了研究上述参数对SsPmp震相到时和振幅的影响,通过合成不同地壳结构参数下的理论地震图(HerrmannandWang, 1985)研究不同参数变化对SsPmp震相的影响.
3 SsPmp随地壳速度模型的变化
3.1 SsPmp震相与射线参数的关系
如图2所示,图2a给出了合成理论地震图用到的速度模型,地壳厚度为60 km,地壳内P波速度为6.2 km·s-1,Pn波速度为8.1 km·s-1.图2b是根据图2a中的速度模型在不同射线参数情况下S波从下向上穿过莫霍面正演得到的地震波垂向分量与Ss子波反褶积后(Ammon et al., 1990;Ammon, 1991)的波形.图2c给出了SsPmp在不同射线参数下波峰波谷与S波到时差的关系.图2d是SsPmp震相波峰、波谷振幅以及峰谷差与射线参数的关系.射线参数在0.124 s·km-1时下行P波在莫霍面发生全反射,可以看出,随着射线参数的增大,SsPmp震相与直达Ss波震相之间的到时差不断减小;射线参数较大时波峰的到时更接近理论到时,而射线参数较小时,波谷的到时和理论到时比较接近;在达到全反射之前,波谷振幅随着射线参数增大而增大,没有出现波峰,当射线参数增大到全反射后,波形会出现波峰,并且波峰逐渐增大,波谷有所减小.可见,超临界角反射产生的相位差是导致波形出现变化的原因(Zhang et al.,2012).
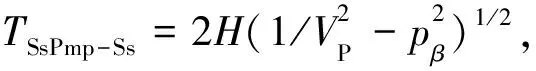
相位变化引起波形变化的原理如图3所示:图3a为一系列单一频率的余弦函数,在零相位时合成图3b所示的波形信号.图3c是波形发生不同的相移之后叠加产生的波形,可以看出,在信号发生超前和滞后半个周期的变化会导致波形翻转;在测试的射线参数范围内,地震波信号大约有半个周期的相移.
3.2 SsPmp震相与地壳厚度的关系
图4给出了SsPmp震相与地壳厚度的关系:分别对三个不同的射线参数(0.11 s·km-1,蓝线;0.13 s·km-1,黑线;0.15 s·km-1,红线)进行理论合成地震图.地壳厚度(图4a)从60 km增厚到85 km,地壳P波速度为6.2 km·s-1,Pn速度为8.1 km·s-1.随着地壳厚度的不断增厚,SsPmp与Ss的到时差不断增大,但是波形不会发生明显的变化.图4b给出了射线参数为0.13 s·km-1情况下,不同地壳厚度引起的波形变化.图4c给出了三个射线参数下波峰波谷到时与理论到时随地壳厚度变化的关系.图4d给出了三个射线参数下波峰波谷的振幅以及峰谷差随地壳厚度变化的关系.由此可见,SsPmp与Ss震相之间的到时差随着地壳增厚而增大,但地壳厚度的变化基本不会引起SsPmp的波形变化.
3.3 SsPmp震相与Pn波速度的关系
图5所示为Pn波速度对SsPmp的影响.本测试中使用的速度模型如图5a所示,地壳厚度为60 km,地壳内P波速度为6.2 km·s-1,Pn波速度从7.5 km·s-1增加到9.0 km·s-1.同样进行了同图4中测试相同的三种射线参数情况的理论合成.

图2 SsPmp随射线参数变化特点(a)表示合成理论地震图用到的速度模型:地壳厚度60 km,地壳内P波速度为6.2 km·s-1,Pn波速度为8.1 km·s-1; (b) 根据图(a)中的速度模型在不同射线参数情况下S波从下向上穿过莫霍面正演得到的地震波垂向分量与子波反褶积后的波形; (c) 给出了SsPmp在不同射线参数下波峰波谷与S波到时差的关系.实线为理论模型计算的结果,点线为SsPmp波谷到时,虚线为波峰到时; (d) SsPmp震相波峰、波谷振幅以及峰谷差与射线参数的关系,虚线表示波峰,点线表示波谷,实线为峰谷差.Fig.2 The relationship between the ray parameter and SsPmp(a) shows the velocity model used to synthesize seismogram. The crustal thickness is 60 km, the velocity of P wave in the crust is 6.2 km·s-1, the uppermost mantle velocity is 8.1 km·s-1; (b) The waveform shows in is synthesized from the model showed in figure (a), and the ray parameter is increased from 0.11 s·km-1 to 0.15 s·km-1; (c) shows the variation of the arrival time of the peak and trough with the ray parameter, the dashed line denote the arrival time of peak, the dotted line denote the arrival time of trough, the solid line denote the arrival of the SsPmp phase; (d) shows the variation of the amplitude of the peak, trough and peak-trough difference with the ray parameter, the dashed line denote the amplitude of peak, the dotted line denote the amplitude of trough, the solid line denote the peak-trough difference.
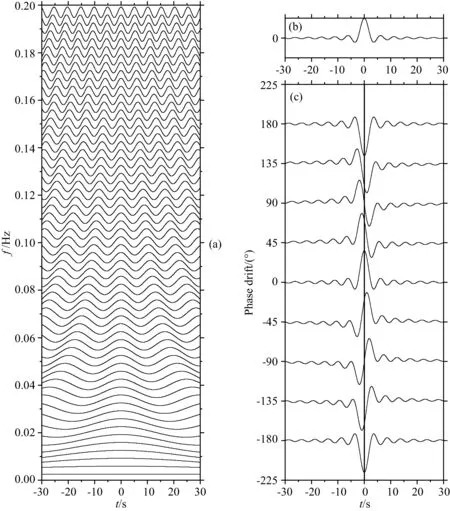
图3 地震波形出现相位差之后波形的改变(a) 表示一系列单一频率的余弦信号; (b) 所示波形为(a)中的单一频率的波形零相移叠加而成;(c) 表示当(a)中的单一频率的余弦信号发生了一定周期的相位变化叠加后波形发生变化的结果.Fig.3 The phase shift will cause the waveform transform(a) shows a list of single frequency waveform, which can form the waveform showed; (b) The phase shift of each frequency increase from -180° to 180° ; (c) The transformation of the waveform was show.

图4 SsPmp震相与地壳厚度的关系(a)表示合成理论地震图用到的速度模型:地壳厚度从60 km增厚到85 km,地壳P波速度为6.2 km·s-1,Pn速度为8.1 km·s-1; (b) 根据图(a)中的速度模型在射线参数为0.13 s·km-1的情况下,不同地壳厚度情况下S波从下向上穿过莫霍面正演得到的地震波垂向分量与子波反褶积后的波形; (c) SsPmp在不同地壳厚度下波峰波谷与S波到时差的关系.实线为理论模型计算的结果,点线为SsPmp波谷到时,虚线为波峰到时; (d) SsPmp震相波峰、波谷振幅以及峰谷差与地壳厚度的关系,虚线表示波峰,点线表示波谷,实线为峰谷差.蓝线,0.11 s·km-1;黑线,0.13 s·km-1;红线,0.15 s·km-1.Fig.4 The relationship between the crustal thickness and SsPmp(a) shows the velocity model used to synthesize seismogram. The crustal thickness is from 60 km to 85 km, the velocity of P wave in the crust is 6.2 km·s-1, the uppermost mantle velocity is 8.1 km·s-1; (b) The waveform shows is synthesized from the model showed in figure (a), and the crustal thickness is increased from 60 km to 85 km, the ray parameter is 0.13 s·km-1; (c) shows the change of the arrival time of the peak and trough with the crustal thickness, the dashed line denote the arrival time of peak, the dotted line denote the arrival time of trough, the solid line denote the arrival of the SsPmp phase; (d) shows the variation of the amplitude of the peak, trough and peak-trough difference with the crustal thickness, the dashed line denote the amplitude of peak, the dotted line denote the amplitude of trough, the solid line denote the peak-trough difference. The red line denote the ray parameter is fixed at 0.15 s·km-1, the black line denote the ray parameter is fixed at 0.13 s·km-1, the blue line denote the ray parameter is fixed at 0.11 s·km-1.

图5 SsPmp震相与Pn波速度的关系(a)表示合成理论地震图用到的速度模型:Pn波速度从7.5 km·s-1增大到9.0 km·s-1,地壳P波速度为6.2 km·s-1; (b) 根据图(a)中的速度模型在射线参数为0.13 s·km-1,地壳厚度为60 km时,不同Pn波速度情况下S波从下向上穿过莫霍面正演得到的地震波垂向分量与子波反褶积后的波形; (c) SsPmp在不同Pn波速度下波峰波谷与S波到时差的关系.实线为理论模型计算的结果,点线为SsPmp波谷到时,虚线为波峰到时; (d) SsPmp震相波峰、波谷振幅以及峰谷差与Pn波速度的关系,虚线表示波峰,点线表示波谷,实线为峰谷差.蓝线,0.11 s·km-1;黑线,0.13 s·km-1;红线,0.15 s·km-1.Fig.5 The relationship between the P wave velocity at the uppermost mantle and SsPmp(a) shows the velocity model used to synthesize seismogram. The crustal thickness is from 60 km, the velocity of P wave in the crust is 6.2 km·s-1, the uppermost mantle velocity is increased from 7.5 km·s-1 to 9.0 km·s-1; (b) The waveform shows is synthesized from the model showed in figure (a), and the uppermost mantle velocity is increased from 7.5 km·s-1 to 9.0 km·s-1, the ray parameter is 0.13 s·km-1; (c) shows the change of the arrival time of the peak and trough with the uppermost mantle velocity, the dashed line denote the arrival time of peak, the dotted line denote the arrival time of trough, the solid line denote the arrival of the SsPmp phase; (d) shows the variation of the amplitude of the peak, trough and peak-trough difference with the upper mantle velocity, the dashed line denote the amplitude of peak, the dotted line denote the amplitude of trough, the solid line denote the peak-trough difference. The red line denote the ray parameter is fixed at 0.15 s·km-1, the black line denote the ray parameter is fixed at 0.13 s·km-1, the blue line denote the ray parameter is fixed at 0.11 s·km-1.

图6 IASP91模型下的S波走时曲线Fig.6 S wave travel time curve calculate by IASP91 model

图7 震源深度10 km根据IASP91模型合成理论地震图(a) 截取垂向分量与S子波信号反褶积的结果; (b) 径向分量; (c) 垂向分量.Fig.7 A seismogram synthesized by IASP91 model, and the source depth is 10 km(a) The waveform shown is the result which is deconvolution of the vertical component and S wavelet; (b) The waveform shown is radial component; (c) The waveform shown is vertical component.
图5b给出了射线参数为0.13 s·km-1情况下,使用不同Pn波速度时的波形变化.可以看出,Pn波速度的变化不会影响SsPmp与Ss之间的到时差(图5c),而对波形影响较大(图5b、图5d),推测可能是反射导致的相位差对Pn波速度改变比较敏感.当射线参数为0.11 s·km-1时,下行P波在莫霍面的入射角小于临界角,没有发生全反射,所以,从波形上看,SsPmp几乎没有出现波峰,而波谷振幅随着射线参数增大而不断增大.射线参数为0.13 s·km-1时,Pn波速度从小到大的变化会使下行P波临界角减小,从而发生全反射,出现波峰,并且不断增大;而波谷在经过临界角以后逐渐减小.当射线参数为0.15 s·km-1时,入射角远大于临界角,波形不再有明显的变化.
4 VDSS方法的适用条件
本文根据IASP91模型计算了S波的走时曲线(震源深度10 km)(Crotwell et al., 1999;Winchester and Crotwell, 1999),如图6所示:S波在15°~30°之间因为受地幔过渡带的影响出现了S波三岔震相.这一震中距范围内的S波震相识别容易发生相互混淆,所以应用VDSS方法只能选取震中距大于30°的地震事件.而震中距越大,射线入射角越小,所以太大的震中距会导致SsPmp无法在莫霍面达到全反射,这一最大震中距大约在50°,如图7所示.
我们利用IASP91模型(Kennett and Engdahl, 1991)合成理论地震图(参考了Wang(1999)提供的程序),以震源深度10 km为例,如图7所示.图7a、7b、7c依次为截取垂向分量与S子波信号反褶积的结果(Yu et al., 2013)、径向分量和垂向分量.因为P波的振动方向与传播方向一致,所以垂向分量在理论到时附近发现一个明显的波峰,而径向分量没有.反褶积之后的结果同样显示在理论到时之后出现一个波峰.震中距在50°以外,到时差延迟随着震中距的变化明显变快,经过分析,由于这时的射线参数不足以使转换P波在莫霍面发生全反射,这是震中距较小的位置发生全反射后产生Pn波的震相,即SsPnp(图7中黑线为理论计算震相到时差,55°以外根据SsPnp路径计算的到时差).
综上所述,可以通过对震中距在30°~50°之间的远震S波波形中Ss和SsPmp震相的识别探测地壳厚度.
5 复杂地壳结构对虚拟震源地震测深(VDSS)的影响
接收函数利用界面产生的Ps转换波与直达P波进行反褶积计算可以得到界面信息(刘启元和邵学钟,1985;吴庆举等,2007;徐强和赵俊猛,2008).接收函数对速度界面反应敏感,是探测深部速度界面的有效方法.但是通常莫霍面不是一个简单的速度跃变(Meissner, 1973),而是缓慢变化的一个具有一定厚度的层,因此,接收函数中多出现复杂的莫霍面转换震相(Tian et al., 2011;Xu et al., 2014;Zheng et al., 2006;吴庆举和曾融生,1998;司少坤等,2012).针对复杂的莫霍面结构,本文做了如下方面的研究,并与接收函数的结果作了比较.
图8展示了同时存在速度界面和速度渐变层模型SsPmp震相与简单速度界面合成地震图的拟合情况.地壳内速度为6.2 km·s-1,Pn波速度为8.2 km·s-1,射线参数为0.125 s·km-1.存在速度变化的层厚度分别为5 km,10 km,15 km.模型1速度从6.2 km·s-1连续变化到8.2 km·s-1,模型2在速度渐变层的上面存在一个1 km·s-1的速度突变,模型3在速度渐变层下存在一个1 km·s-1的速度突变.与单一速度跃变模型合成波形的拟合结果表明,所获得的深度更接近模型速度出现跃变的深度,约等于速度变化量对深度的加权平均,而波形对应的Pn波速度更接近上地幔顶部的Pn波速度.
如图9所示:地壳速度为6.2 km·s-1,Pn速度为8.2 km·s-1,合成入射S波射线参数为0.125 s·km-1和入射P波射线参数为0.06 s·km-1.模型1为50 km深以下有10 km连续变化的速度渐变层,速度从6.2 km·s-1逐渐增大到8.2 km·s-1,模型2在50~60 km深度之间给定均匀速度7.2 km·s-1.
图9中每个速度模型的右侧给出了理论合成的接收函数(红线)和虚拟震源地震测深(蓝线)的波形,黑色虚线是利用单层地壳模型进行波形拟合的结果.可以看出,对于接收函数来说,速度界面缓慢变化会使波形变宽,振幅减小,分辨率被降低,如图9a所示.在实践中,当接收函数中出现两个到时比较接近的波峰时,很难判断哪一个指示的是莫霍面,如图9b会出现两个Ps转换波震相.接收函数得到的界面深度分别为:模型1:56 km;模型2:51 km和60 km.而虚拟震源地震测深在两种形式的模型下都只出现一个震相,且振幅较大,容易识别,波形拟合的结果显示,与模型1拟合较好的简单模型为地壳厚度55 km,波形对应的Pn速度均为8.2 km·s-1.与模型2拟合较好的简单模型为地壳厚度59 km,波形对应的Pn波速度为8.2 km·s-1.由此可见,接收函数对莫霍面以外的界面同样有响应,并且受到莫霍面形态的影响;而虚拟震源地震测深方法基本不受壳内结构和莫霍面形态的影响,能简单清楚地识别莫霍面震相.
6 实际数据对比
我们对比了接收函数和虚拟震源地震测深两种方法在实际应用中探测的地壳厚度结果.假设地壳厚度大约为40 km左右,SsPmp波(射线参数0.125~0.14 s·km-1)在莫霍面的反射点分布在距离台站50~80 km范围内,而接收函数P-S波(射线参数0.04~0.08 s·km-1)转换点位于台站正下方15 km以内.延安台(YAAN)周围地势平坦,降低了莫霍面横向变化对两种方法探测结果的影响.所以我们利用延安台2007—2009两年的宽频带天然地震数据,分别用两种方法探测该地区地壳厚度,如图10所示.图10a展示了筛选得到的82条质量较好的接收函数,通过深度-速度比(H-K)扫描方法(地壳P波平均速度6.3 km·s-1)得到该台站附近地壳厚度为44±1.17 km(速度比为1.74±0.031),图10a红线给出Pms、PpPms以及PsPms+PpSms理论到时.图10c为筛选得到13条SsPmp震相清晰的地震事件波形,黑线为实际数据波形,射线参数(RP)范围从0.1292~0.14 s·km-1,反方位角(BAZ)分布在150°~281°,莫霍面反射点的Pn波速度VPn约为8.1 km·s-1(Pei et al., 2007);灰线为理论合成波形(地壳P波平均速度6.3 km·s-1),地壳厚度(H)在43~45 km.两种方法结果比较接近,证明了虚拟震源地震测深方法的可行性.
7 结论
综上所述,可以利用震中距在30°~50°之间的远震S波转换的SsPmp震相探测地壳厚度.该震相的到时差及波形主要受到射线参数、地壳厚度、地壳平均P波速度以及Pn波速度等因素的影响.经过分析合成理论地震图可以得出以下几点结论:
(1) 地壳厚度的改变只影响SsPmp与Ss震相之间的到时差,与SsPmp的相位差无关,地壳厚度增厚,SsPmp延迟Ss到达的时间越长,SsPmp震相波形不会发生改变;
(2) Pn波速度的变化只影响SsPmp的相位,与SsPmp和Ss震相之间的到时差无关,Pn波速度增大,SsPmp在莫霍面的临界角减小,导致SsPmp震相在莫霍面发生全反射,波形发生改变,波形从只有一个波谷逐渐出现波峰;
(3) 射线参数既影响SsPmp与Ss之间的到时差还会影响SsPmp的相位,射线参数增大,SsPmp延迟Ss到达的时间越短,SsPmp相位在超过临界角后发生相移,SsPmp震相的波形随之改变,波形从只有一个波谷逐渐出现波峰;
(4) 对于复杂的地壳模型,虚拟震源地震测深方法拟合得到的Pn波速度接近真实的Pn波速度,深度与速度梯度最大的深度相近,并且基本不受壳内界面的影响.
Ammon C J, Randall G E, Zandt G.1990. On the nonuniqueness of receiver function inversions.JournalofGeophysicalResearch,95(B10): 15303-15318.
Ammon C J.1991. The isolation of receiver effects from teleseismic P waveforms.BulletinoftheSeismologicalSocietyofAmerica,81(6): 2504-2510.
Cawood P A, Hawkesworth C J, Dhuime B.2013. The continental record and the generation of continental crust.GSABulletin,125(1-2): 14-32.
Chen W P, Yu C Q, Tseng T L, et al. 2013. Moho, seismogenesis, and rheology of the lithosphere.Tectonophysics,609: 491-503.
Crotwell H P, Owens T J, Ritsema J.1999. The TauP toolkit: flexible seismic travel-time and ray-path utilities.SeismologicalResearchLetters,70(2): 154-160.
Ding Z F, He Z Q, Sun W G, et al. 1999. 3-D crust and upper
图8 复杂的速度渐变界面对SsPmp的影响Fig.8 The influence of complex velocity gradient discontinuityon SsPmp
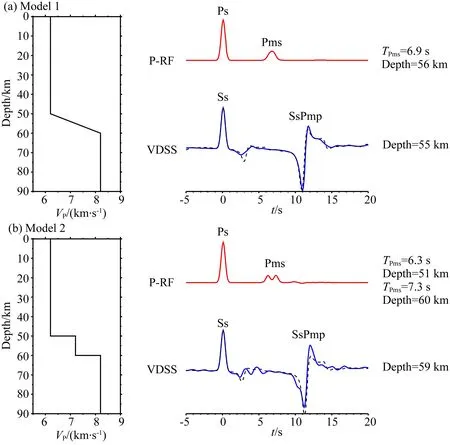
图9 SsPmp对不同界面的反应与P波接收函数的比较Fig.9 Different responses to various discontinuities between SsPmp and P wave receiver function

图10 (a) YAAN台筛选得到的质量较好的接收函数,Pms、PpPms以及PsPms+PpSmS理论到时如红线所示; (b) H-K扫描所得到的结果,地壳厚度为44±1.17 km(速度比为1.74±0.031); (c) 筛选得到的SsPmp震相清晰的事件,射线后分别给出了射线参数(RP)、地壳厚度(H)、Pn波速度(VPn)和反方位角的结果(BAZ)Fig.10 Receiver functions of YAAN station are shown in figure (a). The red lines denote the arrival time of Pms, PpPms and PsPms+PpSmS. (b) The H-K scan result shows that the crustal thickness is about 44±1.17 km (VP/VS is 1.74±0.031). The ray parameter, crustal thickness, velocity of upper most mantle and back azimuth are followed the waveform of SsPmp we select in figure (c).
mantle velocity structure in eastern Tibetan plateau and its surrounding areas.ChineseJournalofGeophysics(in Chinese), 42(2): 197-205. Gao R, Chen C, Lu Z W, et al. 2013. New constraints on crustal structure and Moho topography in Central Tibet revealed by SinoProbe deep seismic reflection profiling.Tectonophysics,606: 160-170.
Gao R, Xiao X C, Kao H, et al. 2002. Summary of deep seismic probing of the lithospheric structure across the West Kunlun-Tarim-Tianshan.GeologicalBulletinofChina(in Chinese), 21(1): 11-18.
Ge C, Zheng Y, Xiong X. 2011. Study of crustal thickness and Poisson ratio of the North China Craton.ChineseJournalofGeophysics(in Chinese), 54(10): 2538-2548. Guan Y, Kao H, Gao R, et al. 2001. Broadband seismic observational experiments from Tarim Basin to Kunlun Mountains.ActaGeoscientiaSinica(in Chinese),22(6): 559-562.
Guo Z, Tang Y C, Chen J, et al. 2012. A study on crustal and upper mantle structures in east part of North China Craton using receiver functions.ChineseJournalofGeophysics(in Chinese), 55(11): 3591-3600, doi: 10.6038/j.issn.0001-5733.2012.11.008.
Herrmann R B, Wang C Y.1985. A comparison of synthetic seismograms.BulletinoftheSeismologicalSocietyofAmerica,75(1): 41-56. Jia S X, Zhang X K. 2005. Crustal structure and comparison of different tectonic blocks in North China.ChineseJournalofGeophysics(in Chinese), 48(3): 611-620.
Kennett B L N, Engdahl E R. 1991. Traveltimes for global earthquake location and phase identification.GeophysicalJournalInternational,105(2): 429-465.
Li Q S, Gao R, Wu F T, et al. 2013. Seismic structure in the southeastern China using teleseismic receiver functions.Tectonophysics,606: 24-35.
Li Y H, Tian X B, Wu Q J, et al. 2006. The Poisson ratio and crustal structure of the central Qinghai-Xizang inferred from INDEPTH-III teleseismic waveforms: Geological and geophysical implications.ChineseJournalofGeophysics(in Chinese), 49(4): 1037-1044.Li Y K, Gao R, Mi S X, et al. 2014. The characteristics of crustal velocity structure for Liupan Mountain-Ordos Basin in the Northeastern Margin of Qinghai-Xizang(Tibet) Plateau.GeologicalReview(in Chinese), 60(5): 1147-1157.
Li Z W, Xu Y, Huang R Q, et al. 2011. Crustal P-wave velocity structure of the Longmenshan region and its tectonic implications for 2008 Wenchuan earthquake.ScienceChina:EarthScience(in Chinese), 41(3): 283-290.
Liu Q Y, Shao X Z.1985. Study on the dynamic characteristics of PS converted waves.ChineseJournalofGeophysics(ActaGeophysicaSinica) (in Chinese), 28(3): 291-302.
Lu Z W, Gao R, Li Q S, et al. 2006. Deep geophysical probe and geodynamic study on the Qinghai-Tibet Plateau(1958—2004).ChineseJournalofGeophysics(in Chinese), 49(3): 753-770. Luo Y, Chong J J, Ni S D, et al. 2008. Moho depth and sedimentary thickness in Capital region.ChineseJournalofGeophysics(in Chinese), 51(4): 1135-1145.
Meissner R.1973. The ‘Moho’ as a transition zone.GeophysicalSurveys,1(2): 195-216.
Pei S P, Zhao J M, Sun Y S, et al. 2007. Upper mantle seismic velocities and anisotropy in China determined through Pn and Sn tomography.JournalofGeophysicalResearch,112(B5): B05312.
Shi D N, Shen Y, Zhao W J, et al. 2009. Seismic evidence for a Moho offset and south-directed thrust at the easternmost Qaidam-Kunlun boundary in the Northeast Tibetan plateau.EarthandPlanetaryScienceLetters,288(1-2): 329-334.
Si S K, Tian X B, Zhang H S, et al. 2012. Prevalent thickening and local thinning of the mantle transition zone beneath the Baikal rift zone and its dynamic implications.ScienceChina:EarthSciences(in Chinese),42(11): 1647-1659.
Si X, Teng J W, Ma X Y, et al. 2014. Detection of crust and mantle structures and distinguish of the anomaly body with artificial source deep seismic profiling.ProgressinGeophysics(in Chinese), 29(2): 560-572, doi: 10.6038/pg20140212.
Sinha A K.1987. Tectonic zonation of the Central Himalaya and the crustal evolution of collision and compressional belts.Tectonophysics,134(1-3): 59-74.Sun C Q, Lei J S, Li C, et al. 2013. Crustal anisotropy beneath the Yunnan region and dynamic implications.ChineseJournalofGeophysics(in Chinese), 56(12): 4095-4105, doi: 10.6038/cjg20131214.
Tapponnier P, Xu Z Q, Roger F, et al. 2001. Oblique stepwise rise and growth of the Tibet plateau.Science,294(5547): 1671-1677.
Teng J W, Deng Y F, Badal J, et al. 2014. Moho depth, seismicity and seismogenic structure in China mainland.Tectonophysics,627: 108-121.
Teng J W, Zhang Z J, Zhang X K, et al. 2013. Investigation of the Moho discontinuity beneath the Chinese mainland using deep seismic sounding profiles.Tectonophysics,609: 202-216.
Tian X B, Teng J W, Zhang H S, et al. 2011. Structure of crust and upper mantle beneath the Ordos Block and the Yinshan Mountains revealed by receiver function analysis.PhysicsoftheEarthandPlanetaryInteriors,184(3-4): 186-193.
Tseng T L, Chen W P, Nowack R L, et al. 2009. Northward thinning of Tibetan crust revealed by virtual seismic profiles.GeophysicalResearchLetters,36(24): L24304.
Wang R J. 1999. A simple orthonormalization method for stable and efficient computation of Green′s functions.BulletinoftheSeismologicalSocietyofAmerica,89(3): 733-741.
Wei Z G, Chen L.2012. Regional differences in crustal structure beneath northeastern China and northern North China Craton: constraints from crustal thickness andVP/VSratio.ChineseJournalofGeophysics(in Chinese), 55(11): 3601-3614, doi: 10.6038/j.issn.0001-5733.2012.11.009.
Winchester J, Crotwell P. 1999. WebWEED and TauP: Java and Seismology.SeismologicalResearchLetters,70(1): 80-84.
Wu Q J, Li Y H, Zhang R Q, et al. 2007. Receiver function estimated by multi-channel deconvolution.ChineseJournalofGeophysics(in Chinese), 50(3): 791-796.
Wu Q J, Zeng R S.1998. The crustal structure of Qinghai-Xizang Plateau inferred from broadband teleseismic waveform.ChineseJournalofGeophysics(ActaGeophysicaSinica)(in Chinese), 41(5): 669-679.
Xu Q, Zhao J M.2008. A review of the receiver function method.ProgressinGeophysics(in Chinese), 23(6): 1709-1716.
Xu Q, Zhao J M, Cui Z X, et al. 2010. Moho offset beneath the central Bangong-Nujiang suture of Tibetan Plateau.ChineseScienceBulletin,55(7): 607-613.
Xu S B, Mi N, Xu M J, et al. 2014. Crustal structures of the Weihe graben and its surroundings from receiver functions.ScienceChina:EarthSciences,57(2): 372-378.
Xu T, Wu Z B, Zhang Z J, et al. 2014. Crustal structure across the Kunlun fault from passive source seismic profiling in East Tibet.Tectonophysics,627: 98-107.
Xu T, Zhang Z J, Tian X B, et al. 2014. Crustal structure beneath the Middle-Lower Yangtze metallogenic belt and its surrounding areas: Constraints from active source seismic experiment along the Lixin to Yixing profile in East China.ActaPetrologicaSinica(in Chinese),30(4): 918-930.
Ye Z, Li Q S, Gao R, et al. 2013. Seismic receiver functions revealing crust and upper mantle structure beneath the continental margin of southeastern China.ChineseJournalofGeophysics(in Chinese), 56(9): 2947-2958, doi: 10.6038/cjg20130909.
Yu C Q, Chen W P, van der Hilst R D. 2013. Removing source-side scattering for virtual deep seismic sounding(VDSS).GeophysicalJournalInternational,195(3): 1932-1941.Yu C Q, Chen W P, Ning J Y, et al. 2012. Thick crust beneath the Ordos plateau: Implications for instability of the North China craton.EarthandPlanetaryScienceLetters,357-358: 366-375. Zeng R S, Sun W G, Mao T E, et al. 1995. The depth of Moho in the mainland of China.ActaSeismologicaSinica,8(3): 399-404. Zhang R Q, Wu Q J, Sun L, et al. 2014a. Crustal and lithospheric structure of Northeast China from S-wave receiver functions.EarthandPlanetaryScienceLetters,401: 196-205. Zhang X Y, Zhang Z J, Xu T, et al. 2012. Phase shift approximation for the post-critical seismic wave.JournalofGeophysicsandEngineering,9(5): 482-493.
Zhang Z J, Bai Z M, Klemperer S L, et al. 2013. Crustal structure across northeastern Tibet from wide-angle seismic profiling: Constraints on the Caledonian Qilian orogeny and its reactivation.Tectonophysics,606: 140-159. Zhang Z J, Deng Y F, Teng J W, et al. 2011a. An overview of the crustal structure of the Tibetan plateau after 35 years of deep seismic soundings.JournalofAsianEarthSciences,40(4): 977-989.
Zhang Z J, Yang L Q, Teng J W, et al. 2011b. An overview of the earth crust under China.Earth-ScienceReviews,104(1-3): 143-166.
Zhang Z J, Wang Y H, Houseman G A, et al. 2014b. The Moho beneath western Tibet: Shear zones and eclogitization in the lower crust.EarthandPlanetaryScienceLetters,408: 370-377.
Zhao J R, Li S L, Zhang X K, et al. 2005. Three dimensional Moho geometry at northeast edge of Qinghai-Tibet Plateau.ChineseJournalofGeophysics(in Chinese), 48(1): 78-85.
Zheng T Y, Chen L, Zhao L, et al. 2006. Crust-mantle structure difference across the gravity gradient zone in North China Craton: Seismic image of the thinned continental crust.PhysicsoftheEarthandPlanetaryInteriors,159(1-2): 43-58.
附中文参考文献
白志明, 王椿镛. 2006. 下扬子地壳P波速度结构: 符离集—奉贤地震测深剖面再解释. 科学通报, 51(21): 2534-2541.
丁志峰, 何正勤, 孙为国等.1999. 青藏高原东部及其边缘地区的地壳上地幔三维速度结构.地球物理学报, 42(2): 197-205.
高锐, 肖序常, 高弘等.2002. 西昆仑—塔里木—天山岩石圈深地震探测综述. 地质通报,21(1): 11-18.
葛粲, 郑勇, 熊熊.2011. 华北地区地壳厚度与泊松比研究. 地球物理学报,54(10): 2538-2548.
管烨, 高弘, 高锐等.2001. 新疆塔里木—西昆仑宽频地震观测实验研究. 地球学报,22(6): 559-562.
郭震, 唐有彩, 陈永顺等.2012. 华北克拉通东部地壳和上地幔结构的接收函数研究. 地球物理学报,55(11): 3591-3600, doi: 10.6038/j.issn.0001-5733.2012.11.008.
嘉世旭, 张先康.2005. 华北不同构造块体地壳结构及其对比研究. 地球物理学报,48(3): 611-620.
李永华, 田小波, 吴庆举等.2006. 青藏高原INDEPTH-III剖面地壳厚度与泊松比: 地质与地球物理含义. 地球物理学报,49(4): 1037-1044.
李英康, 高锐, 米胜信等. 2014. 青藏高原东北缘六盘山—鄂尔多斯盆地的地壳速度结构特征. 地质评论,60(5): 1147-1157.
李志伟, 胥颐, 黄润秋等.2011. 龙门山地区的P波速度结构与汶川地震的深部构造特征. 中国科学: 地球科学,41(3): 283-290.
刘启元, 邵学钟.1985. 天然地震PS转换波动力学特征的初步研究. 地球物理学报,28(3): 291-302.
楼海, 王椿镛, 吕智勇等. 2008. 2008年汶川Ms8.0级地震的深部构造环境——远震P波接收函数和布格重力异常的联合解释. 中国科学: 地球科学, 38(10): 1207-1220.
卢占武, 高锐, 李秋生等.2006. 中国青藏高原深部地球物理探测与地球动力学研究(1958—2004). 地球物理学报,49(3): 753-770.
罗艳, 崇加军, 倪四道等.2008. 首都圈地区莫霍面起伏及沉积层厚度. 地球物理学报,51(4): 1135-1145.
司少坤, 田小波, 张洪双等.2012. 贝加尔裂谷区地幔过渡带大范围增厚与局部减薄现象及其动力学意义. 中国科学: 地球科学,42(11): 1647-1659.
孙长青, 雷建设, 李聪等.2013. 云南地区地壳各向异性及其动力学意义. 地球物理学报,56(12): 4095-4105, doi: 10.6038/cjg20131214.
危自根, 陈凌.2012. 东北地区至华北北缘地壳结构的区域差异: 地壳厚度与波速比的联合约束. 地球物理学报,55(11): 3601-3614, doi: 10.6038/j.issn.0001-5733.2012.11.009.
吴庆举, 李永华, 张瑞青等.2007. 用多道反褶积方法测定台站接收函数. 地球物理学报,50(3): 791-796.
吴庆举, 曾融生.1998. 用宽频带远震接收函数研究青藏高原的地壳结构. 地球物理学报,41(5): 669-679.
徐强, 赵俊猛.2008. 接收函数方法的研究综述. 地球物理学进展,23(6): 1709-1716.
徐树斌, 米宁, 徐鸣洁等.2013. 利用接收函数研究渭河地堑及其周边地壳结构. 中国科学: 地球科学,43(10): 1651-1658.
徐涛, 张忠杰, 田小波等.2014. 长江中下游成矿带及邻区地壳速度结构: 来自利辛—宜兴宽角地震资料的约束. 岩石学报,30(4): 918-930.
叶卓, 李秋生, 高锐等.2013. 中国大陆东南缘地震接收函数与地壳和上地幔结构. 地球物理学报,56(9): 2947-2958, doi: 10.6038/cjg20130909.
赵金仁, 李松林, 张先康等.2005. 青藏高原东北缘莫霍界面的三维空间构造特征. 地球物理学报,48(1): 78-85.
(本文编辑 何燕)
Probing the Moho interface using SsPmp waves
LIU Zhen1,2, TIAN Xiao-Bo1, ZHU Gao-Hua1,2, LIANG Xiao-Feng1, DUAN Yao-Hui1,2, ZHANG Hong-Shuang3, TENG Ji-Wen1
1InstituteofGeologyandGeophysics,ChineseAcademyofSciences,Beijing100029,China2UniversityofChineseAcademyofSciences,Beijing100049,China3InstituteofGeology,ChineseAcademyofGeologicalSciences,Beijing100037,China
The Moho is one of the most important discontinuities in the earth. Its shape is associated with tectonic deformation and evolution of the crust. In orogenic belts, such as the Tibetan plateau, the crustal thickness is about 60~80 km, however, in extensional regions, it is only 30~40 km even less than the average global value.Detecting the depth of the Moho is helpful to understand tectonic environments. The virtual deep seismic sounding (VDSS), a new method to measure the crustal thickness, can detect the Moho robustly. A systematic study of VDSS, however is absent now. In this paper, we use synthetic theoretical seismograms to analyze the seismic phase SsPmp in VDSS and its application in estimation of crustal thickness.Teleseismic S waves convert into P waves at the ground, and these down-going P waves will be reflected by the Moho, so SsPmp waves can be received after Ss phases. The most suitable epicentral distance for this observation is between 30°~50°, in which the waveforms of VDSS is protected from interfering with other seismic phases and the SsPmp becomes a prominent phase. As the ray parameters increase, the down-going P waves can be fully reflected and the energy of SsPmp will become very strong. We analyze the relationship between the delay time and the phase shift of SsPmp and the ray parameter, uppermost mantle velocity and the thickness of the crust by synthetic seismograms. Our study suggests that the crustal thickness can be measured robustly by waveform fitting with a single model even if the Moho is a complex transition layer.The relation between SsPmp phases and the crustal thickness, ray parameter and uppermost mantle velocity (Pn velocity) was analyzed by synthetic waveforms. Differences of crustal thickness only cause the variation in the delay time of the SsPmp phases relative to Ss phases. Different Pn velocities only result in the phase shift of SsPmp variation. As the Pn velocity become faster, the phase shift becomes larger. With the ray parameter increasing, the delay time between SsPmp and Ss decreases, and the phase shift becomes larger.In general, SsPmp can be used to detect the thickness of the crust. This phase is powerful than the Ps used in receiver function. SsPmp, as a full-reflection phase, is strong enough to neglect these reflections and multiples from shallow crustal structure.
Virtual deep seismic sounding; Full reflection; Crustal thickness; Moho; Pn velocity
10.6038/cjg20151012.
Liu Z, Tian X B, Zhu G H,et al. 2015. Probing the Moho interface using SsPmp waves.ChineseJ.Geophys. (in Chinese),58(10):3571-3582,doi:10.6038/cjg20151012.
国家自然科学基金项目(41274066,41340040,41104034)与深部探测技术与实验研究专项SinoProbe-02-02(201311155)共同资助.
刘震,男,1985年生,博士研究生,主要从事地球壳幔结构方面的研究. E-mail: liuzhen@mail.iggcas.ac.cn
10.6038/cjg20151012
P315
2014-12-25,2015-09-16收修定稿
刘震, 田小波, 朱高华等. 2015. SsPmp震相地壳探测方法.地球物理学报,58(10):3571-3582,