Stress corrosion cracking of high-strength AZ31 processed by high-ratio differential speed rolling
2015-02-16ZhimingShiKimFuyongCoMtthewDrgushAndrejAtrens
Zhiming Shi,W.J.Kim,Fuyong Co,Mtthew S.Drgush,Andrej Atrens,*
aMaterials Engineering,School of Mechanical and Mining Engineering,The University of Queensland,Brisbane,Qld 4072,Australia
bCentre for Advanced Materials Processing and Manufacturing(AMPAM),The University of Queensland,Brisbane,Qld 4072,Australia
cDepartment of Materials Science&Engineering,Hongik University,72-1 Mapo-gu,Sangsu-dong,Seoul 121-791,Republic of Korea
Stress corrosion cracking of high-strength AZ31 processed by high-ratio differential speed rolling
Zhiming Shia,b,W.J.Kimc,Fuyong Caoa,Matthew S.Darguschb,Andrej Atrensa,*
aMaterials Engineering,School of Mechanical and Mining Engineering,The University of Queensland,Brisbane,Qld 4072,Australia
bCentre for Advanced Materials Processing and Manufacturing(AMPAM),The University of Queensland,Brisbane,Qld 4072,Australia
cDepartment of Materials Science&Engineering,Hongik University,72-1 Mapo-gu,Sangsu-dong,Seoul 121-791,Republic of Korea
Stress corrosion cracking(SCC)in distilled water was studied for AZ31,processed by differential-speed-rolling to different strengths,using Linear Increasing Stress Tests(LISTs).The stress corrosion crack velocity was 5.0±2.5×10⁻⁹m s−1,independent of applied stress rate and independent of material strength.SCC susceptibility was greater at lower applied stress rates manifest most importantly as a lower threshold stress for stress corrosion crack initiation.SCC susceptibility could be characterised by the ratio of threshold stress to yield stress,which was dependent on processing details and was as low as 0.3.
Magnesium;LIST;SEM;Stress corrosion
1.Introduction
Stress corrosion cracking(SCC)is known to be an issue for Mg alloys[1–3]and this topic has recently received considerable attention[4–23].The reviews by Winzer and co-workers [1–3]on the stress corrosion cracking(SCC)of Mg alloys showed that SCC can occur at stresses equal to 50%of the yield stress.A continuous second phase along grain boundaries causes intergranular stress corrosion cracking(IGSCC).Heat treatment can dissolve such a distribution of second phase,and remove the possibility of IGSCC.In contrast,transgranular stress corrosion cracking(TGSCC)can occur in distilled water, indicating that no deleterious ions are needed[1,24–26]. TGSCC involves hydrogen[1,27].Our subsequent studies of Mg SCC include studies of Mg-X alloys[28,29],and ultrahigh-purity Mg5Zn[30].
Winzer et al.[24–26]showed that AZ31 suffered stress corrosion cracking in distilled water,the threshold stress was about 0.6 times the yield stress,the stress corrosion crack velocity was 4.0±2.4×10⁻⁹m s−1independent of the applied strain rate in constant extension rate tests,and presented evidence that the stress corrosion cracking mechanism involved the HELP (hydrogen enhanced localised plasticity)mechanism.
Kim et al.[31–33]have recently demonstrated that highratio differential speed rolling can reduce grain size down to sub-micrometer size in metals[31–33],and subsequently also in metal-matrix composites[34–36].In particular,Kim et al.[31]used high-ratio differential speed rolling to produce high strength in the Mg alloy AZ31,achieving a yield strength of 380 MPa,a tensile strength of 410 MPa,and an elongation to fracture of 7%,for material having a grain size of 0.6µm.
Thus,it is of considerable interest to study the stress corrosion cracking behaviour in distilled water of the high-strength AZ31 produced by high-ratio differential speed rolling of AZ31.That is the aim of this paper.
2.Experimental methods
Table 1 provides a summary of the specimen material studied in this paper,which were designated as AZ31ar, DR423wq,DR473wq,and DR473ac.AZ31ar was from an extruded AZ31 plate(3 wt%Al,0.8 wt%Zn,0.2 wt%Mn), 2 mm in thickness.High-ratio differential speed rolling was used to process this extruded plate to produce DR423wq,DR473wq,and DR473ac as follows.This extruded plate was rolled using a rolling mill with 300 mm rolls,under nonlubricated conditions,for a total thickness reduction of 66%. The top roll rotated at 6 revolutions per minute,while the bottom roll rotated in the opposite direction at 3 revolutions per minute.The temperature of the rolls was maintained using heating elements at 473 K or 423 K.The 2 mm plate was rolled in two passes.In the firs pass,the cold plate was rolled using rolls at 473 K,rolled from 2 mm thickness to 1.65 mm thickness,and air-cooled.This is designated as R1 at 473 K in Table 1.In the second pass,the material,in an unchanged orientation,was rolled to the fina thickness at 473 K or 423 K, and either water quenched(to produce respectively DR473wq and DR423wq)or air-cooled(to produce DR473ac).The sheet thickness was 0.70 mm for DR473wq and DR423wq,and was 0.65 mm for DR473ac.

Table 1Specimen material designations,treatments,grain size,dislocation density,and mechanical properties from reference 31 and designation used by Kim et al.[31]. WQ is water quenched.
Table 1 also gives the resultant grain size and mechanical properties from Kim et al.[31]and the corresponding designations used by Kim et al.[31].DR423wq had a yield strength and a tensile strength significanty higher than that of the as-received AZ31ar,with an elongation to fracture of 7%.
Stress corrosion cracking was studied using the Linearly Increasing Stress Test(LIST)[37]as in our prior studies of the stress corrosion cracking of Mg alloys[24–26,28–30].The specimen was a sheet tensile specimen with gauge length of 20 mm,gauge width of 2 mm,thickness equal to the sheet thickness,and long specimen direction in the plate rolling direction(i.e.these were longitudinal specimens).The specimen,while exposed to the solution of interest,was subjected to a linearly increasing stress until fracture.Linearly increasing stress tests(LISTs)were carried out all on the same LIST apparatus in the period July to Nov 2012.A potential drop technique measured the specimen resistance and was used to identify the yield stress(in air or in solution in the absence of stress corrosion cracking)and the threshold stress for stress corrosion crack initiation in solution,as in our prior studies [28–30,37].The ultimate tensile strength was evaluated from the load at fracture.Each stress was evaluated as an engineering stress based on the original cross-section area of the specimen. Subsequently,standard tensile tests were carried out using an Instron universal testing machine.
3.Results
3.1.LISTs
Fig.1 presents the relative electrical resistance plotted versus applied stress for Linearly Increasing Stress Tests (LISTs)using AZ31ar tested under the following applied stress rates and environments:(i)0.040 MPa s−1in air, (ii) 0.0024 MPa s−1in distilled water (DW) and (iii) 0.00024 MPa s−1in distilled water(DW).These curves(and subsequent similar curves)have been displaced vertically to provide a clear separation between the curves.The electrical resistance data measured throughout this work were noisy, much noisier than comparable data for steels[38–46],and comparable with our prior data for Mg alloys[28–30].Our experience with LIST testing indicates that there is initially a slow linear increase of the specimen electrical resistance with increasing applied stress in the early part of the LIST,attributed to a decrease in specimen cross-section and an increase in specimen length with increasing stress.At the threshold stress for stress corrosion cracking,and at the yield stress,there is a significan increase in the rate of increase of specimen resistance with increasing stress.This allows analysis of the electrical resistance data as illustrated in Fig.1 to provide estimates for the yield stress or the threshold stress for the initiation of subcritical stress corrosion crack growth.The initial electrical resistance data were fitte to a straight line for a slow increase of electrical resistance with increasing stress at low stress values.The electrical resistance data at the higher stresses were also fitte to a straight line,but with a greater slope,and the intersection of these two straight lines was identifie as the yield stress or the threshold stress for the initiation of subcritical stress corrosion crack growth.The evaluated stresses were dependent on the details of the fitting Nevertheless,in all the cases investigated herein,there was a significan change of slope in the raw data,and experience with fittin various slope lines to the data indicated that the error in the evaluated stresses was probably less than 10%.
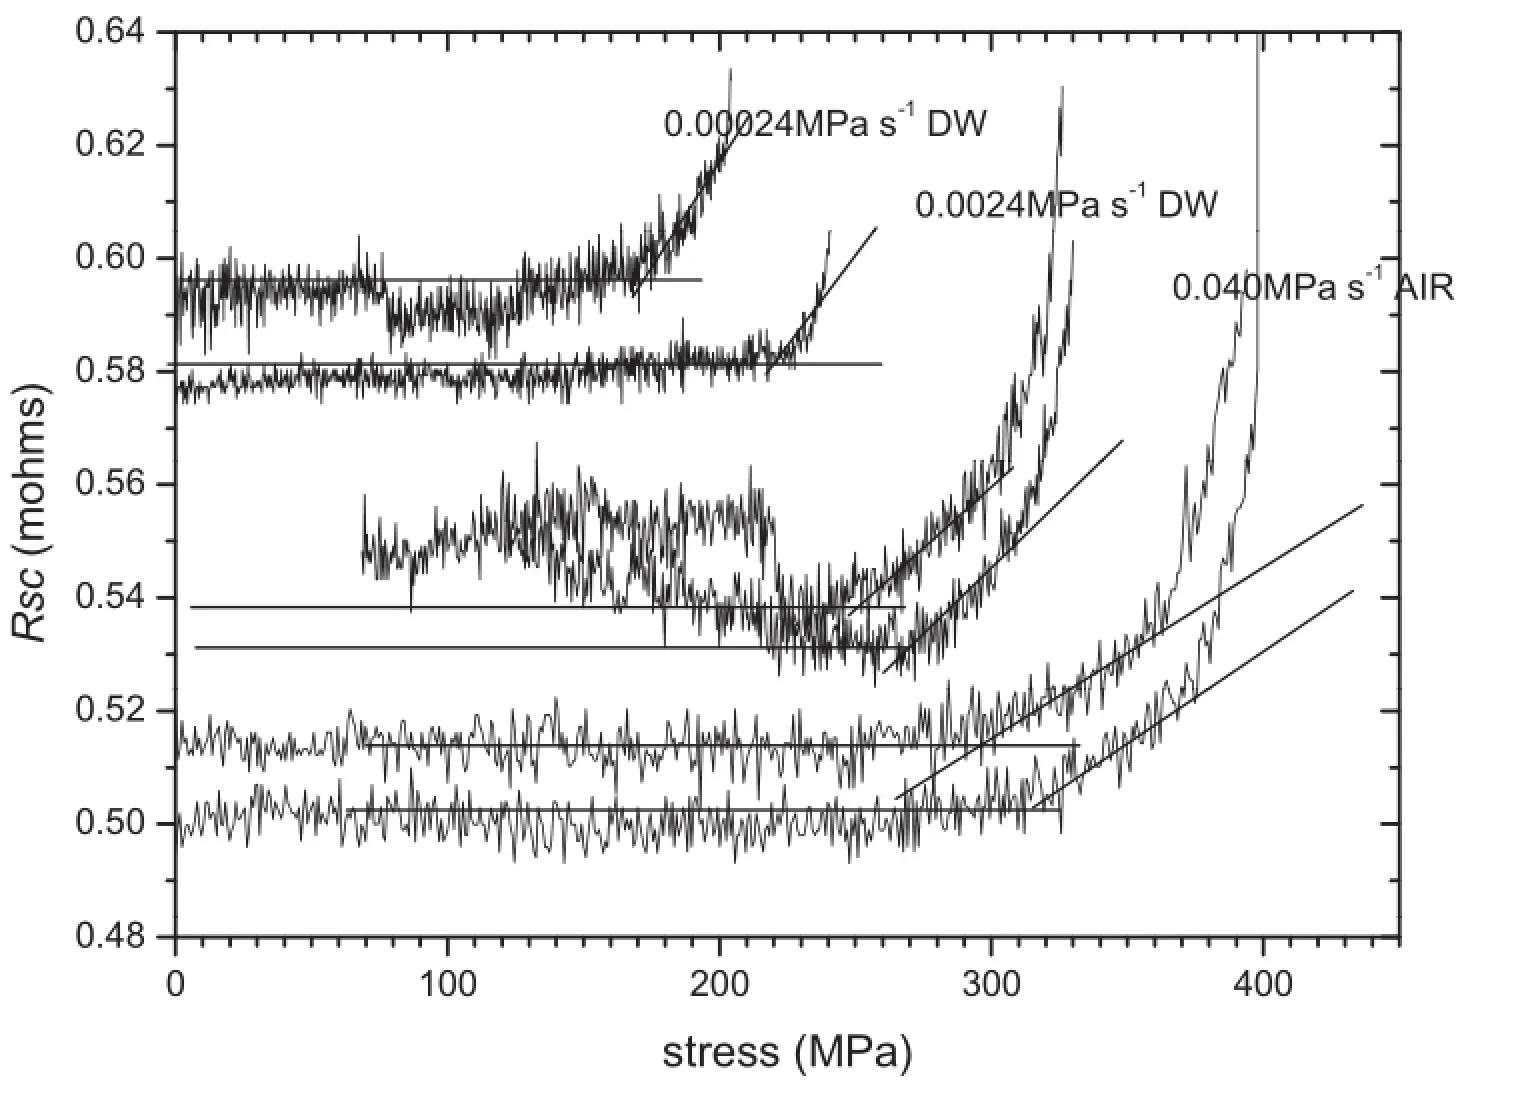
Fig.1.Relative electrical resistance of AZ31ar specimens versus stress for LISTs under the following conditions:(1)0.040 MPa s−1in air,(2)0.0024 MPa s−1in distilled water and(3)0.00024 MPa s−1in distilled water.The electrical resistance data were much noisier than comparable data for steels.Based on our experience, the resistance data were fitte as follows.(i)There was initially a slow linear increase of resistance with increasing stress due to the decrease in section and increase in specimen length,and the initial part of the data was fitte by a slowly increasing straight line.(ii)A more rapid increase in resistance occurred at the onset of subcritical stress corrosion crack growth,or the onset of yielding.The threshold stress for initiation of subcritical cracking(or the onset of yielding)was identifie by the intersection of the initial straight line and a straight line fittin the data at the higher stress values.
Table 2 provides the resulting values of(i)yield stress and threshold stress for the initiation of stress corrosion cracking and(ii)the fracture stress,evaluated as the stress at which the specimen fractured.The values of yield stress in air and the fracture stress in air for AZ31ar were somewhat greater than the corresponding values measured by Kim et al.[31]and included in Table 1.The values of the threshold stress for subcritical stress corrosion crack initiation in distilled water at an applied stress rate of 0.0024 MPa s−1were smaller than the values of the yield stress in air,and furthermore the values of the threshold stress were lower still at the slower applied stress rate of 0.00024 MPa s−1.This indicated the occurrence of stress corrosion cracking in AZ31ar in these tests in distilled water.
Fig.2 presents the electrical resistance versus stress curves for LISTs of differentially-rolled DR423wq,tested under the following applied stress rate and environment conditions:(i) 0.1134 MPa s−1in air,(ii)0.1134 MPa s−1in distilled water (DW),(ii)0.0068 MPa s−1in distilled water(DW)and(iv) 0.00068 MPa s−1in distilled water(DW).The data were analysed assuming that electrical resistance increased slowly and linearly with increasing stress up to the yield stress or the threshold stress for the initiation of subcritical stress corrosion crack growth;and as the stress increased further,the electrical resistance increased sharply at an accelerated rate,and subsequently accelerated more quickly up to the fina fracture stress. The data were analysed as shown in Fig.2 to estimate the yield stress or the threshold stress for the initiation of subcritical stress corrosion crack growth,and these values are presented in Table 2.
Table 2 shows that for DR423wq tested at the stress rate of 0.1134 MPa s−1,the yield stress values for the specimens tested in distilled water(DW)were similar to the values for the specimens tested in air,whereas the values of the ultimate tensile stress tested in distilled water(DW)were a little lower than those in air.For the tests at the lower stress rates, 0.0068 MPa s−1and 0.00068 MPa s−1,the threshold stress values were lower,and decreased at the lower applied stress rates,and similarly the ultimate tensile stress values were also decreased.This indicated increasing SCC sensibility in distilled water(DW)for DR423wq.
Fig.3 similarly presents the electrical resistance of LIST specimens of DR473wq versus stress during LIST test at the following applied stress rates and conditions:(1) 0.1134 MPa s−1and 0.068 MPa s−1in air,(2)0.068 MPa s−1in distilled water,(3)0.0068 MPa s−1in distilled water and(4) 0.00068 MPa s−1in distilled water.The data were analysed as for Fig.2.The values of threshold stress and fracture stress are presented in Table 2.
Table 2 shows that the yield stress of DR473wq tested in air was similar at the applied stress rates of 0.068 MPa s−1and 0.1134 MPa s−1,and these values were similar to the values in distilled water(DW)at the applied stress rate of 0.068 MPa s−1. At the lower values of applied stress rate of 0.0068 MPa s−1and 0.00068 MPa s−1,there were significanty lower values of threshold stress and ultimate tensile stress measured in distilled water(DW).For one specimen,tested at 0.0068 MPa s−1in distilled water(DW),the threshold stress was equal to ultimate tensile stress because the specimen fractured at the threshold stress.The electrical resistance data were noisy for the specimens tested at 0.00068 MPa s−1;nevertheless,these thresholdvalues were lower than the values measured at the higher applied stress rates,and moreover,the fracture stress values were also similarly lower than at the higher stress rates.
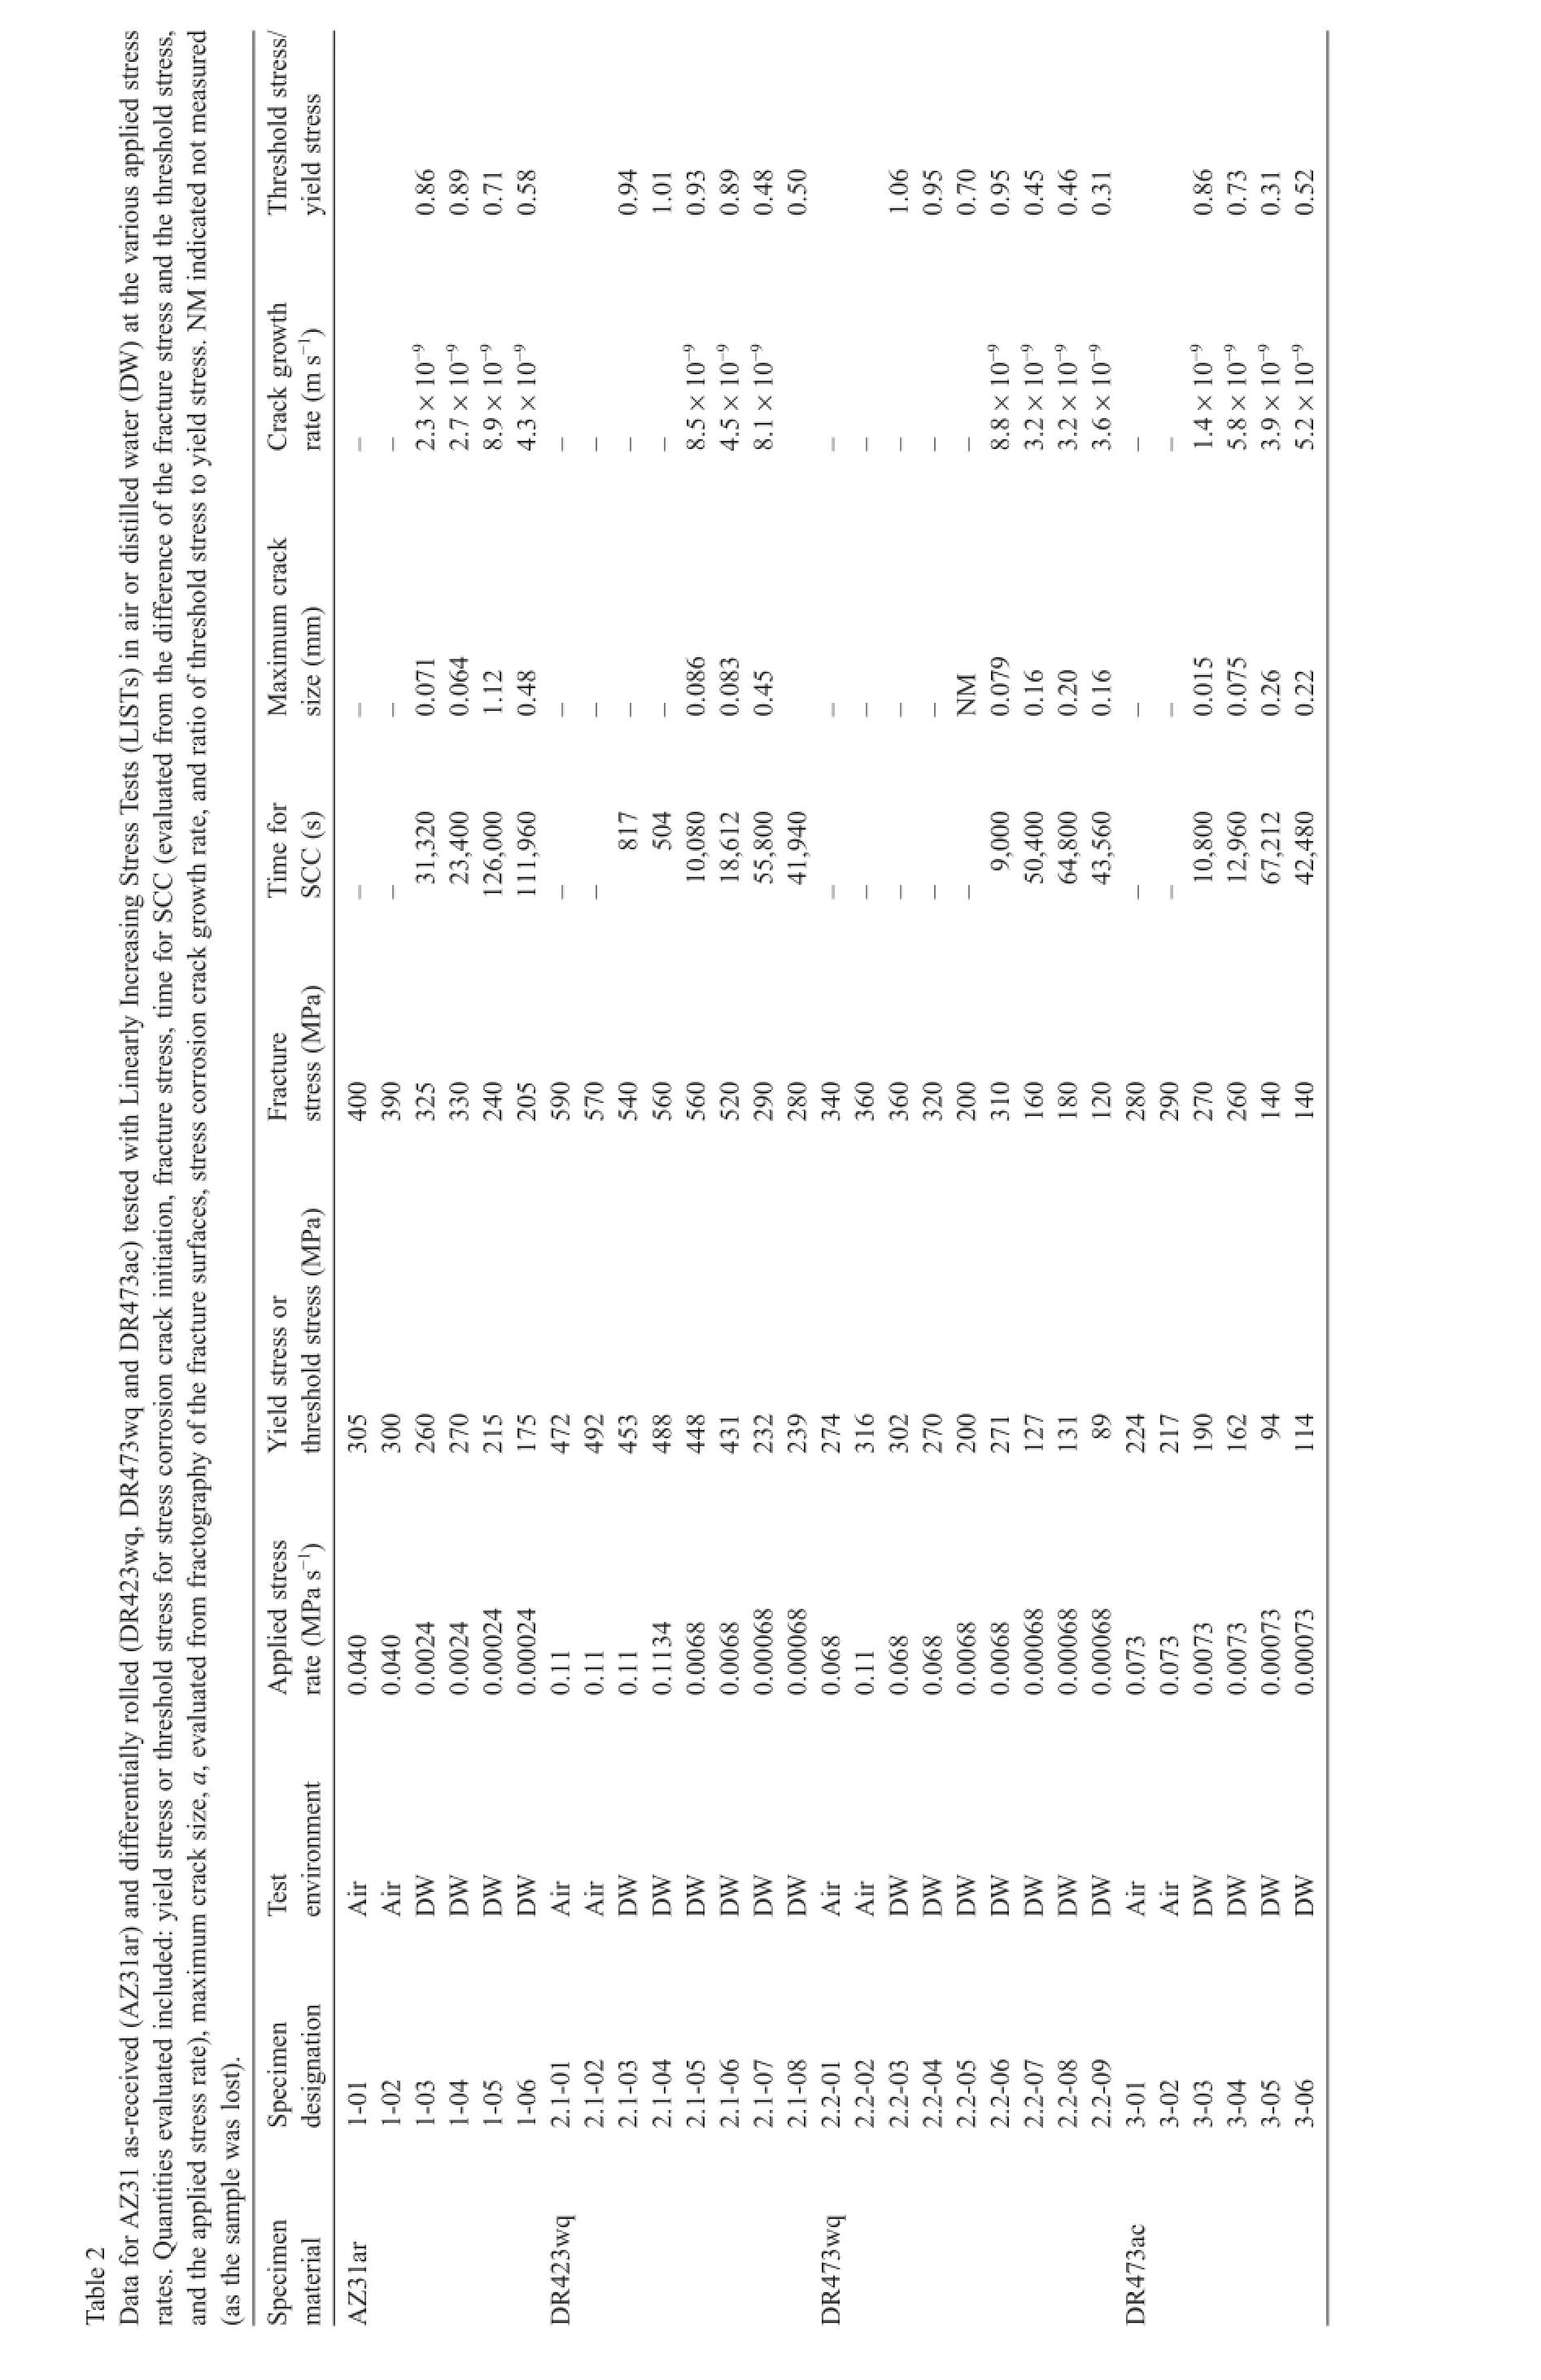
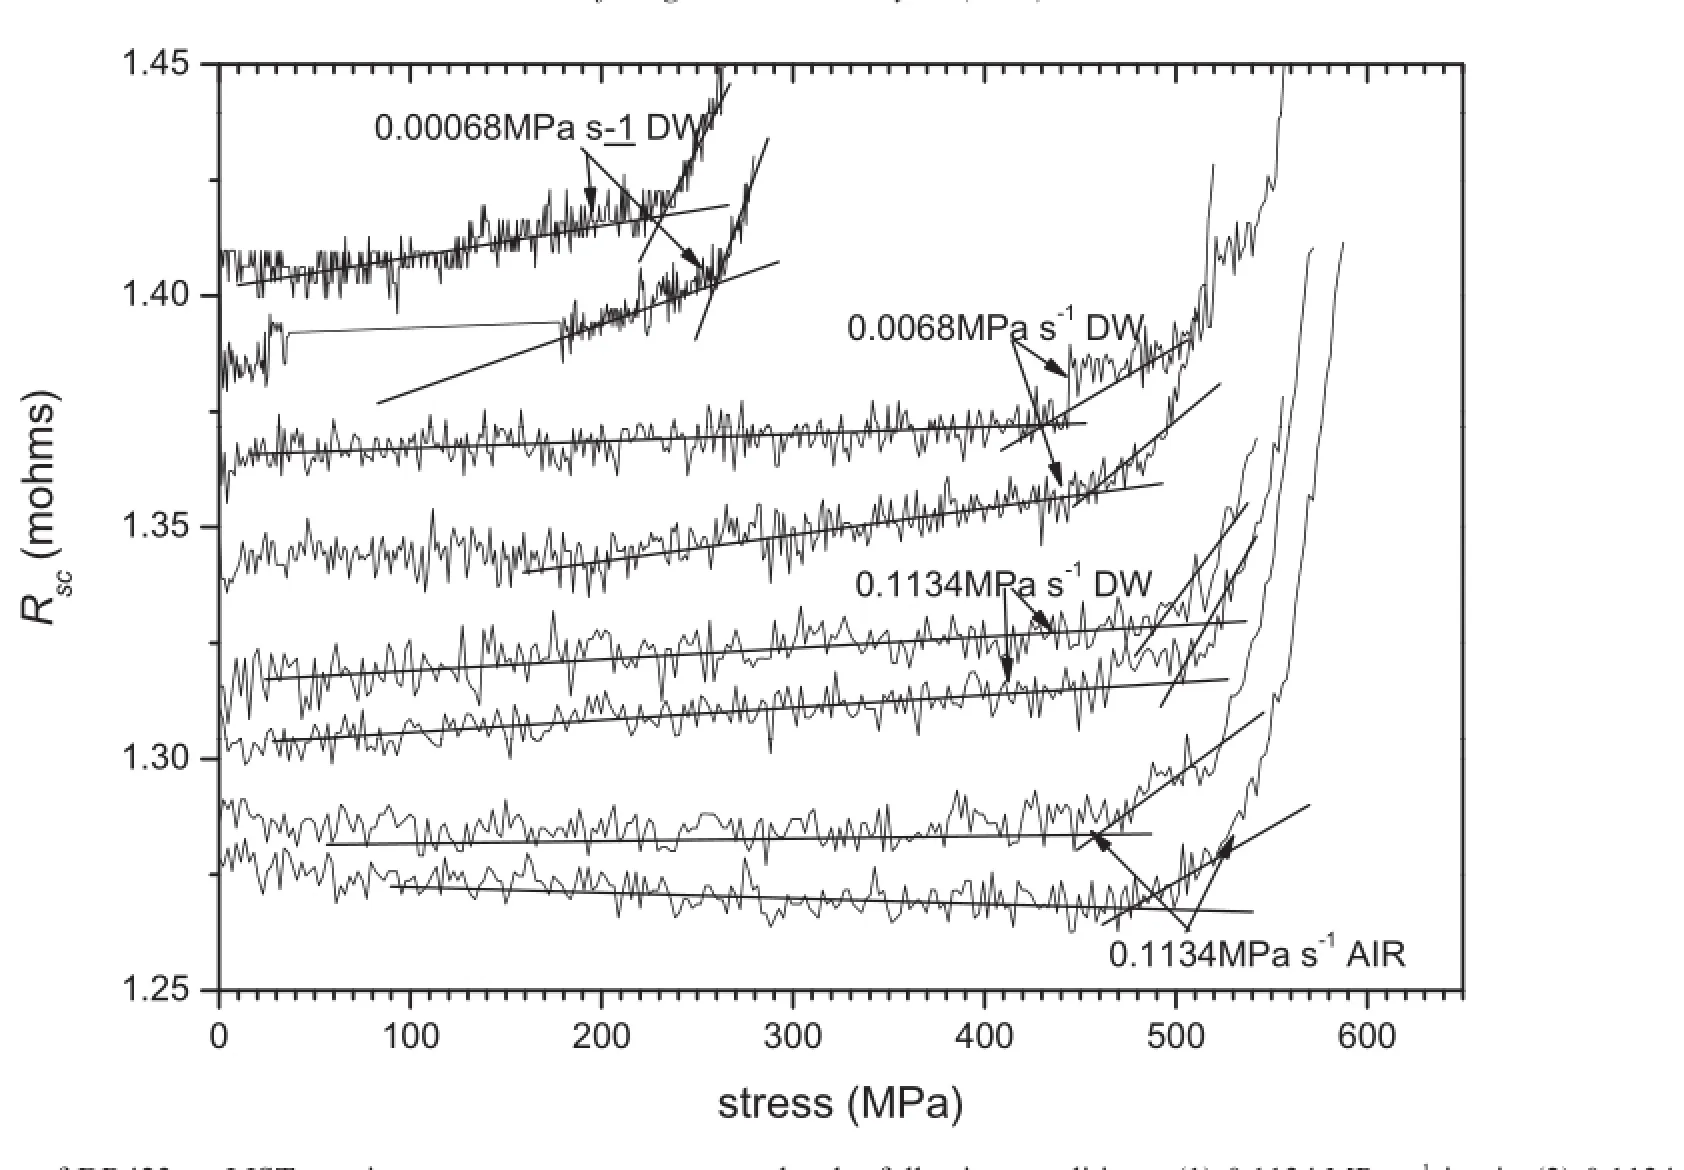
Fig.2.Electrical resistance of DR423wq LIST specimens versus stress curves under the following conditions:(1)0.1134 MPa s−1in air,(2)0.1134 MPa s−1in distilled water,(3)0.0068 MPa s−1in distilled water and(4)0.00068 MPa s−1in distilled water.The data fittin for Figs.2 to 4 was as for Fig.1.
Fig.4 presents similarly the electrical resistance of LIST specimensofDR473acversusstressduring for LISTs with the following conditions:(i)0.073 MPa s−1in air,(ii)0.0073 MPa s−1in distilled water(DW)and(ii) 0.00073 MPa s−1in distilled water(DW).The data were analysed as for Figs.1 to 3 and the resulting values of yield or threshold stress and fracture stress are presented in Table 2.
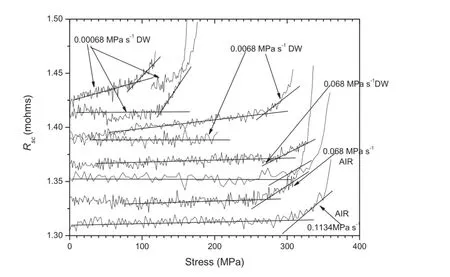
Fig.3.Electrical resistance of DR473wq LIST specimens versus stress during LIST test at:(1)0.1134 MPa s−1and 0.068 MPa s−1in air,(2)0.068 MPa s−1in distilled water,(3)0.0068 MPa s−1in distilled water and(4)0.00068 MPa s−1in distilled water.
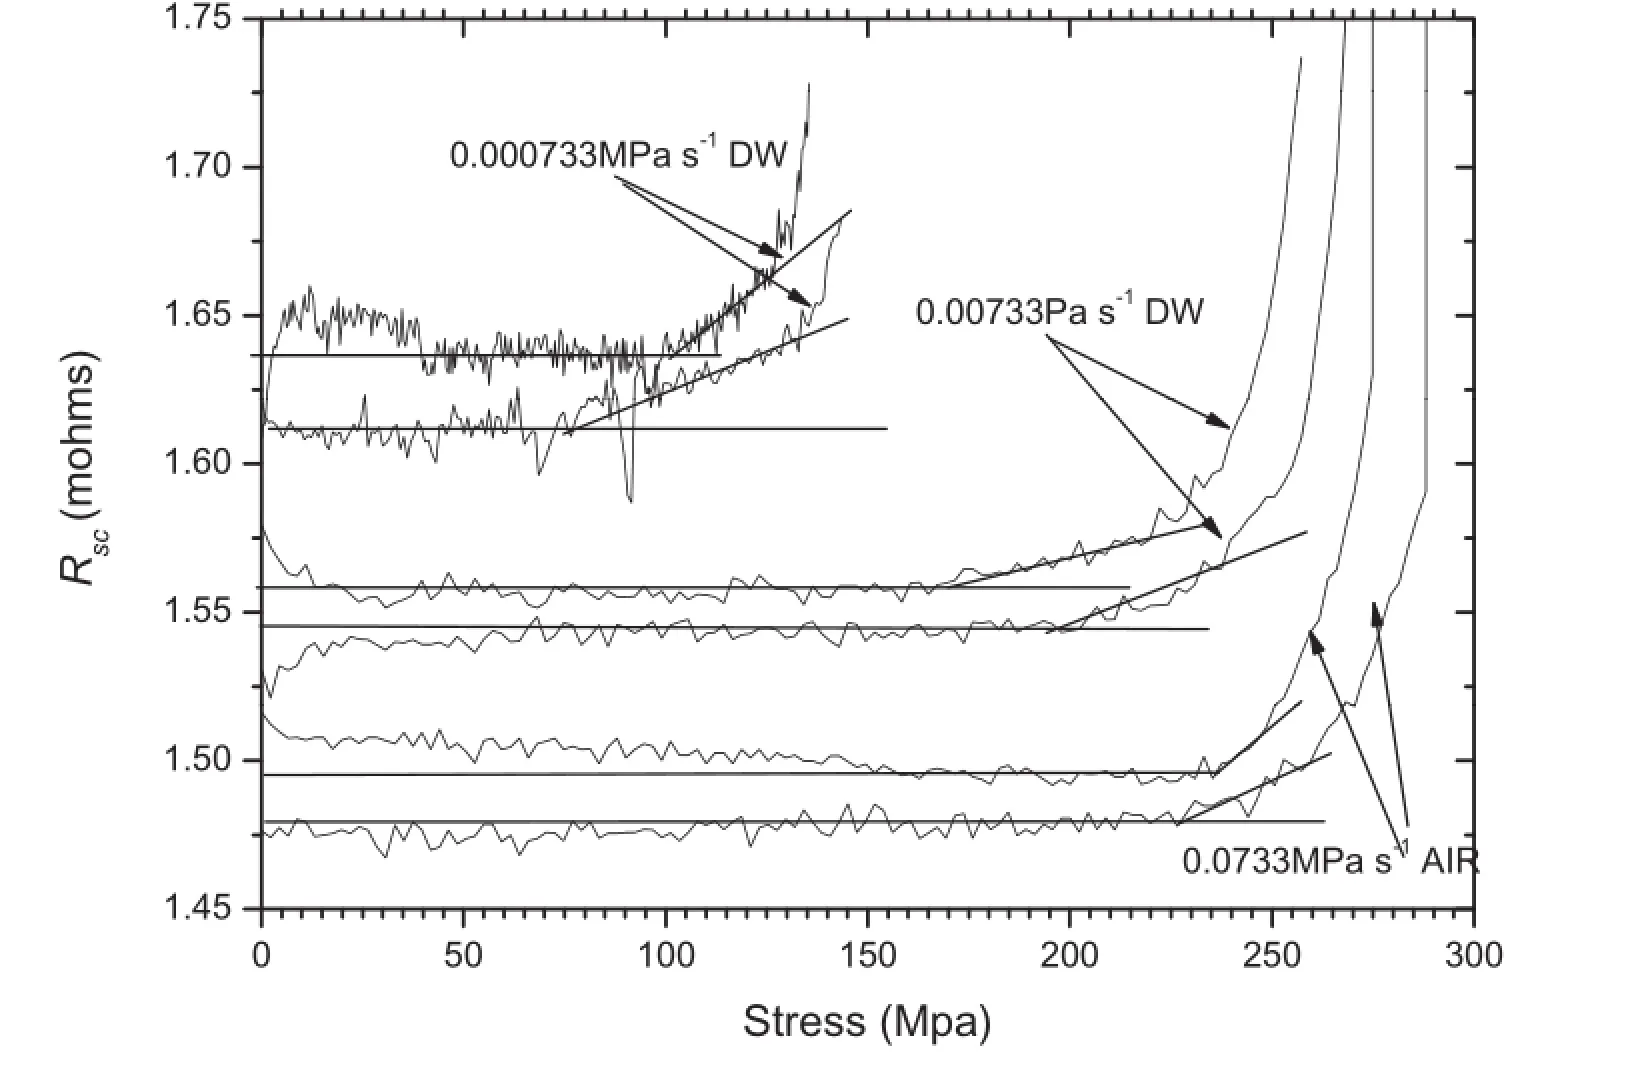
Fig.4.Electrical resistance of DR473ac LIST specimens versus stress during LIST test at:(1)0.073 MPa s−1in air,(2)0.0073 MPa s−1in distilled water,and(3) 0.00073 MPa s−1in distilled water.
Table 2 indicates that the values of threshold stress and fracture stress of DR473ac in distilled water(DW)were lower than the corresponding values in air.Furthermore,the values of the threshold stress and fracture stress at an applied stress of 0.00073 MPa s−1in distilled water(DW)were lower than the corresponding values at the higher applied stress rate.For example,the average threshold stress for specimens tested at 0.00073 MPa s−1in distilled water(DW)was about 104 MPa compared to the value of 220 MPa at the applied stress rate of 0.073 MPa s−1in air.
Table 2 also presents the time for stress corrosion cracking in distilled water,evaluated as the time taken for the Linearly Increasing Stress Test between the measured values of the threshold stress and the fracture stress.The time for stress corrosion cracking increased at the lower applied stress rates, indicating that there was a longer time between the threshold stress and the fracture stress.
3.2.Fractography
Figs.5 to 9 present the fracture surfaces of AZ31ar and differentially rolled DR423wq,DR473wq and DR473ac after the Linearly Increasing Stress Tests(LISTs)in air and in distilled water.
The fractures for specimens after LISTs in air were ductile, with microvoid coalescence,as illustrated in Fig.5a and b for AZ31ar,Fig.5c and d for DR423wq,Fig.5e and f for DR473wq,and Fig.5g and h for DR473ac.
In contrast,LISTs in distilled water(DW)produced stress corrosion cracks that initiated at the specimen surface,caused over load fracture when the crack length became sufficienty long,and were transgranular as documented in Figs.6 to 9.The fractography indicated that for each LIST in distilled water at an applied stress rate of 0.0068 MPa s−1or slower,there was evidence of stress corrosion cracking on the fracture surface indicating the there had been stress corrosion cracking.
Fig.6a shows an overview of the fracture surface of AZ31ar after the LIST test in distilled water at an applied stress rate of 0.00024 MPa s−1.This shows that stress corrosion cracking initiated at the top gauge surface of the specimen,and reached 0.46 mm in depth.The rest of the surface was the overload region,and consisted of dimple rupture similar to the fracture surface in air.Fig.6b presents a higher magnificatio view of the stress corrosion crack. This revealed thatthe stress corrosion crack was transgranular and brittle in appearance.Examination at higher magnification did not reveal any new features,and thus no higher magnificatio fractographs are included.There was no sign of any ductility.
Fig.7 shows the fracture surface of DR423wq after LIST test at an applied stress rate of 0.0068 MPa s−1in distilled water. The stress corrosion cracking had initiated at some parts of the specimen surface and had reached 80µm in depth.The stress corrosion cracking was flute-li e,transgranular and brittle in appearance.The central(overload)area of the specimen showed dimpled fracture as is clear from Fig.7(a).
Fig.8 shows a typical fracture surface of DR473wq in distilled water.There was stress corrosion cracking along the bottom gauge surface and dimple rupture over the remainder of the fracture surface(the overload region).Fig.8b presents a high magnificatio view of the stress corrosion crack,which was similar in appearance to those in Figs.6b and 7b.The stress corrosion crack was transgranular and brittle in appearance. There was no evidence of any ductility.The stress corrosion crack growth was from the gauge surface at the bottom of the figur towards the middle of the specimen.There were secondary cracks towards the top of the magnifie view in Fig.8(b).
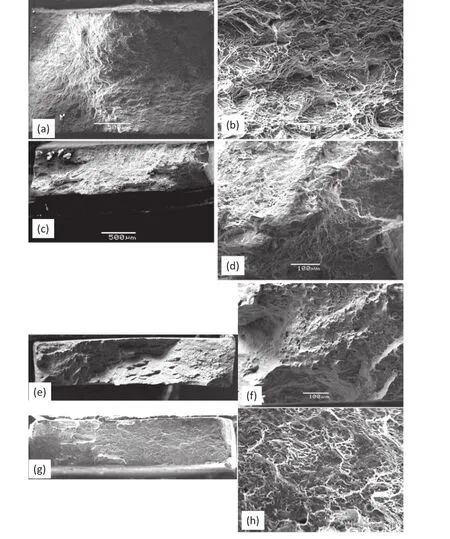
Fig.5.Fracture surfaces of LISTs in air of(a,b)AZ31ar tested at 0.040 MPa s−1in air,(c,d)DR423wq tested at 0.11 MPa s−1,(e,f)DR473wq at 0.068 MPa s−1in, and(g,h)DR473ac at 0.068 MPa s−1.
Fig.9 presents the fracture surface of DR473ac after LISTs in distilled water.Stress corrosion cracks had initiated over most of the top and bottom gauge surfaces,and grown to various depths;the deepest was at the bottom left part of the specimen.The stress corrosion cracks consisted of parallel facets and ridges along the crack direction,as shown in Fig.9c. There was no evidence of any ductile dimples at higher magnifications
Table 2 also records the maximum stress corrosion crack size,measured from the fracture surface,for each Linearly Increasing Stress Test specimen tested in distilled water.The maximum stress corrosion crack size increased with decreasing applied stress rate,attributable to the fact that there was longer for stress corrosion cracking for the Linearly Increasing Stress Tests at the lower applied stress rates.
4.Discussion
4.1.Mechanical property values
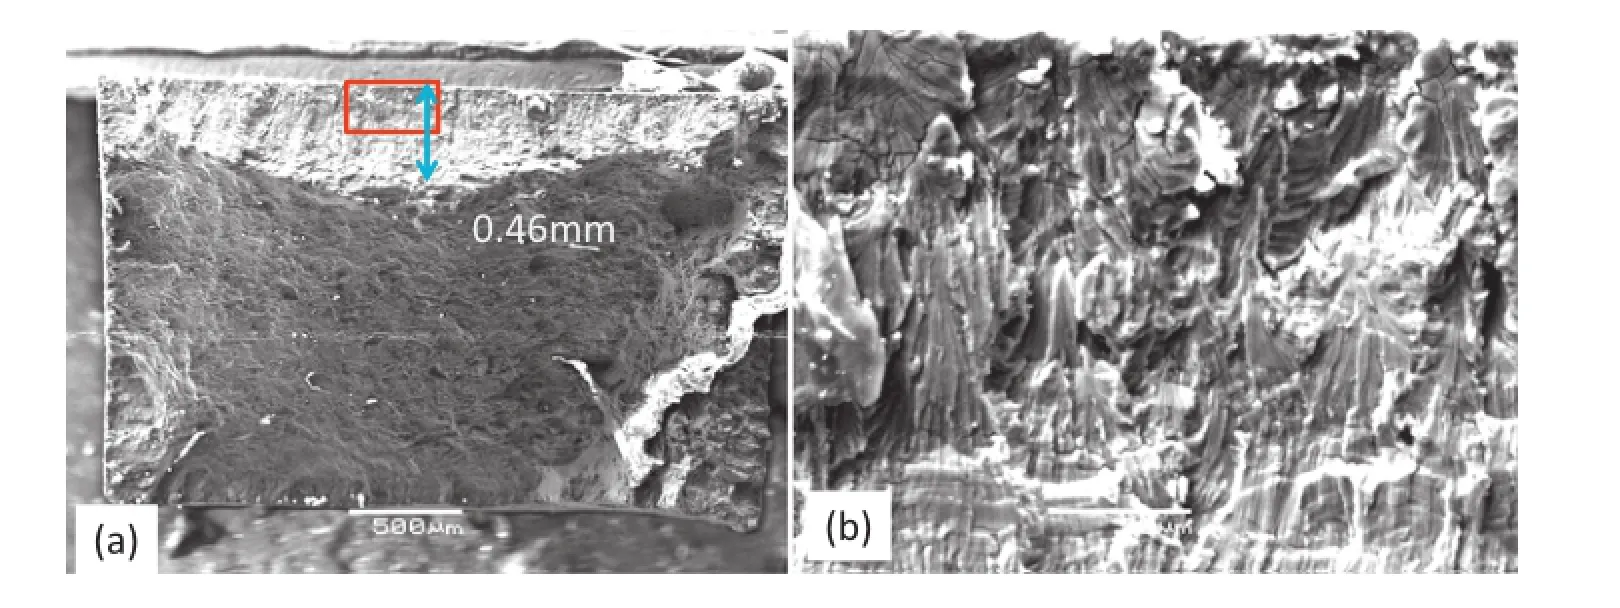
Fig.6.Fracture ofAZ31ar after LIST test in distilled water at 0.00024 MPa s−1.(a)The fla transgranular stress corrosion fracture propagated from the gauge surface towards the centre area of the sample.(b)A higher magnificatio view of the region in(a)identifie by the square,detailing the stress corrosion crack morphology as brittle with no ductile features.
Table 2 indicates that the values of yield strength and fracture strength measured by the LISTs was somewhat greater than the corresponding values in Table 1 measured by Kim et al. [31].Linearly increasing stress tests(LISTs)were carried out all on the same LIST apparatus in the period July to November 2012.Subsequently,the LIST apparatus has been transported to the new Advanced Engineering Building,recalibrated,and a repeat measurement gave values consistent with those in Table 1.Similarly,standard tensile tests gave values consistent with those in Table 1.Thus,the values of yield and tensile stress in Table 2 have considerable systematic errors;however,it is expected that nevertheless a comparison is still possiblebetween these values because they were all measured on the same LIST apparatus and were measured in a comparably short period of time.
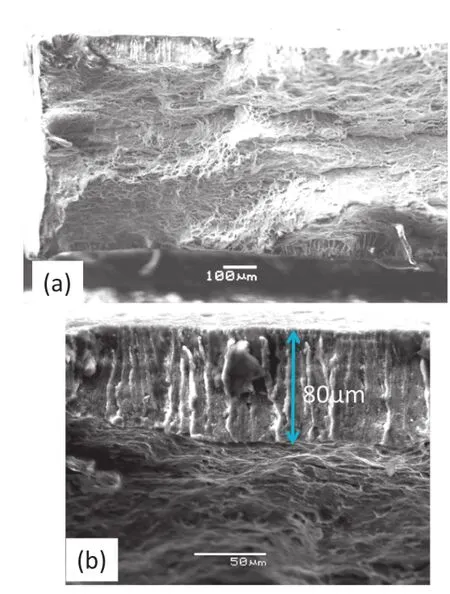
Fig.7.Fracture of AZ31 DR423wq after LIST test at 0.0068 MPa s−1in distilled water.
4.2.LISTs
The fractography indicated that for each LIST in distilled water at an applied stress rate of 0.0068 MPa s−1or slower,there was evidence of stress corrosion cracking on the fracture surface,indicating that there had been stress corrosion cracking.This means that the electrical resistance data had identifie the threshold stress for stress corrosion crack initiation.For these conditions,Table 2 indicates that(i)the threshold stress for stress corrosion crack initiation was lower than the yield stress in air,(ii)the threshold stress for stress corrosion cracking was lower at the lower applied stress rates,(iii)the fracture stress was lower than that in air,(iv)the fracture stress in distilled water was lower at the lower applied stress rates,and (v)the ratio of threshold stress to yield stress was lower at lower applied stress rates,decreased with decreasing applied stress rates and was as low as 0.3.These trends were similar for the four metallurgical conditions studied.
These trends indicate that(i)AZ31 increased in sensitivity to stress corrosion cracking with decreasing applied stress rate, and that(ii)the sensitivity to stress corrosion crack initiation was dynamic,and increased at lower applied stress rates.
Table 2 provides an evaluation of the stress corrosion crack growth velocity for each Linearly Increasing Stress Test in distilled water(DW).Each stress corrosion crack growth velocity was evaluated from(the maximum stress corrosion crack size measured on the fracture surface)divided by the(time for stress corrosion cracking).These values of stress corrosion cracking velocity had significan scatter for identical conditions.For example:(i)the stress corrosion crack velocity was evaluated to be 8.9×10⁻⁹m s−1and 4.3×10⁻⁹m s−1forAZ31ar at an applied stress rate of 0.00024 MPa s−1in distilled water; (ii)the stress corrosion crack velocity was evaluated to be 8.5×10⁻⁹m s−1and 4.5×10⁻⁹m s−1for DR423wq at an applied stress rate of 0.0068 MPa s−1in distilled water;and(iii) the stress corrosion crack velocity was evaluated to be 1.4×10⁻⁹m s−1and 5.8×10⁻⁹m s−1for DR473ac at an applied stress rate of 0.0073 MPa s−1in distilled water.

Fig.8.Fracture of DR473wq at 0.00068 MPa s−1in distilled water.
Moreover,these data further show that(i)the stress corrosion cracking velocity was similar for applied stress rates different by an order of magnitude,and(ii)the stress corrosion cracking velocity was similar for the four material conditions.
If it is assumed that the stress corrosion crack velocity in distilled water was not dependent on applied stress rate, and was not dependent on the strength of the material,then the average value of the measured values gives the best measurement of the stress corrosion crack velocity.This average stress corrosion crack velocity in distilled water was 5.0±2.5×10⁻⁹m s−1.This value of stress corrosion crack velocity in distilled water was in good agreement with our previous measurements of 4.0±2.4×10⁻⁹m s−1.
4.3.Fractography
The fractography can be summarised as indicating that stress corrosion cracks initiated at the gauge surfaces of the specimens.Often many stress corrosion cracks had initiated and grown independently.The appearance of the stress corrosion cracks was similar at the different applied stress rates and for the four different material strength conditions.
The stress corrosion cracks consisted of parallel facets and ridges along the crack direction,as shown in Fig.9c.There was no evidence of any ductile dimples at higher magnifications
Based on the features of SCC of AZ31 under different DR conditions,the fractography showed the TGSCC fracture as evidenced as the parallel facets along the crack direction in distilled water.This is somewhat in contrast to the previous work by Winzer et al.[24–26]that indicated that the stress corrosion cracking mechanism for AZ31 in distilled water was hydrogen enhanced localised ductility,due to the observation of very-fin dimples.There may have been such fin dimples in the present case;however,observation of such fin dimples can be extremely difficult
4.4.SCC susceptibility
Table 2 indicated that the ratio of threshold stress to the yield stress was as low as 0.3,and was somewhat lower than measured in the prior work by Winzer et al.[24–26].
Fig.10 presents the ratio of threshold stress to yield stress plotted against the applied stress rate.For applied stress rates above~0.02 MPa s−1,there was no stress corrosion cracking.The threshold stress for stress corrosion cracking could be considered to be equal to the yield stress.Thus,the ratio (threshold stress/yield stress)was drawn as a horizontal line at a value of 1.0.For lower values of applied stress rates,the threshold stress for stress corrosion cracking was considerably lower than the yield stress,and depended on the specimen material and the applied stress rate.For these conditions,three straight lines were drawn through the following data:(i) AZ31ar,(ii)DR423wq,and(iii)DR473wq and DR473ac. Thus,the decrease of threshold stress with decreasing applied stress rate was least for AZ31ar.The decrease was greater for DR423wq.There was a greater decrease for DR472wq and DR473ac,but as there was much scatter for the data for these two materials,and the data overlapped,only one line is drawn through the combined data of DR473wq and DR473ac.This indicates that the SCC susceptibility increased in the following order: AZ31ar<DR423wq<DR473wq~DR473ac. This order is attributed to the microstructure of the various materials.
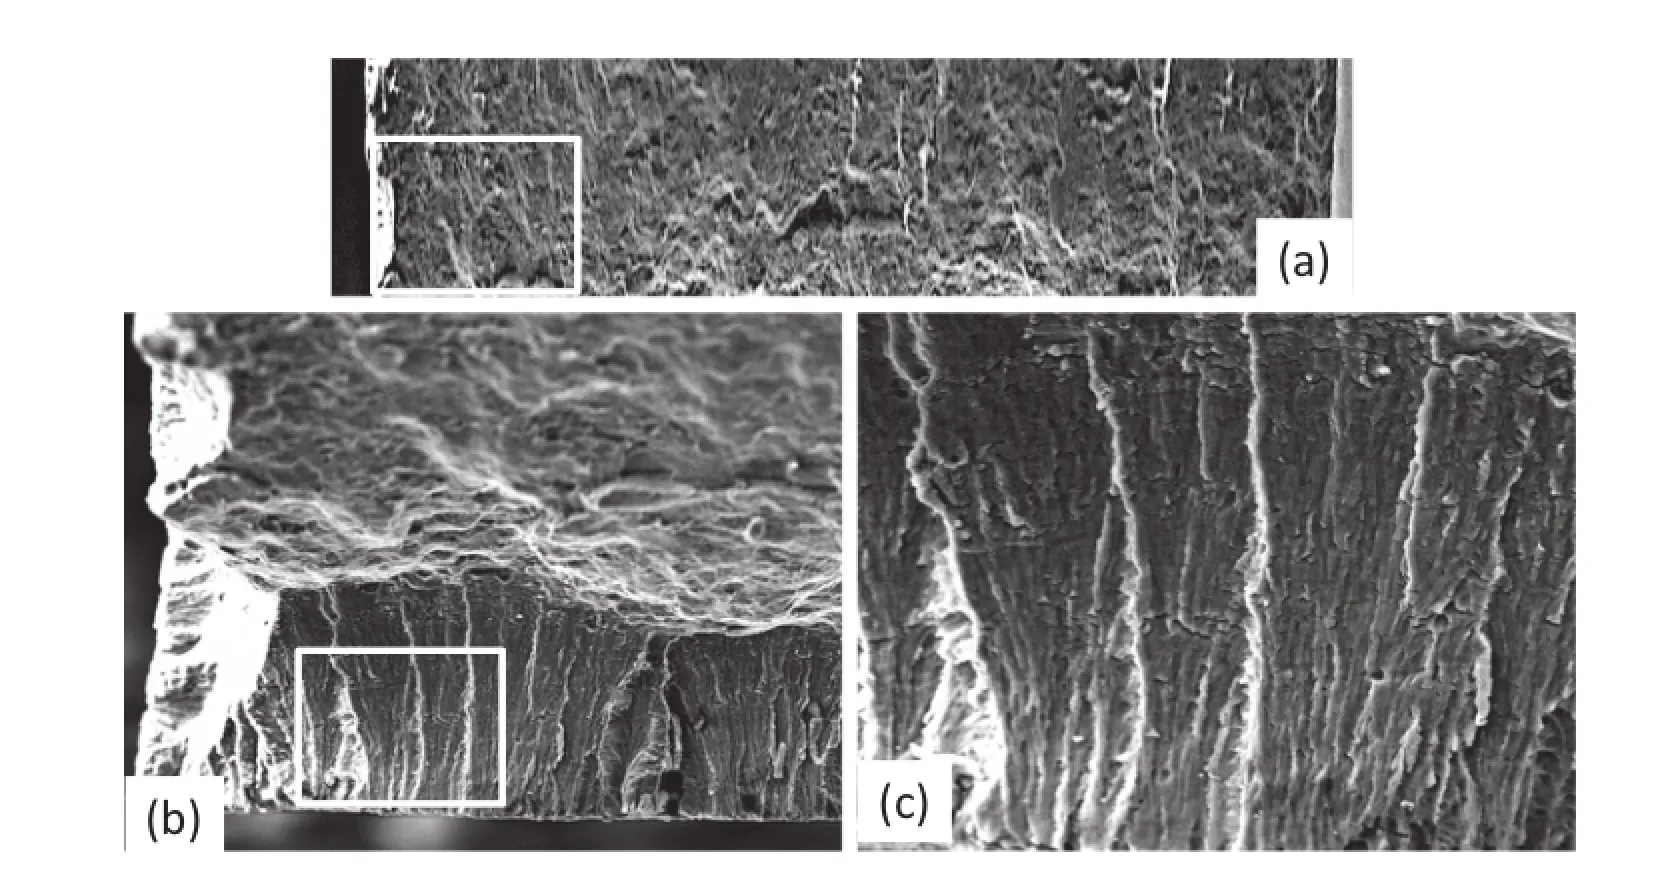
Fig.9.Fracture appearance of DR473ac at 0.00073 MPa s−1in distilled water.

Fig.10.Ratio(threshold stress)/(yield stress)for AZ31ar,DR423wq,DR473wq and DR473ac.For applied stress rates above~0.02 MPa s−1,there was no stress corrosion cracking.The threshold stress for stress corrosion cracking could be considered to be equal to the yield stress.Thus,the ratio(threshold stress/yield stress) is drawn as a horizontal line at a value of 1.0.For lower values of applied stress rates,the threshold stress for stress corrosion cracking was considerably lower than the yield stress,and depended on the specimen material and the applied stress rate.For these conditions,three straight lines have been drawn through the following data:(i)AZ31ar,(ii)DR423wq,and(iii)DR473wq and DR473ac.

Fig.11 provides a plot of the stress corrosion susceptibility index,given by whereTairis the yield stress(as measured in air)andTDWis the threshold stress for stress corrosion crack initiation in distilled water(DW).Note thatISCCis equal to zero if there is no stress corrosion cracking susceptibility,and the threshold stress for crack initiation in distilled water(DW)equals the yield stress. Furthermore,ISCCincreases to a value of 1.0 with increasing stress corrosion cracking susceptibility,as the threshold stress in distilled water decreases down to zero.Fig.11 uses the same groupings as in Fig.10,consistent with increasing stress corrosion cracking susceptibility in the following order: AZ31ar<DR423wq<DR473wq~DR473ac.At fast,applied stress rates there was no stress corrosion cracking,and the susceptibility index was equal to zero.For slower applied stress rates,the susceptibility index increased with decreasing applied stress rate,and the increase was dependent on the specimen material.The same data groupings have been used as in Fig.10: AZ31ar<DR423wq<DR473wq~DR473ac.
5.Conclusions
Stress corrosion cracking in distilled water was studied for AZ31,processed by differential-speed-rolling to different strengths,using Linear Increasing Stress Tests(LISTs).
1 The stress corrosion crack velocity was 5.0±2.5× 10⁻⁹m s−1,independent of applied stress rate and independent of material strength.
2 The stress corrosion cracking susceptibility was greater at
lower applied stress rates manifest most importantly as a
lower threshold stress for stress corrosion crack initiation. 3 The ratio of threshold stress to yield stress was as low as 0.3. 4 The SCC susceptibility increased in the following order:
总之,田子坊内挪移了国外多国和国内多地的民俗文化。这里以本地,包括吴越文化圈内的各种民俗(如油纸伞或丝绸,或旧时的化妆品)为底色,增添了一些突兀的外地如苗族和藏族文化元素,以及全国各地已经旅游商品化了的特色小吃。而符合当下中国人心理,能够代表时尚前沿和奇风异俗的外国民俗,也充斥其中。这种文化往往充当一种对异文化的体验而被接受。如前述各国特色风味餐厅和小饰品或玩偶,对于国人,尤其是当下已经广泛接触西方文化而具有开放包容心态的年轻人来说,会在产生新鲜感和好奇心之后进行消费。
AZ31ar<DR423wq<DR473wq~DR473ac.
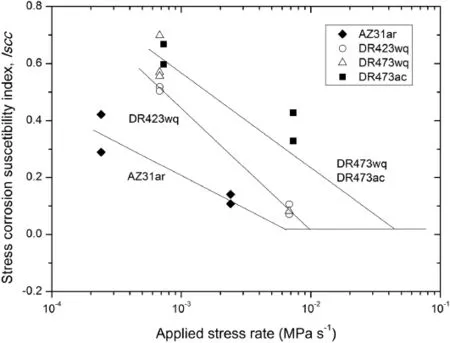
Fig.11.Stress corrosion cracking susceptibility index,ISCC,forAZ31ar,DR423wq,DR473wq and DR473ac.The same data groupings have been used as in Fig.10.
Acknowledgements
The research was supported by the Australian Research CouncilCentreofExcellenceDesign ofLight Alloys CE0561574 and DMTC.
[1]N.Winzer,A.Atrens,G.Song,E.Ghali,W.Dietzel,K.U.Kainer,et al., Adv.Eng.Mater.7(2005)659–693.
[2]A.Atrens,N.Winzer,W.Dietzel,Adv.Eng.Mater.13(2011)11–18.
[3]A.Atrens,N.Winzer,W.Dietzel,P.B.Srinivasan,G.Song,Chapter 8, G.L.Song (Ed.),Corrosion ofMagnesium Alloys,Woodhead, Cambridge,2011,pp.299–364.
[4]O.Hakimi,E.Aghion,J.Goldman,Mater.Sci.Eng.C Mater.Biol.Appl. 51(2015)226–232.
[5]A.Atrens,G.-L.Song,M.Liu,Z.Shi,F.Cao,M.S.Dargusch,Adv.Eng. Mater.17(2015)400–453.
[6]R.Zeng,W.Dietzel,R.Zetter,W.-M.Gan,X.Sun,Trans.Nonferrous Met.Soc.China 24(2014)3060–3069.
[7]L.Choudhary,R.K.Singh Raman,J.Hofstetter,P.J.Uggowitzer,Mater. Sci.Eng.C Mater.Biol.Appl.42(2014)629–636.
[8]S.D.Wang,D.K.Xu,E.H.Han,C.Dong,J.Magnes.Alloys 2(2014) 335–341.
[9]F.Cao,Z.Shi,G.-L.Song,M.Liu,M.S.Dargusch,A.Atrens.Corros.Sci. 98(2015)6–19.
[10]Z.Yu,D.Ju,H.Zhao,J.Environ.Sci.25(2013)S50–S53.
[11]B.S.Padekar,V.S.Raja,R.K.Singh Raman,P.Lyon,Mater.Sci.Eng.A Struct.Mater.583(2013)169–176.
[12]B.S.Padekar,V.S.Raja,R.K.Singh Raman,Eng.Fract.Mech.102(2013) 180–193.
[13]B.S.Padekar,V.S.Raja,R.K.Singh Raman,P.Lyon,Corros.Sci. 71(2013)1–9.
[14]L.Choudhary,R.K.Raman Singh,Acta Biomater.8(2012)916–923.
[15]P.B.Srinivasan,S.Riekehr,C.Blawert,W.Dietzel,M.Kocak,Trans. Nonferrous Met.Soc.China 21(2011)1–8.
[16]Y.Uematsu,T.Kakiuchi,M.Nakajma,Procedia Eng.10(2011)578–582.
[17]L.Choudhary,J.Szmerling,R.Goldwasser,R.K.Singh Raman,Procedia Eng.10(2011)518–523.
[18]Y.Zhang,J.You,J.Lu,C.Cui,Y.Jiang,X.Ren,Surf.Coat.Technol. 204(2010)3947–3953.
[19]R.K.Singh Raman,S.Jafari,S.E.Harandi,Eng.Fract.Mech.137(2015) 97–108.
[20]P.Casajús,N.Winzer,Mater.Sci.Eng.A Struct.Mater.602(2014)58–67.
[21]L.Choudhary,R.K.Singh Raman,Eng.Fract.Mech.103(2013)94–102.
[22]M.Nakajima,Mater.Sci.Eng.A Struct.Mater.531(2012)171–177.
[23]M.Bobby Kannan,W.Dietzel,Mater.Des.42(2012)321–326.
[24]N.Winzer,A.Atrens,W.Dietzel,G.Song,K.U.Kainer,Mater.Sci.Eng. A Struct.Mater.472(2008)97–106.
[25]N.Winzer,A.Atrens,W.Dietzel,V.S.Raja,G.Song,K.U.Kainer,Mater. Sci.Eng.A Struct.Mater.488(2008)339–351.
[26]N.Winzer,A.Atrens,W.Dietzel,G.Song,K.U.Kainer,Metall.Mater. Trans.A 39(2008)1157.
[27]N.Winzer,A.Atrens,W.Dietzel,G.Song,K.U.Kainer,Mater.Sci.Eng. A Struct.Mater.466(2007)18–31.
[28]F.Cao,Z.Shi,G.-L.Song,M.Liu,M.S.Dargusch,A.Atrens,Corros.Sci. 96(2015)121–132.
[29]F.Cao,Z.Shi,G.-L.Song,M.Liu,M.S.Dargusch,A.Atrens,Corros.Sci. 98(2015)6–19,doi:10.1016/j.corsci.2015.04.023.
[30]Z.Shi,J.Hofstetter,F.Cao,P.J.Uggowitzer,M.S.Dargusch,A.Atrens, Corros.Sci.93(2015)330–335.
[31]W.J.Kim,Y.G.Lee,M.J.Lee,J.Y.Wang,Y.B.Park,Script.Mater. 65(2011)1105–1108.
[32]W.J.Kim,K.E.Lee,S.-H.Choi,Mater.Sci.Eng.A Struct.Mater. 506(2009)71–79.
[33]W.J.Kim,S.J.Yoo,H.T.Jeong,D.M.Kim,B.H.Choe,J.B.Lee,Script. Mater.64(2011)49–52.
[34]W.J.Kim,T.J.Lee,S.H.Han,Carbon 69(2014)55–65.
[35]S.J.Yoo,S.H.Han,W.J.Kim,Carbon 61(2013)487–500.
[36]S.J.Yoo,W.J.Kim,Mater.Sci.Eng.A Struct.Mater.570(2013)102–105.
[37]A.Atrens,C.C.Brosnan,S.Ramamurthy,A.Oehlert,I.O.Smith,Meas. Sci.Technol.4(1993)1281–1292.
[38]Q.Liu,B.Irwanto,A.Atrens,Mater.Sci.Eng.A Struct.Mater.617(2014) 200–210.
[39]S.Ramamurthy,A.Atrens,Corros.Rev.31(2013)1–31.
[40]Q.Liu,B.Irwanto,A.Atrens,Corros.Sci.67(2013)193–203.
[41]S.Ramamurthy,W.M.L.Lau,A.Atrens,Corros.Sci.53(2011) 2419–2429.
[42]S.Ramamurthy,A.Atrens,Corros.Sci.52(2010)1042–1051.
[43]E.Villalba,A.Atrens,Eng.Fail.Anal.15(2008)617–641.
[44]Z.F.Wang,A.Atrens,Metall.Mater.Trans.A 27(1996)2686–2691.
[45]S.Ramamurthy,A.Atrens,Corros.Sci.34(1993)1385–1402.
[46]J.Venezuela,Q.Liu,M.X.Zhang,Q.Zhou,A.Atrens,Corros.Sci. 99(2015)98–117.
Received 22 October 2015;accepted 17 November 2015 Available online 9 December 2015
*Corresponding author.Materials Engineering,School of Mechanical and Mining Engineering,The University of Queensland,Brisbane,Qld 4072, Australia.Tel.:+61 7 3365 3748;fax:+61 7 3365 3888.
E-mail address:andrejs.atrens@uq.edu.au(A.Atrens).
http://dx.doi.org/10.1016/j.jma.2015.11.006
2213-9567/©2015 Production and hosting by Elsevier B.V.on behalf of Chongqing University.
©2015 Production and hosting by Elsevier B.V.on behalf of Chongqing University.
猜你喜欢
杂志排行
Journal of Magnesium and Alloys的其它文章
- Semi-continuous casting of magnesium alloy AZ91 using a filtere melt delivery system
- Reducing the tension–compression yield asymmetry of extruded Mg–Zn–Ca alloy via equal channel angular pressing
- Anisotropy of the crystallographic orientation and corrosion performance of high-strength AZ80 Mg alloy
- Characteristics of friction welded AZ31B magnesium–commercial pure titanium dissimilar joints
- Grain growth in calibre rolled Mg–3Al–1Zn alloy and its effect on hardness
- Joining of AZ31 and AZ91 Mg alloys by friction stir welding
