Grain growth in calibre rolled Mg–3Al–1Zn alloy and its effect on hardness
2015-02-16Kshyp
,B.P.Kshyp,
aDepartment of Metallurgical Engineering and Materials Science,Indian Institute of Technology Bombay,Mumbai 400076,India
bDepartment of Mechanical Engineering,Government Polytechnic,Kolhapur 416004,India
cSpecial Materials Division,Vikram Sarabhai Space Center,ISRO,Trivandrum 695022,India
Grain growth in calibre rolled Mg–3Al–1Zn alloy and its effect on hardness
R.L.Doiphodea,b,S.V.S.Narayana Murtyc,N.Prabhua,B.P.Kashyapa,*
aDepartment of Metallurgical Engineering and Materials Science,Indian Institute of Technology Bombay,Mumbai 400076,India
bDepartment of Mechanical Engineering,Government Polytechnic,Kolhapur 416004,India
cSpecial Materials Division,Vikram Sarabhai Space Center,ISRO,Trivandrum 695022,India
Calibre rolling of Mg–3Al–1Zn alloy at 300°C led to development of fin grain size of 3 μm.Subsequent annealing,from 5 to 6000 minutes at 300–450°C,revealed faster grain growth initially up to 60 minutes,which became sluggish on prolonged annealing.The time exponent for grain growth kinetics(n)suggests bi-linear behaviour withn=0.11 and 0.008 over these time scales.The activation energy,based on variousnvalues, varied over wide ranges that made the understanding of the mechanisms for grain growth difficult This problem is explained by concurrent evolution of texture and grain boundary structure.The effect of grain growth on hardness at ambient temperature was found to follow the H–P type relationship.
Annealing;AZ31 Mg-alloy;Calibre rolling;Twinning;Grain growth
1.Introduction
Magnesium is available abundantly in the nature and,owing to high specifistrength,its alloys are becoming popular in aerospace,automobile,biomedical,architecture and electronic industries[1,2].However,these alloys have limitation of poor mechanical processing because of their common hexagonal close packed(HCP)type crystal structure.There exist several processes that are used for plastic deformation.Rolling is one of them and it is used to form the sheets,bars and rods of various shapes.To improve the mechanical properties of rolled material many changes in the conventional rolling process were introduced[3–5],which could influenc the degree of grain refinement Calibre rolling(CR)process is one of the modifie rolling processes.In this technique,a pair of grooved rolls is turned in the opposite directions and the work-piece gets reduced to the desired thickness or cross section over several roll passes by the compressive force.CR is used for mass production of metals with high precision and high strength[6].
The plastic deformation distorts the microstructure,and it causes the thermodynamically unstable state by introducing dislocations and other defects,which leads to increase in stored energy.This energy tends to revert to a stable state on subsequent annealing.This process of annealing results in three phenomena:recovery,recrystallization and grain growth[7].Since the actual number of dislocations removed during recovery is quite small,the change in mechanical properties is limited.The driving force for recrystallization is the removal of a large number of dislocations,and so the associated stored energy removed is quite large.The reduction in grain boundary area, and thus the reduction in grain boundary free energy with increase in grain size,itself provides the driving force for grain growth in polycrystalline materials.This Mg alloyAZ31 exhibits deformation twins,which possess different interfacial energy from the grain boundaries and can also influenc the boundary migration[8]in grain growth process.Various studies [9–11]addressed grain growth in this alloy system.However, no annealing study on grain growth after calibre rolling of this alloy is known.In the present paper,the effects of static annealing at different temperatures and over longer durations were investigated with the aim of investigating the kinetics and mechanisms for grain growth and examining its effect in terms of the Hall–Petch relationship.
Nomenclature
TAnnealing temperatures
tIsothermal annealing time
dGrain size(after annealing)
d0Initial grain size
σyYield strength
kRate constant
nGrowth law index(time exponent)
VGrain boundary migration rate
PDriving force
MIntrinsic mobility of a boundary in the pure material
t0Time at which grain growth would have started on completion of recrystallisation
QActivation energy for grain growth
σ0andkyThe Hall–Petch constants
2.Experimental procedures
Mg-alloyAZ31B in the form of rolled plate of 50 mm thickness and having chemical composition(wt%):Mg–Al 3.0,Zn 1.0 and Mn 0.2 was used.The calibre rolling was carried out at a temperature of 300°C to 12×12 mm2rods(~76%reduction) by a series of 5 roll passes in a rolling mill with reduction of~16%per pass.
The samples of 10×5×5 mm3were cut from the calibre rolled rod.The annealing was carried out at temperatures(T) 300,350,400 and 450°C in a muffl furnace with the accuracy of±2°C.The annealing time(t)used was varied to 5,10,20, 30,60,240,600,1440,2880 and 6000 minutes within the accuracy of±2 seconds.The specimens were quenched in water immediately after annealing to retain the microstructures attained at high temperature.
Metallographic specimen was prepared as per the ASTM procedure.The etching was carried out with acetic picral.The microstructure was examined by Olympus GX51 optical microscope(OM).Grain size measurement was done by mean linear intercept method and the error bars in mean linear intercept, called grain size(d)here,are reported at 95%confidenc level. Electron back scattered diffraction(EBSD)was obtained by scanning electron microscope(SEM)Quanta 3D FEG with EBSD attachment,andTSL software was used for analysis.The misorientation angle and twins were measured in the area 250×250 μm2with a step size of 0.4 μm.
The microhardness measurement was carried out before and after annealing for all the specimens.The machine used was LM300AT,LECO make.The weight used was 15 gm and dwell time was kept at 15 seconds.Yield strength(σy)of the material is determined by the relation[12]: whereσyis in MPa and the hardness measured is in Hv.

3.Results
3.1.Initial microstructure
The microstructure of the as received plate,as shown in Fig.1a,consists of equiaxed grains of average size 33.0±3.0 μm,along with the presence of a large number of twins.CR led to grain refinemen and the equiaxed microstructure developed is shown in Fig.1b.This reveals large reductions in number of twins and grain size to 3.0±0.5 μm,Fig.1b.This grain size will be called as initial grain sized0for further study here.The grain refinemen was observed in the CR condition due to dynamic recrystallization[3].The hardness of the as-calibre rolled material was 84.3 Hv.
3.2.Microstructural evolution by annealing
For all the conditions of temperature and time employed for annealing the microstructures remained equiaxed,but with the increased grain sizes.The evolved grain size will be called asd. The grain size measured after annealing at the temperatures of 300 and 450°C is plotted in Fig.2 as a function of time.The grain growth from 6 to 20 μm was observed for various times and temperatures of annealing.Microstructures after annealing at 300 and 450°C for 5 minutes and 6000 minutes are shown in Fig.3a and b and Fig.3c and d,respectively.The grain size obtained upon annealing at 300°C for 5 minutes was found to be 6.1±1.0 μm whereas it became 16.8±3.0 μm after 6000 minutes of annealing.After annealing at 450°C for the samedurations,these grain sizes were 8.8±1.0 and 20.4±3.0 μm respectively.The grain growth was faster initially up to 60 minutes after which it became sluggish during longer annealing time.
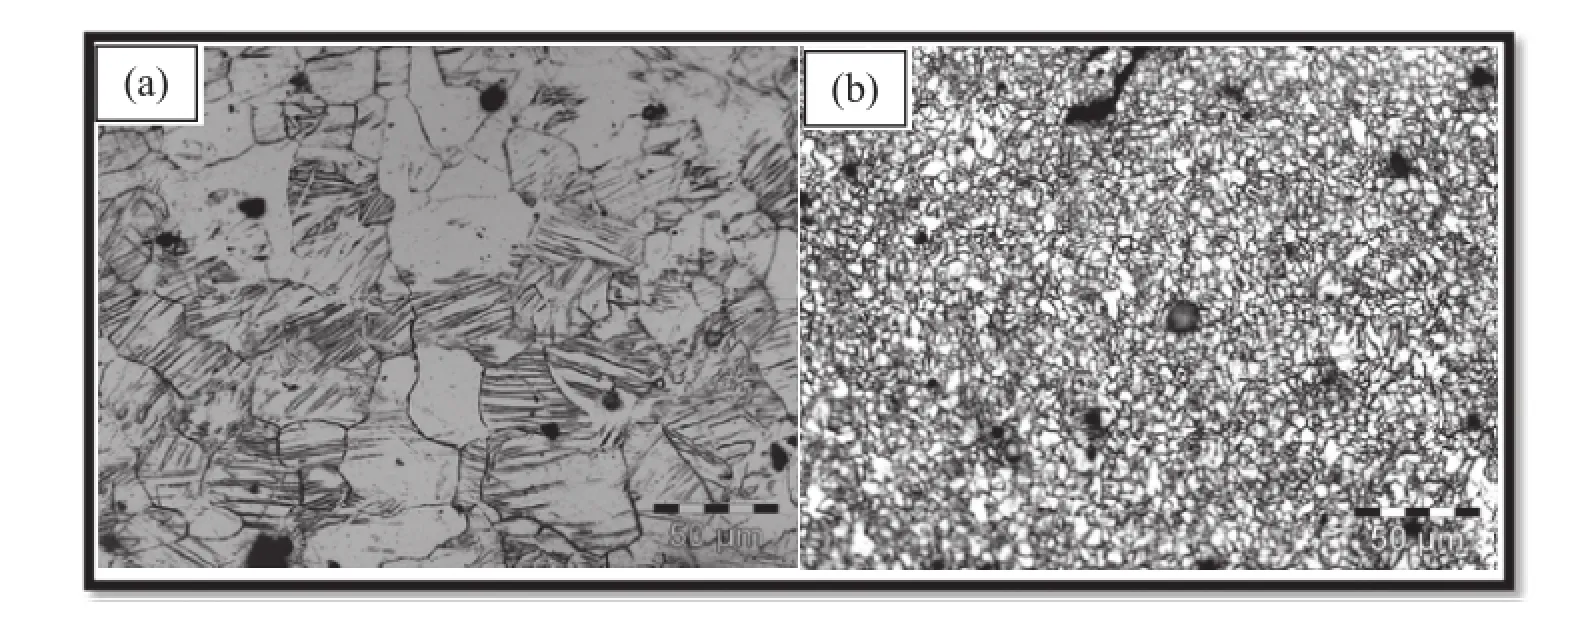
Fig.1.Optical micrographs of the AZ31 Mg-alloy(a)as-received plate and(b)calibre rolled rod at 300°C.
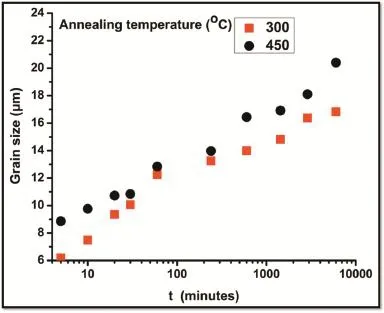
Fig.2.Grain size measured as a function of annealing time at 300 and 450°C.
3.3.Effect of annealing on hardness
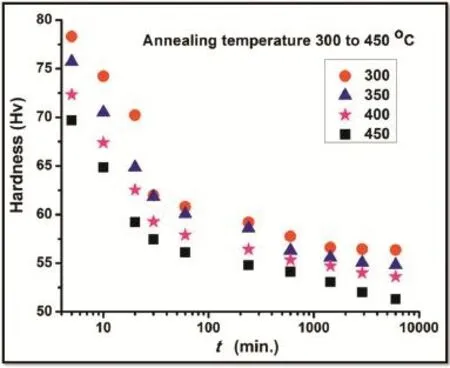
Fig.4.Hardness measured as a function of annealing time at different temperatures.
The hardness measured as a function of annealing time at different temperatures is plotted in Fig.4,which reveals a rapid reduction in hardness up to firs 60 minutes of annealing time and then the change becomes less sensitive to annealing time. The values of micro-hardness after annealing for various lengths of time and at different temperatures were noted to decrease as the grain size increases with the increase in time and temperature of annealing.
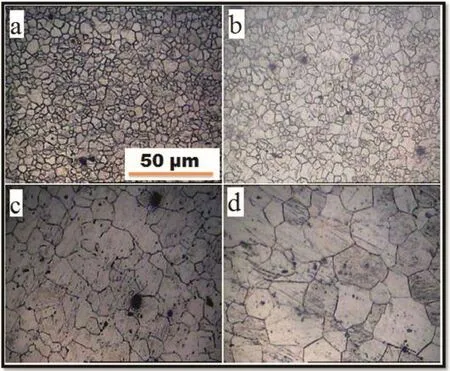
Fig.3.Optical micrographs after annealing for 5 minutes at temperatures(a)300°C and(b)450°C;and for 6000 minutes at temperatures(c)300°C and(d)450°C.
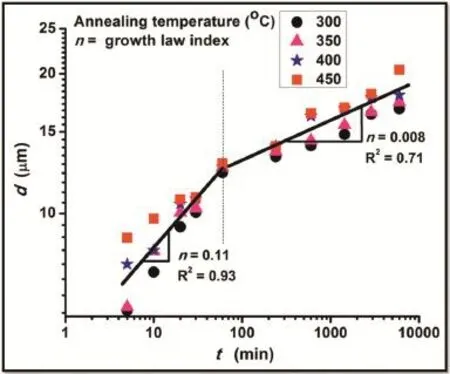
Fig.5.Plot of log d vs log t,giving growth law index“n”after annealing the samples at temperatures of 300–450°C and for time from 5 to 6000 minutes.
4.Discussion
4.1.Grain growth kinetics and mechanisms
As plotted in Fig.5,the variation in grain size with annealing time in log–log scale reveals bilinear behaviour of grain growth kinetics,with the variation in grain size with time exhibitingn=0.11 for the short annealing time(up to 60 minutes)and 0.008 for the longer duration(above 60 minutes).
Normal grain growth data can usually be fitte to an equation of the form:

wheredis the average grain size,kis a rate constant,tis isothermal annealing time andnis the growth law index(time exponent).
If the measured growth law index isn=0.5,as known for pure metals,then the boundary migration of grain growth obeys the relationship:

whereVis the grain boundary migration rate,Pis the driving force for a hypothetically pure material andMis the intrinsic mobility of the boundary in the pure material[13,14].However, these theories do not consider the solute effects on the growth law.Many investigators proposed the theories that consider the solute effects that include:
•The Lücke–Detert theory[15]
•The Gordon and Vandermeer theory[16]
•The Cahn and Lücke–Stüwe theory[8]
The addition of solute,even in the parts per million ranges, was observed to reduce boundary mobility drastically.It is also a common observation that the addition of a small amount of solute increases the measured activation energy for boundary migration to higher values;sometimes much larger than for any identifia le atomistic process.
Rath and Hu[17]pointed out the fact that a linear dependence of grain growth rate on driving force was seldom observed except for grain growth in metals of ultra high purity and at high annealing temperature,near the melting point. These authors also suggested that no meaningful activation energy could be measured for grain growth unless the value ofn=0.5 was employed.They suggested that the temperature dependence of the mobility parameter in grain growth could not be regarded as a single thermally activated process.To understand the mechanism involved in grain boundary migration,Qwas calculated by considering the variants ofn,based on the present work and that reported for pure metals(n=0.5),quasisingle phase(n=0.33)and two-phase(n=0.25)materials [18–20].
The initial grain sized0can only be neglected if it is very small in comparison to grain sizes at long annealing times.But, for short annealing time,thed0is not small enough compared tod.Therefore,the analysis made by using Eq.(2)is not justified Using the appropriated0for each of these grain growth stages, Fig.5,it is found that the data would fi into the equation[21]:

wheret0is the time at which grain growth would have started on completion of recrystallisation.
This relationship can be used to measure the activation energy for grain growth(Q)accurately.The difference(d2−do2) is determined over the range of temperatures.A plot of log (d2−do2)versusT−1(K−1)yields the activation energy for grain growth to vary at various time periods as illustrated in Fig.6. However,it shows very high values of the activation energy. Table 2 lists the values of activation energy calculated by considering growth law index(n),constant(t)and constant(d) approaches.It shows very high values of activation energy. However,in the beginning of grain growth the activation energy was found to be 65–91 kJ mol−1,which is close to the anticipatedQof 92 kJ mol−1reported for grain boundary diffusion in magnesium.
There exist very few studies on annealing of Mg-alloyAZ31 upon processing by various methods of plastic deformation,as summarised in Table 1 from the literature[9–11].The limited studies reported in the literature also exhibit a wide variation in the activation energy for grain growth(29–200 kJ mol−1),as compared to that expected on the basis of grain boundary (92 kJ mol−1)or lattice(135 kJ mol−1)diffusion[1].
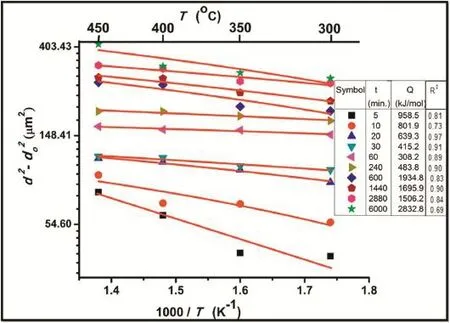
Fig.6.Arrhenius plot to determine the activation energy for grain growth after annealing the samples at temperatures of 300–450°C and for time from 5 to 6000 minutes.
As pointed out earlier for the variation innvalues of kinetics law[18–20],it could also be reasonable to assume that no meaningful value of activation energy for grain growth might appear for the system like AZ31 Mg-alloy,which contains various alloying or impurity elements[22].However,it is interesting to note from Table 2 that grain growth at fi e minutes of annealing,and using the present value ofn=0.1 and so also approaching the calculation by considering either constantdor constant time forQ,givesQ=64.5–90.7 kJ mol−1. These values ofQsupport the grain boundary diffusion to be the mechanism for grain growth.However,n=0.1 does not support the kinetics of grain growth commonly predicted but thisn~0.1 happens to be true for a wide range of materials [19].Further to the theoretical and experimental results on kinetics and mechanisms for grain growth,and the sources of deviations from thereof elaborated in the literature[17–20],in terms ofnandQvalues,the following experimental results and the inferences emerging could add to our understanding of grain growth in this alloy.(i)Twins formed profusely during CR disappear very fast during subsequent annealing.It is during the

Table 1Studies on annealing of Mg alloy AZ31 as summarized from literature.
*ECAP=equal channel angular pressing.process of twinning getting eliminated that the activation energy for grain growth is comparable with that for grain boundary diffusion.The subsequent dramatic change in the value ofQseems to suggest that the structural element of twin boundaries could provide extrinsic grain boundary dislocations to affect the otherwise CR grain boundary structure.Thus,theQvalues on longer annealing time may be affected.(ii)Concurrent to grain growth,texture evolution is seen during annealing as illustrated in Fig.7a by comparing the pole figure obtained upon annealing for 5 min and 6000 min at 300°C. This change in texture could resist grain boundary migration which could occur via the grain interior.(iii)The examination of grain boundary nature by EBSD,Fig.7b,also revealed formation of a greater proportion of low angle boundaries(35%), leaving a lesser proportion of high angle grain boundaries (65%)with the increase in annealing time from 5 min to 6000 min at 300°C.It is known that the rate of migration of high angle grain boundaries is faster than that of low angle boundaries[23,24].This property,in conjunction with the presence of low driving force due to the substantially reduced grain boundary area,can provide greater resistance to grain growth.

Table 2Activation energy calculated considering growth law index(n),constant(t)and constant(d).
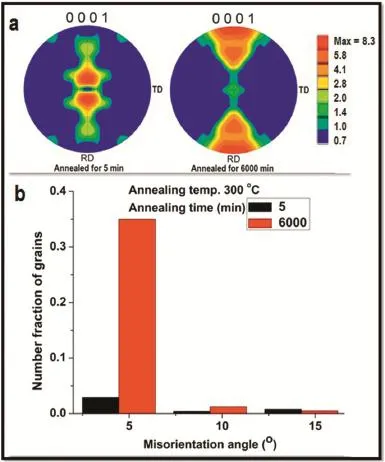
Fig.7.EBSD analysis of the annealed samples at 300°C.(a)Pole figur (0001).(b)Misorientation angle versus number fraction of grains.
4.2.Contributions of grain size and twinning to strength
The grain size(d)dependence of yield strength(σy)is given by Hall–Petch type relationship[25,26]:

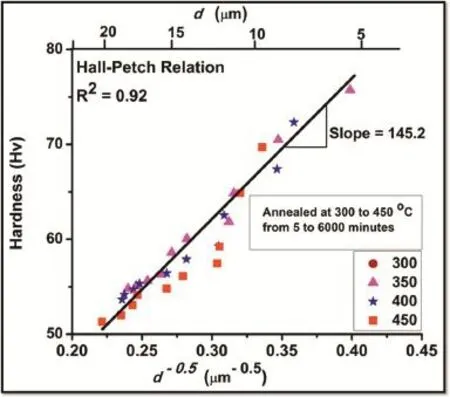
Fig.8.Hall–Petch relationship after annealing of the samples at temperatures of 300–450°C and for time from 5 to 6000 minutes,without distinguishing the temperature effect.
which predicts that as the grain size decreases the yield strength increases.Here,σ0andkyrepresent the Hall–Petch constants having significanc to the strengthening caused by grain interior and grain boundary,respectively.This strengthening by grain refinemen is experimentally found to be true over the grain sizes ranging from 1 mm to 1 μm[27].This relationship is valid for strength,which is also related to hardness.It is seen that the hardness decreases as the grain grows at all the temperatures with increasing time(Fig.4).Micro-hardness is plotted against grain size(d−0.5)irrespective of the annealing temperature in Fig.8.It is seen to clearly obey the Hall–Petch type relationship(R2=0.92),which can be expressed as:
Following the relationship between yield strength and hardness,viz.Eq.(1),the Hall–Petch type relationship for yield strength can be written by putting the values ofσ0andkyin Eq. (5)as:

Similar plots were considered for grain sizes obtained at annealing temperatures of 300,350,400 and 450°C individually,and the Hall–Petch constantsσ0andkywere found to range between 55.8–63.7 MPa and 403.7–447.5 MPa μm−0.5respectively.However,no systematic effect of annealing temperature was noted in the variation ofσ0andky.The large value ofkyexhibits the strong grain size dependence of fl w stress.Therefore,the reduction in strength(hardness)is attributed to the increase in grain size by annealing.As listed in Table 3,there appear wide variations in the values ofσ0andkyin the literature [28–30].The value ofσ0is related to the critical resolved shear stress(CRSS)for the easiest(basal)slip system operatingwithin the grain volume.The value ofkydepends on temperature,texture,composition,preparation method employed for producing the materials,along with its dependence on the CRSS for the nonbasal(more difficult slip systems required to operate near the grain boundary.The values ofσ0andkycan depend in general on the state of the material developed,in the way it was produced by varying the working temperature or thermo mechanical treatments it was subjected to,as is the case for other mechanical properties in general[22].

Table 3Comparison of the present values ofσ0andkyin AZ31 Mg-alloy with the literature.
A close examination of the values ofσ0=59.4 andky=422 MPa μm−0.5in Table 3 reveals that the grain boundary component of strengtheningkyin calibre rolled material is much higher than that reported by other methods of processing of this AZ31 alloy.The source of this enhanced strengthening by grain boundaries is not clear at this stage.However,it appears tempting to think that resistance to grain boundary migration during annealing,requiring much higher activation energy for grain growth,could have its origin in the structural change in grain boundaries.Such change in grain boundary structure,when remains so upon quenching of the annealed material,can contribute to different grain boundary strengthening effect[31].In fact,Sangal and Tangri[32]reported a difference in the effects of grain boundary strengthening between equilibrium and non-equilibrium boundaries in type 316L stainless steel.In the present work,the AZ31 Mg-alloy contains profound number of twins which increase rapidly with increasing annealing time[33].Therefore,probably,the generation of twins introduces additional dislocations into the grain boundaries to become stronger than the otherwise equilibrium grain boundary structure.
5.Conclusion
Grain refinemen in Mg–3Al–1Zn alloy was achieved from 33 μm in as-mill rolled state to 3 μm upon calibre rolling of about 76%at 300°C.Annealing of these samples for 5–6000 minutes at 300–450°C and analyzing the grain growth along with its effect on hardness,at room temperature,leads to the following conclusions:
1.Grain growth occurs from initial grain size of 3 μm up to 20 μm and is faster initially up to 60 minutes,but then becomes sluggish at longer annealing time.The grain growth kinetics law reveals two values of growth law index withn=0.11 for the shorter annealing time(up to 60 minutes)and its marginal decrease(n=0.008)for the longer annealing time(above 240 minutes).
2.The activation energyQfor grain growth was found to be very high for all the growth law indices exceptn=0.1. However,the activation energy in the beginning of grain growth(65–91 kJ mol−1)supports grain boundary diffusion to be the mechanism.At longer annealing time,the exceptionally higher or lower activation energy values arise from other structural evolution in the material.
3.Micro-hardness varies as a function of grain size
following the Hall–Petch type relationship with the equivalent H–P parametersσ0=59.4(Ho=18.4)MPa andky=421.6(kv=145.2)MPa μm−0.5,irrespective of annealing temperature.Thekvfound in the calibre rolled material is much larger than known in this material that was processed by conventional rolling or friction stir
processing.
Acknowledgment
We express our thanks to Dept.of Metallurgy,Government Polytechnic Kolhapur,for providing the testing facility.
[1]H.Friedrich,B.Mordike,Magnesium Technology:Metallurgy,Design Data Applications,Springer Berlin Heidelberg,New York,2006.
[2]C.Blawert,N.Hort,K.U.Kainer,Trans.Indian Inst.Met.57(2004) 397–408.
[3]Q.Miao,L.Hu,G.Wang,E.Wang,Mater.Sci.Eng.A 528(2011) 6694–6701.
[4]X.Huang,G.Haung,D.Xiao,Q.Liu,Mater.Sci.Forum 686(2011) 40–45.
[5]W.Xia,Z.Chen,D.Chen,S.Zhu,J.Mater,Process.Technol.209(2009) 26–31.
[6]Y.Tanno,T.Mukai,M.Asakawa,M.Kobayashi,Mater.Sci.Forum 419 (2003)359–364.
[7]P.Cotterill,P.Mould,Recrystallization and Grain Growth in Metals, Surrey University Press,London,1976.
[8]G.Gottstein,L.Shvindlerman,Grain Boundary Migration in Metals:Thermodynamics,Kinetics,Applications,CRC Press,Florida, 1999.
[9]M.S.Tsai,C.P.Chang,Mater.Sci.Technol.29(2013)759–763.
[10]G.Beer,M.R.Barnett,Scr.Mater.61(2009)1097–1100.
[11]C.Su,L.Lu,M.Lai,Mater.Sci.Technol.23(2007)290–296.
[12]M.A.Mayer,K.K.Chawla,Mechanical Behaviour of Materials,second
ed.,Cambridge University Press,UK,2009.
[13]N.Mott,Proc.Phys.Soc.60(1948)391.
[14]D.Turnbull,Trans.AIME 191(1951)661–665.
[15]K.Lücke,K.Detert,Acta Mater.5(1957)628–637.
[16]P.Gordon,R.Vandermeer,Grain Boundary Migration,Recrystallization,
Grain Growth and Texture,ASM Metals Park,Ohio,1966.
[17]B.Rath,H.Hu,Met.Trans.1(1970)3181–3184.
[18]S.Sengupta,B.P.Kashyap,J.Mater.Sci.Let.10(1991)139–140.
[19]E.Hornbogen,U.Koster,Recrystallization of Metallic Materials,In F.Haessner,(Ed.,)1978.
[20]P.K.Bakshi,B.P.Kashyap,J.Mater.Sci.29(1994)2063–2070.
[21]P.Beck,J.Appl.Phys.19(1948)507–509.
[22]M.M.Avedesian,H.Baker,Magnesium and Magnesium Alloys,ASM Specialty Handbook,ASM International,1999.
[23]H.Gleiter,B.Chalmers,HighAngle Grain Boundaries,Prog.Mater.Sci., Pergamon Press,1972.
[24]V.Sursaeva,S.Protasova,W.Lojkowski,J.Jun,Textur.Microstruct.32 (1999)175–185.
[25]E.O.Hall,Proc.Phys.Soc.London B64(1951)747–753.
[26]N.J.Petch,J.Iron Steel Inst.174(1953)25–28.
[27]C.S.Barrett,T.B.Massalski,Structure of Metals,third ed.,Pergamon Press,Oxford,UK,1980.
[28]N.Afrin,D.Chen,X.Cao,M.Jahazi,Mater.Sci.Eng.A 472(2008) 179–186.
[29]L.Guo,Z.Chen,L.Gao,Mater.Sci.Eng.A 528(2011)8537–8545.
[30]A.Jain,O.Duygulu,D.Brown,C.Tome’,S.Agnew,Mater.Sci.Eng.A 486(2008)545–555.
[31]B.P.Kashyap,Acta Mater.50(2002)2413–2427.
[32]S.Sangal,K.Tangri,Mater.Trans.A 20(1989)479–484.
[33]R.L.Doiphode,S.V.S.N.Murty,N.Prabhu,B.P.Kashyap,Trans.Indian Inst.Met.68(2015)317–321.
Received 7 September 2014;revised 10 November 2015;accepted 12 November 2015 Available online 7 December 2015
*Corresponding author.Department of Metallurgical Engineering and Materials Science,Indian Institute of Technology Bombay,Mumbai 400076, India.Tel.:+91 2225767622;fax:+91 2225723480.
E-mail address:bpk@iitb.ac.in(B.P.Kashyap).
http://dx.doi.org/10.1016/j.jma.2015.11.003
2213-9567/©2015 Production and hosting by Elsevier B.V.on behalf of Chongqing University.
©2015 Production and hosting by Elsevier B.V.on behalf of Chongqing University.
杂志排行
Journal of Magnesium and Alloys的其它文章
- Stress corrosion cracking of high-strength AZ31 processed by high-ratio differential speed rolling
- Semi-continuous casting of magnesium alloy AZ91 using a filtere melt delivery system
- Reducing the tension–compression yield asymmetry of extruded Mg–Zn–Ca alloy via equal channel angular pressing
- Anisotropy of the crystallographic orientation and corrosion performance of high-strength AZ80 Mg alloy
- Characteristics of friction welded AZ31B magnesium–commercial pure titanium dissimilar joints
- Joining of AZ31 and AZ91 Mg alloys by friction stir welding
