Flexural behaviors of FRP strengthened corroded RC beams
2014-09-06PanJinlongWangLupingYuanFangHuangYifang
Pan Jinlong Wang Luping Yuan Fang Huang Yifang
(1Key Laboratory of Concrete and Pre-stressed Concrete Structures of Ministry of Education, Southeast University, Nanjing 210096, China)(2China United Engineering Corporation, Hangzhou 310022, China)
Flexural behaviors of FRP strengthened corroded RC beams
Pan Jinlong1Wang Luping1Yuan Fang1Huang Yifang2
(1Key Laboratory of Concrete and Pre-stressed Concrete Structures of Ministry of Education, Southeast University, Nanjing 210096, China)(2China United Engineering Corporation, Hangzhou 310022, China)
The flexural behavior of eight FRP (fiber reinforced polymer) strengthened RC (reinforced concrete) beams with different steel corrosion rates are numerically studied by Ansys finite element software. The influences of the corrosion rate on crack pattern, failure mechanism, ultimate strength, ductility and deformation capacity are also analyzed. Modeling results show that the beams with low corrosion rates fail by the crushing of the concrete in the compression zone. For the beams with medium corrosion rates, the bond slip between the concrete and the longitudinal reinforcement occurs after steel yielding, and the beams finally fail by the debonding of the FRP plates. For the beams with high corrosion rates, the bond slip occurs before steel yielding, and the beams finally fail by the crushing of the concrete in the compression zone. The higher the corrosion rates of the longitudinal reinforcement, the more the carrying capacity of FRP strengthened RC beams reduces. The carrying capacity of RCB-1 (the corrosion rate is 0) is 115 kN, and the carrying capacity of RCB-7 (the corrosion rate is 20%) is 42 kN. The deformation capacity of FRP strengthened corroded RC beams is higher than that of FRP strengthened uncorroded RC beams. The ultimate deflection of RCB-1 and RCB-7 are 20 mm and 35 mm, respectively, and the ultimate deflection of RCB-5 (the corrosion rate is 10%) reaches 60 mm.
corroded; reinforced concrete beam; FRP (fiber reinforced polymer); strengthening; numerical analysis; flexural behavior
Concrete is one of the most widely used construction materials in civil engineering. Cracking and durability problems are the great challenges for the application of concrete in civil infrastructures[1]. For the durability issues, the corrosion of steel reinforcement is a major durability problem for concrete structures under severe environments. A potential solution of the corrosion problem is the application of the non-corroding fiber reinforced polymer (FRP) as strengthening or reinforcement materials for structural members[2].
The use of the FRP material in structural engineering has attracted great attention due to its high tensile strength, good fatigue performance and inherent corrosion resistance[3]. For corroded RC beams, the bonding of FRP sheets on the tensile side can effectively improve the flexural strength and stiffness, as well as the crack control ability of the beams[4]. Previous studies indicated that the failure modes of FRP strengthened RC beams include the rupture of FRP plates, the crushing of the concrete in the compression zone with or without the tensile steel yielding and debonding of the FRP[5-6]. In this paper, several FRP strengthened RC beams with different steel corrosion rates are numerically studied to investigate the failure mechanism of the beams. With the numerical models, the effect of steel corrosion rate on the ultimate strength, deformation capacity and ductility of the beams are comprehensively studied.
1 Finite Element Models
1.1 Model and material parameters
In the numerical simulations, the dimensions of the beam models are 150 mm in width, 200 mm in height, and 2 200 mm in length. A total of eight FRP strengthened beams are simulated to investigate the influence of the steel corrosion rate on the flexural behaviors. Each beam is loaded under four-point bending with a span of 1 800 mm, and the external loads are applied symmetrically at the locations with 600 mm from the supports[7]. The loading configuration is shown in Fig.1. For the concrete, the Young’s modulus and compressive strength are 30 GPa and 22.9 MPa, respectively. For the FRP sheet, the elastic modulus and the tensile strength are 234 GPa and 4 200 MPa, respectively. Tab.1 shows the mechanical parameters of the steel reinforcement. In this numerical analysis, the constitutive model of the concrete is described by the stress-strain relationship from “Code for design of concrete structures of China (GB 50010—2010)”[8]. The steel reinforcement is assumed to be perfectly elastic-plastic. According to Ref.[9], the yield strength of the corroded reinforcement is calculated by whereαsis the reduction factor of the yield strength of the corroded reinforcement;fy0is the yield strength of the non-corroded reinforcement;As0is the cross section area of the reinforcement. In this numerical analysis, the bond-slip model for the interface element between the steel reinforcement and the concrete is determined based on “CEB-FIB model code 1990”[10]. The bond-slip relationship is shown in Fig.2. The bond-slip relationship between the FRP sheet and the concrete is described by a three-parameter model proposed by Leung and Tung[11], whereτmax,τ0andSmaxare the maximum shear stress, the residual shear stress and the maximum slip, which are assumed to be 9 MPa, 3 MPa and 4 mm, respectively.

Fig.1 Schematic illustration of test setup and specimen details (unit: mm)

SteeltypeDiameter/mmModulusofelasticityEf/GPaYieldstrengthfu/MPaMildbar10210210Deformedbar14200380
Pyc=αsfy0As0
(1)

Fig.2 Bond-slip model between steel and concrete in CEB-FIP code
Eight corrosion rates (0, 2%, 5%, 7%, 10%, 15%, 20% and 25%, which are represented by RCB-1, RCB-2, RCB-3, RCB-4, RCB-5, RCB-6, RCB-7 and RCB-8, respectively) are selected for numerical analysis. The corrosion rate herein is defined by the degree of degradation between the longitudinal reinforcement and the concrete. For example, a corrosion rate of 5% represents that the bond strength of the corroded reinforcement degrades to 95% of that for the non-corroded reinforcement.
1.2 Model setup
According to the symmetry of the beam about its vertical axis, a half of the beam model is set up for numerical analysis. The whole loading process is conducted by displacement control. Elements Solid65, Link8 and Shell63 are selected to simulate the concrete, the steel reinforcement and the FRP sheet, respectively. The nonlinear element Combin39 is adopted to simulate the bond-slip relationship between the concrete and the FRP plate or the steel reinforcement.
2 Simulation Results and Discussions
2.1 Crack patterns and failure modes
The failure modes of the beams can be divided into three types, which can be represented by specimens RCB-1, RCB-5 and RCB-7. Fig.3 shows the crack distributions at different load levels for specimen RCB-1. Flexural cracks first occur at a load of 17.8 kN (see Fig.3(a)). With increasing loading, several inclined flexural shear cracks are found to form in the shear span and extend towards the loading point. Finally, specimen RCB-1 fails by the crushing of the concrete in the compression zone. The final crack pattern of specimen RCB-1 is shown in Fig.3(d).

Fig.3 Crack patterns of RCB-1. (a) 17.8 kN; (b) 43.8 kN; (c) 61.4 kN; (d) 100.0 kN
For specimen RCB-5, flexural cracks are first observed at a load of 12.4 kN (see Fig.4(a)). With increasing external loading, flexural cracks tend to extend from the bottom of the beam to its top surface. However, the bond strength between the concrete and the longitudinal reinforcement decreases with the steel corrosion rate, resulting in a poor interfacial shear stress transfer. Therefore, the cracks of specimen RCB-5 are mainly concentrated near the pure bending region. Specimen RCB-5 finally fails in a brittle manner with the full development of flexural cracks. The final crack pattern of specimen RCB-5 is shown in Fig.4(d).
For specimen RCB-7, flexural cracks are first observed at a load of 11.1 kN (see Fig.5(a)).With increasing external loading, flexural cracks tend to extend from the bottom of the beam to its top surface. Compared with specimen RCB-5(Fig.4(b)), specimen RCB-7 shows a larger amount of flexural and flexural shear cracks under the same load of about 42 kN(see Fig.5(c)).The flexural stiffness of the specimen with a larger steel corrosion rate degrades more quickly due to the weakened stress transferring between the longitudinal reinforcement and the concrete. With further increasing loading, flexural cracks extend to the top surface of the beam(see Fig.5(d)), resulting in the premature failure of the concrete in the compression zone.

Fig.4 Crack patterns of RCB-5.(a) 12.4 kN; (b) 41.2 kN; (c) 66.8 kN; (d) 79.8 kN

Fig.5 Crack patterns of RCB-7.(a) 11.1 kN; (b) 24.8 kN; (c) 42.0 kN; (d) 60.1 kN
2.2 Load-displacement curves
The load-deflection curves for specimens are shown in Fig.6. For the specimens with low corrosion rates (RCB-1, RCB-2, RCB-3 and RCB-4), the load-displacement curves can be divided into three stages. The external load first increases linearly with corresponding deflection before a first cracking load of 10 kN is reached. After that, the slope of the curve drops and keeps almost constant up to a yield load of 80 kN. Beyond yielding, the flexural and flexural shear cracks extend to the top surface of the beam. The inelastic deformation of the beam increases substantially with the increase of the load carrying capacity due to the strengthening effect of the FRP plate. When the load reaches about 115 kN, the beam fails by the crushing of the concrete in the compression zone, which can be considered as a typical flexural failure mode.
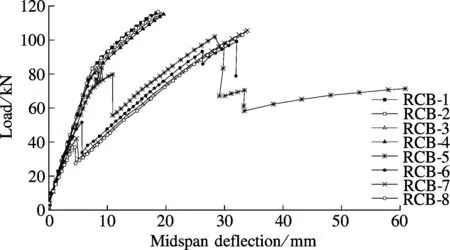
Fig.6 The load-deflection curves of eight specimens
For the specimen with medium corrosion rates (RCB-5), the load-deflection relationship is similar to that of specimen RCB-1 before a yielding load of 75 kN. The flexural stiffness of specimen RCB-5 is lower than that of specimen RCB-1 due to much more flexural and flexural shear cracks formed in specimen RCB-5.When the external load reaches 80 kN, the bond strength between the concrete and the longitudinal reinforcement drops and bond slip occurs, followed by a sudden drop of external loading. After that, the external load increases linearly with corresponding deflection until the ultimate load of 102 kN is reached due to the partial debonding of the FRP plate, followed by the second drop of external loading. The beam finally fails by the full debonding of the FRP plate with a failure deflection of 60 mm.
For the specimen with serious steel corrosion, such as RCB-7, the external load suddenly drops due to the occurrence of the bond slip between the concrete and the longitudinal reinforcement. With the increasing displacement, the external load increases with the deflection of the beam due to the strengthening effect of the FRP plate. When the load reaches about 105 kN, the beam fails by the crushing of the concrete in the compression zone. FRP debonding does not occur during the loading process. It is the full development of flexural deformation that leads to the premature failure of specimen RCB-7.
2.3 Stress and strain development of longitudinal bars
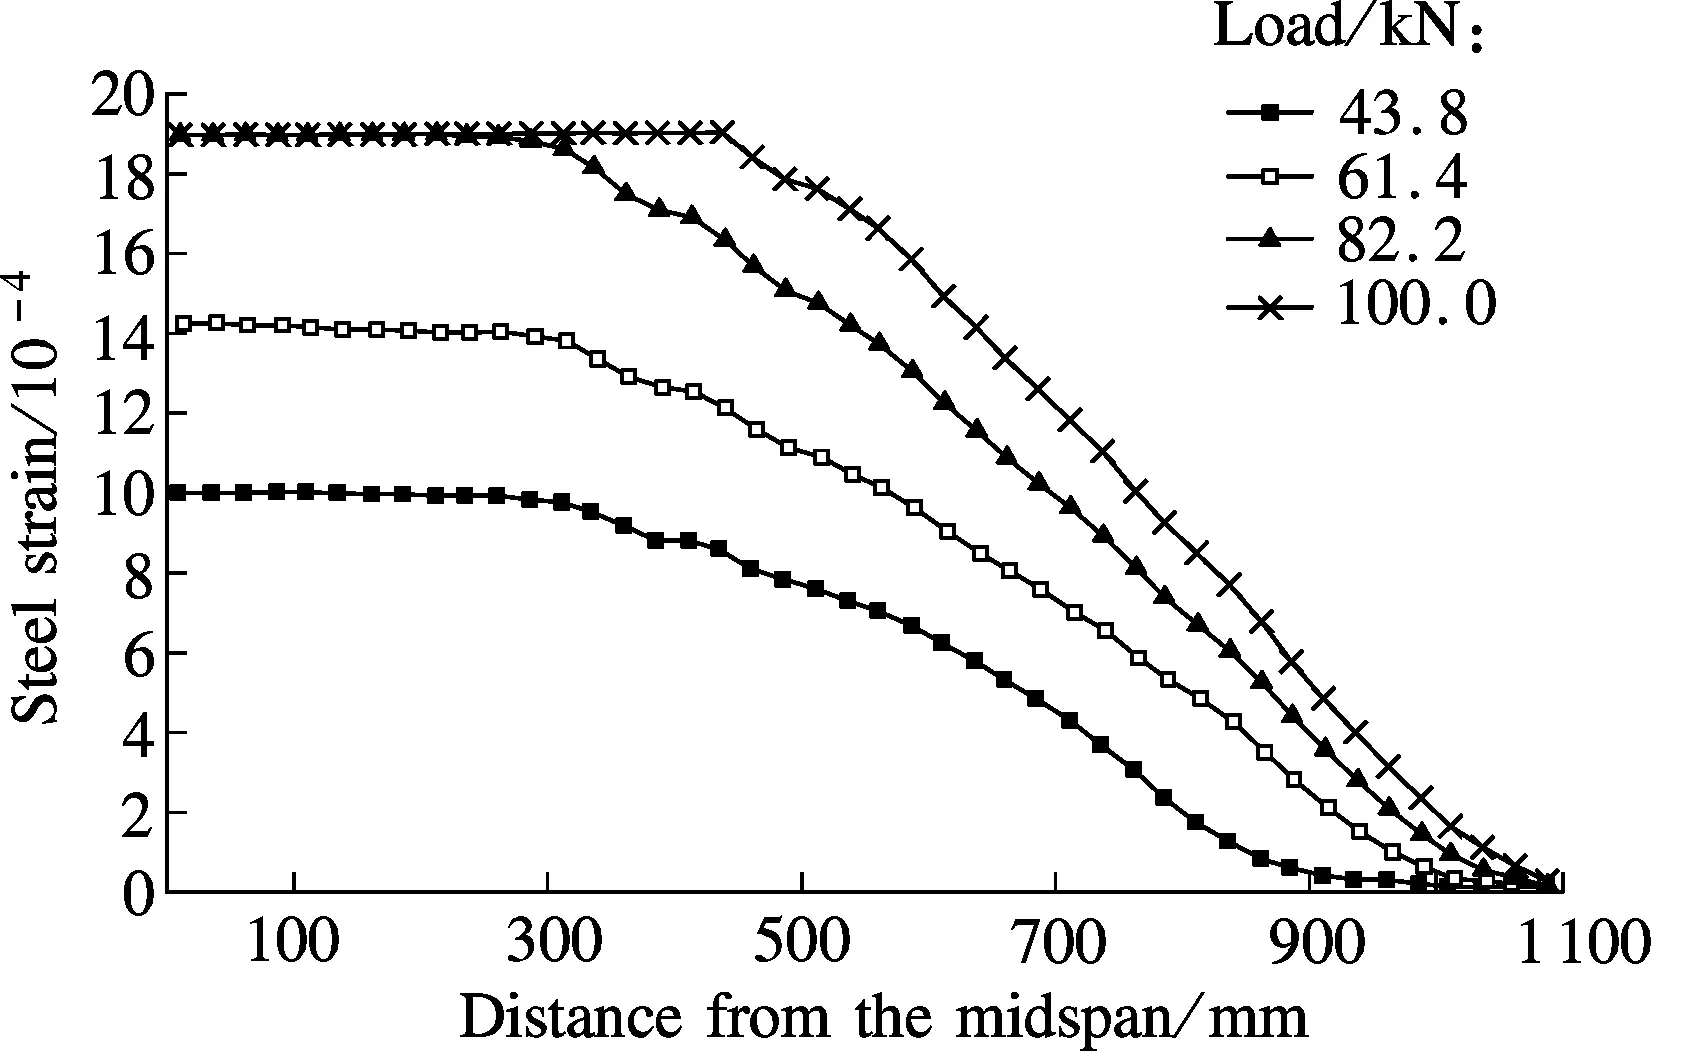
Fig.7(a) shows the strain distributions along the longitudinal bars at different load levels for specimen RCB-1. It can be observed that the strain values in the pure bending region are identical and the strain value in the flexural shear region decreases with the distance from the middle span of the beam. The strain distributions are the same as the moment distributions, which indicates that there is no bond slip between the concrete and the longitudinal reinforcement. Steel yielding occurs when the strain value reaches 1.9×10⁻³and the stress value reaches a yield strength of 380 MPa. From the stress-deflection curve of specimen RCB-1 (see Fig.7(b)), it can be seen that the stress value first increases linearly with the middle span deflection before the yield strength is reached. After that, the slope of the curve stays almost constant up to final failure.
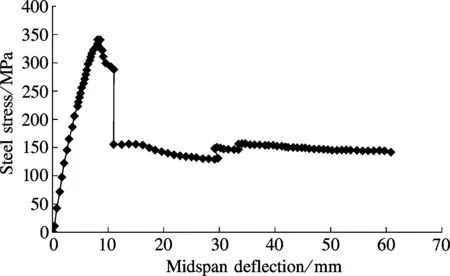
The stress and strain variations in longitudinal bars for specimen RCB-5 are shown in Fig.8. When the external load is lower than 79.8 kN, no sign of slip between the concrete and the longitudinal reinforcement is observed and the strain distributions are identical to those of specimen RCB-1. With increasing external loading, the strain values outside the pure bending region decrease substantially due to the bond slip between the concrete and the longitudinal bars. After that, the increase of deflection results in a decrease in strain values in the pure bending region but has little effect on the strain values outside the pure bending zone. The FRP plate provides a main flexural resistance of the beam in this period. It can be seen from Fig.8(b) that the stress value of the tensile reinforcement at midspan first increases linearly with deflection. After an ultimate stress value of 350 MPa is reached, the stress value decreases with the midspan deflection due to the bond slip between the concrete and the longitudinal bars. With the further increase of deflection, the stress value decreases rapidly due to the debonding of the FRP plate. Afterwards, the stress value keeps almost constant up to final failure.
(a)

(b)
Fig.7 Stress and strain variations in longitudinal bars for specimen RCB-1. (a) Strain distributions along tensile bars; (b) Stress-deflection curve at midspan

(a)
(b)
Fig.8 Stress and strain variations in longitudinal bars for specimen RCB-5. (a) Strain distributions along tensile bars;(b) Stress-deflection curve at midspan
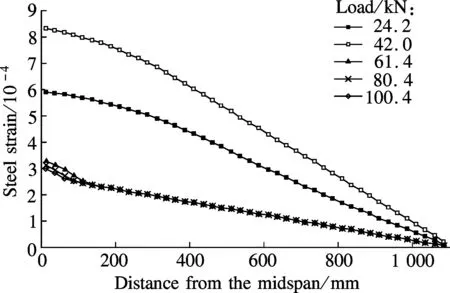
The strain distributions along the tensile reinforcement of specimen RCB-7 are shown in Fig.9(a). The strain values increase with the external loading when the load is lower than 42 kN. The bond strength between the concrete and the longitudinal reinforcement degrades due to the serious corrosion of the steel reinforcement, and the strain values in the pure bending region decrease with the distance from the midspan of the beam. After that, the strain values show a sudden drop due to the bond slip between the concrete and the longitudinal bars. With the increasing external loading, the strain values keep almost constant and the FRP plate makes significant contributions to the ultimate load capacity. From the stress-deflection curve of specimen RCB-7 (see Fig.9(b)), it can be clearly seen that the stress value first increases linearly with the midspan deflection until an ultimate stress of 170 MPa is reached, followed by a sudden drop of external load. The bond slip between the concrete and the longitudinal bars occurs and bond strength degrades rapidly. With the increasing deflection, the stress value of the longitudinal bars keeps constant while the stress value of the FRP plate increases gradually until final compressive failure occurs.
(a)

(b)
Fig.9 Stress and strain variations in longitudinal bars for specimen RCB-7. (a) Strain distributions along tensile bars;(b) Stress-deflection curve at midspan
2.4 Bond stress between concrete and longitudinal reinforcement
Fig.10(a) shows the bond force distributions between the concrete and the longitudinal reinforcement for specimen RCB-1. The bond force herein is defined by the tensile force of the spring element in numerical modeling. In the pure bending region, the bond force maintains around zero before initial flexural cracking is observed. With the increasing external loading, a tiny bond force occurs due to the stress concentration at the vicinity of flexural cracks.

(a)

(b)

(c)
Fig.10 Bond force distributions between concrete and longitudinal reinforcement. (a) RCB-1; (b) RCB-5; (c) RCB-7
In the flexural shear region, the bond force increases in the shear flexural region due to the variation in the tensile stress of the steel reinforcement. It can be seen from Fig.10(a) that there are force fluctuations along the beam span. This is due to the fact that many flexural and flexural shear cracks are found to occur along the beam, leading to stress concentrations along the longitudinal bars. The bond force outside the supports reduces to zero gradually.
The bond force distributions between the concrete and the longitudinal reinforcement at different load levels for specimen RCB-5 are shown in Fig.10(b). When the external load is lower than 79.8 kN, no sign of slip between the concrete and the longitudinal reinforcement is observed and the bond force distributions are identical to those of specimen RCB-1. With the increasing external loading, the bond slip occurs between the concrete and the longitudinal bars, and the bond force increases with the distance from middle span. With the increasing deflection, the bond slip between the concrete and the longitudinal reinforcement increases, and the FRP plate provides more and more contributions to the flexural load capacity. For the regions with large bond slip, bond force degrades to residual bond strength. The region with high bond stress tends to shift towards the midspan with the increasing deflection.
Fig.10(c) shows the bond force distributions at different levels for specimen RCB-7. The bond force between the steel and the concrete increases with the external load, when the load is smaller than 42 kN. The bond force is very large outside the pure bending region due to the moment variations. With the increasing external loading, the bond slip increases with the distance from the midspan. As a result, the bond force outside the pure bending region degrades to residual bond strength. The region with high bond stress between the steel reinforcement and the concrete is close to the midspan. In this stage, the FRP plate plays an important role in resisting external loading.
2.5 Strain distribution of FRP sheet and bond-slip behavior between concrete and FRP plate
Fig.11(a) shows the strain distributions along the FRP sheet at different load levels for specimen RCB-1. The strain values keep almost constant in the pure bending region but decrease with the distance from the midspan outside the pure bending region. The strain distributions are similar to the moment distributions of the beam, which indicates a good deformation compatibility between the FRP and the concrete. Fig.11(b) shows the bond force distributions between the FRP plate and the concrete for specimen RCB-1. It is clearly seen that the bond force in the pure bending region stays around zero, but is much larger in the flexural shear region due to the moment variations. In addition, the development of flexural shear cracks results in bond force fluctuation along the FRP plate.

(a)

(b)
Fig.11 Strain and bond force distributions for specimen RCB-1. (a) Strain distributions of FRP plate; (b)Bond force distributions between FRP plate and concrete
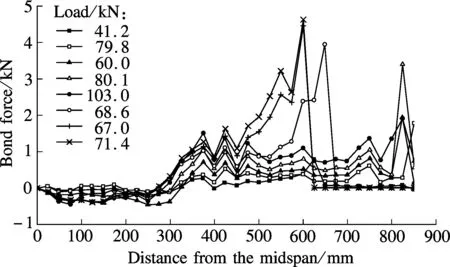
The strain distributions of the FRP plate for specimen RCB-5 are shown in Fig.12(a). When the external load is lower than 103.0 kN, no sign of slip between the concrete and the FRP sheet is observed and the strain distributions are identical to those of specimen RCB-1. With the increasing external loading, FRP debonding occurs at the end of the FRP plate. As a result, the strain values of the FRP plate reduces to zero in the FRP debonding region. Outside the FRP debonding region, the strain values also reduce substantially due to the sudden drop of flexural resistance. Fig.12(b) shows the bond force distributions between the FRP plate and the concrete for specimen RCB-5. Before FRP debonding, the bond force between the FRP sheet and the concrete increases with the external load. After FRP debonding, the bond force reduces to zero in the FRP debonding region and the region with the concentration of bond stress propagates towards the crack tip of interfacial debonding. The debonding of the FRP plate leads to a substantial drop of flexural resistance of the beam but has little effect on the bond force between the FRP plate and the concrete in the flexural bending region.
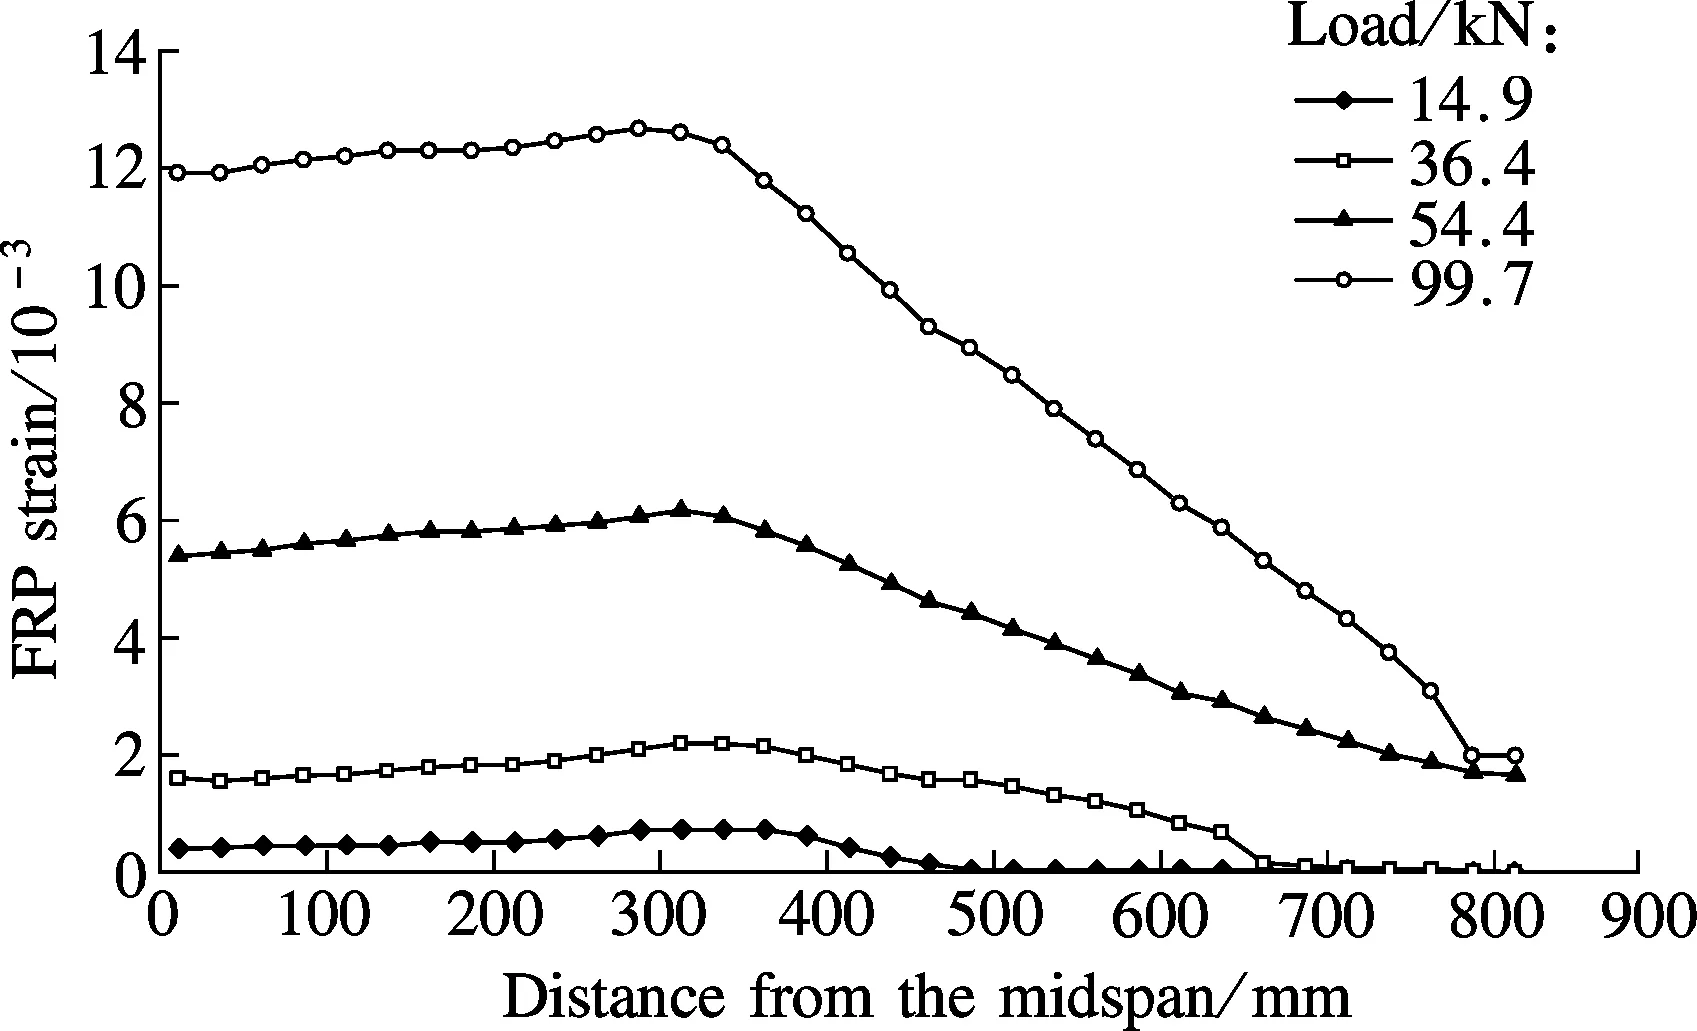
Fig.13(a) shows the strain distributions along the FRP plate at different load levels for specimen RCB-8. The strain values of specimen RCB-8 are greater than those of specimen RCB-1 under the same load level. As a result of serious corrosion, the bond strength between the concrete and the longitudinal reinforcement of specimen RCB-8 degrades and the FRP plate provides a sufficient flexural resistance to the beam. No sign of sudden strain drop of the FRP plate is observed during the loading process, indicating that the debonding of the FRP plate does not occur. Fig.13(b) shows the bond force distributions between the FRP plate and the concrete for specimen RCB-8. It is seen from Fig.13(b) that the bond force increases with the external load. Under the same load level, the bond force between the FRP plate and the concrete of specimen RCB-8 is much larger than that of specimen RCB-1 due to the bond slip between the concrete and the longitudinal reinforcement of specimen RCB-8.

(a)
(b)
Fig.12 Strain and bond force distributions for specimen RCB-5. (a) Strain distributions of FRP plate; (b) Bond force distributions between FRP plate and concrete
(a)

(b)
Fig.13 Strain and bond force distributions for specimen RCB-8. (a) Strain distributions of FRP plate; (b) Bond force distributions between FRP plate and concrete
3 Conclusion
In this paper, the beams with low corrosion rates (lower than 7%) fail by the crushing of the concrete in the compression zone. For the beam with a corrosion rate of 10%, the bond slip between the concrete and the longitudinal reinforcement occurs after steel yielding and it finally fails by the debonding of the FRP plate. For the beam with a serious corrosion rate (20%), the bond slip between the concrete and the longitudinal reinforcement occurs before yielding and flexural cracks extend to the bottom of the top surface of the beam, resulting in the premature failure of the concrete in the compression zone. The flexural resistance and stiffness of the beam decreases with the steel corrosion rate due to the weakened mechanical performance of the corroded reinforcement and poor bond strength between the concrete and the longitudinal reinforcement. However, the increase of the corrosion rate results in better deformation ability. The beam with a corrosion rate of 10% shows a significantly improved deformation ability due to the fully debonding of the FRP plate without the crushing failure of the concrete in the compression zone.
[1]Mehta P K. Reducing the environmental impact of concrete [J].ConcreteInternational, 2001, 23(10): 61-66.
[2]Ritchie P A, Thomas D A, Lu L W, et al. External reinforcement of concrete beams using fiber reinforced plastics [J].ACIStructuralJournal, 1991, 88(4): 490-500.
[3]Hollaway L C. The evolution of and the way forward for advanced polymer composites in the civil infrastructure [J].ConstructionandBuildingMaterials, 2003, 17(6): 365-378.
[4]Chajes M J, Thomson T A Jr, Januszka T F, et al. Flexural strengthening of concrete beams using externally bonded composite materials [J].ConstructionandBuildingMaterials, 1994, 8(3): 191-201.
[5]Teng J G, Chen J F, Smith S T, et al.FRP:strengthenedRCstructures[M]. Weinheim, Germany: Wiley-VCH, 2002.
[6]Smith S T, Teng J G. FRP-strengthened RC beams. Ⅰ: review of debonding strength models [J].EngineeringStructures, 2002, 24(4): 385-395.
[7]Wang X G, Gu X L, Zhang W P. Flexural stiffness of corroded reinforced concrete beams strengthened with carbon fiber composite sheets [J].JournalofBuildingStructures, 2009, 30(5): 169-176.
[8]Ministry of Housing and Urban-Rural Development of the People’s Republic of China. GB 50010—2010 Code for design of concrete structures [S]. Beijing: China Architecture and Building Press, 2010. (in Chinese)
[9]Xi’an University of Architecture and Technology. CECS220:2007 Standard for durability assessment of concrete structure [S]. Beijing: China Architecture and Building Press, 2007. (in Chinese)
[10]Comité euro-international du béton. CEB-FIP model code 1990: design code [S]. London: FIB-Féd. Int. du Béton, 1993.
[11]Leung C K, Tung W K. Three-parameter model for debonding of FRP plate from concrete substrate [J].JournalofEngineeringMechanics, 2006, 132(5): 509-518.
FRP加固锈蚀钢筋混凝土梁的受弯性能分析
潘金龙1王路平1袁 方1黄毅芳2
(1东南大学混凝土及预应力混凝土教育部重点实验室,南京210096) (2中国联合工程公司,杭州310022)
采用Ansys有限元软件对8根不同锈蚀率的FRP片材加固钢筋混凝土梁的受弯性能进行数值分析,研究纵筋锈蚀率对FRP加固梁的裂纹开展、破坏模式、承载能力以及延性和变形能力的影响.研究结果表明:低钢筋锈蚀率的梁发生受压区混凝土压碎破坏;中等锈蚀率的梁钢筋屈服后,钢筋与混凝土界面发生黏结滑移,最后FRP剥离破坏;高锈蚀率的梁钢筋没有达到屈服强度便发生黏结滑移,最后发生受压区混凝土压碎破坏.钢筋锈蚀越严重,FRP加固钢筋混凝土梁的承载力降低得越多.试件RCB-1(锈蚀率为0)的承载力为115 kN,而试件RCB-7(锈蚀率为20%)的承载力仅为42 kN.与FRP加固未锈蚀的钢筋混凝土梁相比,FRP加固锈蚀钢筋混凝土梁的变形能力较高.试件RCB-1和试件RCB-7的最大跨中挠度分别为20 mm和35 mm,而试件RCB-5(锈蚀率为10%) 的最大跨中挠度达到了60 mm.
锈蚀钢筋混凝土梁;FRP;加固;数值分析;受弯性能
TU375
s:The National Natural Science Foundation of China (No.51278118), Scientific and Technological Research Project of Ministry of Education (No.113028A), the Natural Science Foundation of Jiangsu Province (No.BK2012756), the Program for Special Talents in Six Fields of Jiangsu Province (No.2011-JZ-010).
:Pan Jinlong, Wang Luping, Yuan Fang, et al. Flexural behaviors of FRP strengthened corroded RC beams[J].Journal of Southeast University (English Edition),2014,30(1):77-83.
10.3969/j.issn.1003-7985.2014.01.015
10.3969/j.issn.1003-7985.2014.01.015
Received 2013-11-07.
Biography:Pan Jinlong (1976—), male, doctor, professor, jinlongp@gmail.com.
猜你喜欢
杂志排行
Journal of Southeast University(English Edition)的其它文章
- Wavelet transform and gradient direction based feature extraction method for off-line handwritten Tibetan letter recognition
- Analyses of unified congestion measures for interrupted traffic flow on urban roads
- Conditional autoregressive negative binomial model for analysis of crash count using Bayesian methods
- Design and analysis of traffic incident detection based on random forest
- Biodegradation of microcystin-RR and-LR by an indigenous bacterial strain MC-LTH11 isolated from Lake Taihu
- Inverse kinematic deriving and actuator control of Delta robot using symbolic computation technology
