Design and analysis of traffic incident detection based on random forest
2014-09-17LiuQingchaoLuJianChenShuyan
Liu Qingchao Lu Jian Chen Shuyan
(Jiangsu Key Laboratory of Urban ITS, Southeast University, Nanjing 210096, China)
(Jiangsu Province Collaborative Innovation Center of Modern Urban Traffic Technologies, Nanjing 210096, China)
T raffic incident detection is important in the modern ITS.Here the traffic incidents are defined as a traffic congestion phenomenon by occasional events,such as traffic accidents, car breakdowns, scattered goods, and natural disasters[1].Freeway and arterial incidents often occur unexpectedly and cause undesirable congestion and mobility loss.If the abnormal condition cannot be detected and fixed in time,it may increase traffic delay and reduce road capacity,and it often causes second traffic accidents.Therefore, traffic incident detection plays an important role in most advanced freeway traffic management systems.
The artificial intelligence algorithm is one of the recent developed algorithms in traffic incident detection,which can detect incidents by either a rule-based algorithm or a pattern-based algorithm.Traffic incident detection networks usually are multi-layer feed forward neural networks(MLF),and signals are input to the neural network, which has previous data, and the signals are weighted and propagated to an output signal,suggesting either incident or incident-free conditions[2].Some techniques based on artificial intelligence are adopted to detect traffic incidents.Srinivasan et al.[3]evaluated the incident detection performances of three promising neural network models:the MLF,the basic probabilistic neural network(BPNN)and the constructive probabilistic neural network(CPNN)and drew a conclusion that the CPNN model had the highest potential in the freeway incident detection system.
Although the artificial neural networks have achieved better performances than the classical detection algorithms,there are two defects limiting its wide application.The defects are that artificial neural networks cannot afford a clear explanation of the principle about how their parameters adjust,and it is difficult to obtain the optimal parameters of the neural networks.Payne et al.[4]used decision trees for the traffic incident detection[4].The algorithm in Ref.[4]uses the decision trees with states,and the states correspond to distinct traffic conditions.Chen et al.[5-6]used decision tree learning for freeway automatic incident detection in 2009,and the decision tree was used as a classifier.Compared with the artificial neural networks,their method not only avoids the burden of adjusting appropriate parameters,but also improves the average performance of traffic incident detection.However,the defects of the decision tree learning algorithm include two aspects:the classification strength of a decision tree is low and the decision tree is easy to overfit.In order to solve these two problems,we adopt random forest to detect traffic incidents,which is based on a decision trees ensemble.
1 Random Forest for Traffic Incident Detection
1.1 Principle of random forest
Breiman[7]proposed the random forest algorithm in 2001.Random forest is an ensemble of unpruned classification trees,which is induced from bootstrap samples of the training data,and it uses random feature selection in the tree induction process.Prediction is made by aggregating the predictions of the ensemble.The common element in all of these procedures is that for thek-th tree,a random vector Θkis generated, independent of the past random vectors Θ1,…,Θk-1but with the same distribution;and a tree is grown using the training set and Θk,resulting in a classifierh(x,Θk), where x is an input vector.Decision trees in the random forest model are generated by the bagging algorithm.Bagging(bootstrap aggregating)is a classic algorithm in machine learning.It is an ensemble method for multiple classifiers.For more details, refer to Ref.[8].For instance, in the bagging algorithm, the random vector Θ is generated as the counts inNboxes resulting fromNdarts thrown randomly at the boxes,whereNis the number of examples in the training set.In random split selection, Θ consists of a number of independent random integers between 1 andK.The nature and dimensionality of Θ depend on its use in tree construction.After a large number of trees are generated,they vote for the most popular class[7].
Random forest is a classifier consisting of a collection of tree-structured classifiers{h(x,Θk),k=1,2,…},where the vectors{Θk}are independent identically distributed random vectors,and each tree casts a unit vote for the most popular class at input x.Given an ensemble of classifiersh1(x),h2(x),…,hk(x), and with the training set drawn randomly from the distribution of the random vector{X,Y}the margin function is defined as
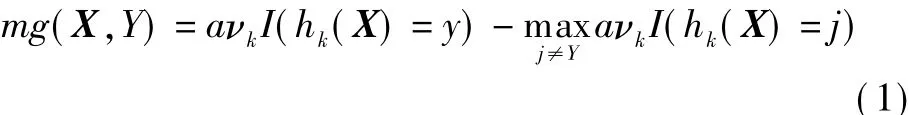
whereI(·)is the indicator function.The margin measures the extent to which the average number of votes at X,Yfor the right class exceeds the average vote for any other class.The larger the margin,the more the confidence in the classification.The generalization error is given by

where subscripts X,Yindicate that the probability is over the X,Yspace.In random forest,hk(X)=h(X,Θk).For a large number of trees,it follows the strong law of large numbers and the tree structure that,as the number of trees increases,for almost all sequences Θ1,…,Θk-1,PE*converges to
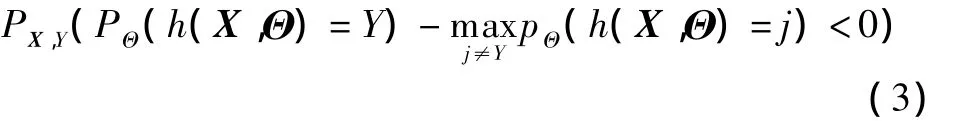
The result of Eq.(3)explains why random forest does not overfit as more trees are added,but produces a limit value of the generalization error.That is to say,random forest can compensate for the defect of the decision tree.An upper bound for the generalization error is given by
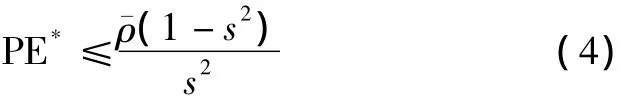
whereis the mean value of the correlation;sis the strength of the set of classifiers{h(x,Θ)}.
It shows that the two ingredients involved in the generalization error for random forest are the strength of the individual classifier in the forest and the correlation between them in terms of the raw margin functions.If random forest wants to get larger classification strength,the correlation of each decision tree classifier must be smaller.To obtain a smaller correlation,the differences between each decision tree must be larger.
Suppose that for an incident detection problem,we define three different decision treesh(x,Θ1),h(x,Θ2)andh(x,Θ3).We can combine these trees in a way to produce a classifier that is superior to any of the individual trees by voting.In other words,the value of x is classified to the class that receives the largest number of votes.As shown in Fig.1,the predictor space is divided into three regions.In the first region,R1 and R2 classify correctly but R3 is incorrect;in the second region,R1 and R3 are correct but R2 incorrect;and in the third region,R2 and R3 are correct but R1 is incorrect.If a test point is equally likely to be in any of the three regions,each of the individual trees will be incorrect one third of the time.However,the combined tree will always give the correct classification.Of course,there is no guarantee that this will occur and it is possible(though uncommon)for the combined classifier to produce an inferior performance.So random forest can basically compensate for the problem of classification strength and improve the classification accuracy.

Fig.1 Vote procedure diagram
1.2 Construction of data sets for training and testing
The incident is detected based on section,which means that the traffic data collected from two adjacent detectors,the up-stream detector and the down-stream detector,are used for calibration and testing.The traffic data consists of at least the items as follows:
· Time when data collectedti,i=1,2,…,n;
· Speed,volume and density of the up-stream detectorsupi,vupi,dupi,i=1,2,…,n;
· Speed,volume and density of the down-stream detectorsdni,vdni,ddni,i=1,2,…,n;
· Traffic stateLi,i=1,2,…,n.
where the item of traffic state is a label.The value of the label is-1 or 1,referring to the non-incident or incident,respectively,which is determined by the incident dataset.Typically,the model is fit for part of the data(the training set),and the quality of the fit is judged by how well it predicts the other part of the data(the test set).The entire data set is divided into two parts:a training set that is used to build the model and a test set that is used to test the model's detection ability.The training set consists of 45 518 samples including 43 418 non-incident instances and 2 100 incident instances(22 incident cases)and the test set consists of 45 138 samples including 43 102 non-incident instances and 2 036 incident instances(23 incident cases).The test set is separated from the data and is not used to monitor the training process.This process prevents any possibility that the best regression models selected may have a chance correlation to peculiarities in the measurements of the test set and reduces the risk of over fitting.
The number of X-variables(predictor variables)is 7.This means that the matrix X used in training the model has the size of 45 518×7.The test data X forms a matrix with a size of 45 138×7.The formal description of matrices X and Y can be written as follows:where each row is composed of one observation;nis the number of instances;andyi∈{-1,1}.The data analysis problem is related to matrix Y,which is predicted by some function of matrix X(e.g.traffic state)using the data of X,y=f(x).The training set is used to develop the random forest model that is in turn used to detect incidents for the test set samples.The output values of detection models are then compared with the actual ones for each of the calibration samples,and the performance measures are calculated and compared.
2 Performance Measures
2.1 Definition of DR,FAR,MTTD and CR
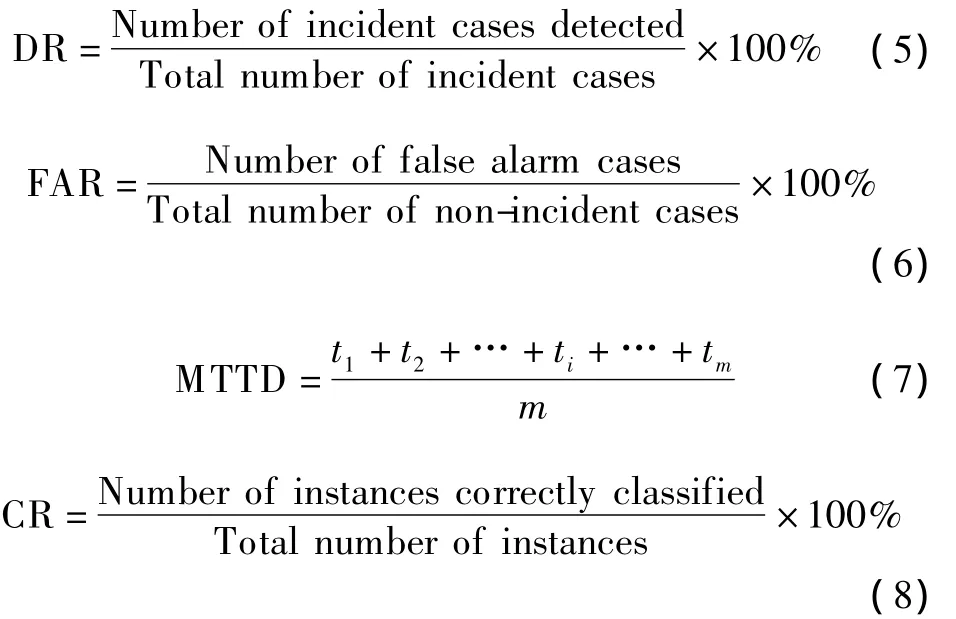
Four primary measures of performance,namely,the detection rate(DR),the false alarm rate(FAR),the mean time to detection(MTTD)and the classification rate(CR)are used to evaluate traffic incident detection algorithms.We cite the definitions as[9]
2.2 ROC curves
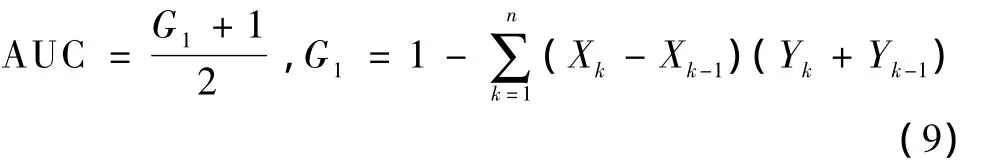
Receiver operator characteristic(ROC)curves illustrate the relationship between the DR and the FAR.Often the comparison of two or more ROC curves consists of either looking at the area under the ROC curve(AUC)or focusing on a particular part of the curves and identifying which curve dominates the other in order to select the best-performing algorithm.It is also equivalent to the Wilcoxon test of ranks.The AUC is related to the Gini coefficientG1,
2.3 Statistics indicators
In statistics,the mean absolute error(MAE)is a quantity used to measure how forecasts or predictions are close to the eventual outcomes.The mean absolute error is given by

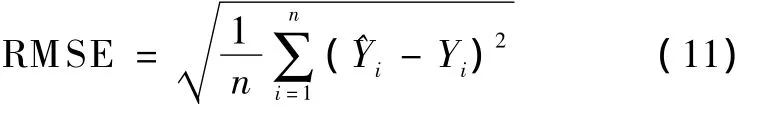
The root-mean-square error(RMSE)is a frequently used measure of the differences between values predicted by a model or an estimator and the values actually observed.These individual differences are called residuals when the calculations are performed over the data sample that is used for estimation,and are called prediction errors when computed out-of-samples.The RMSE serves to aggregate the magnitudes of the errors in predictions for various times into a single measure of predictive power.
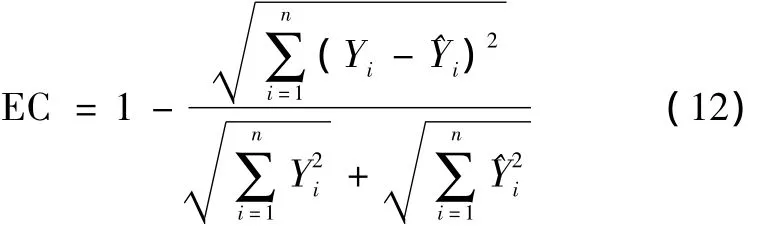
The equality coefficient(EC)is useful for comparing different forecast methods.For example,whether a fancy forecast is in fact any better than a naïve forecast repeat-ing the last observed value.The closer to 1 the value of EC,the better the forecast method.A value of zero means that the forecast is no better than a naïve guess.
3 Case Study
In this section,we perform three groups of experiments:the first experiment compares decision tree with random forest,the second experiment compares random forest detection performance from the perspective of the number of trees,and the last experiment compares MLF with random forest.Three experiments are performed on I-880 real data to investigate the performance of the random forest method.Evaluation indicators include DR,FAR,MTTD,CR,ROC and AUC.Compared with the other four indicators,ROC and AUC can comprehensively evaluate the performances.
3.1 Data description
The data was collected by Petty et al.at the I-880 Freeway in the San Francisco Bay area,California,USA.This is the most recent and probably most well-known freeway incident data set collected,and it has been used in many researches related to incident detection.
3.2 Experiment 1
The number of trees in the group of experiments is from 10 to 100.We increase the number of trees in order to obtain a greater difference.Five performance measures,DR,FAR,MTTD,CR and AUC are computed for different numbers of trees,which are shown in Tab.1.It is observed that different numbers of trees yield similar classification rates,and random forest obtains a better CR.As FAR is concerned,0.87%of the FAR yield by 40 trees is the best one.10 trees obtains the lowest MTTD with 0.84 min;however,the MTTD of 100 trees is obviously longer than that of 10 trees.The DR of 100 trees is 92.09% ,which is the best.The AUC of 100 trees is 94.69% ,which is also the best.Among five comparisons,RF-100 outperforms the other RF methods in DR,CR and AUC.To a certain extent,it can be concluded that the one with the larger number can obtain greater classification strength and slightly better incident detection ability.In the I-880 data set,when the tree number is 100,it can obtain some improvement except in the case of FAR.
Next,we compare the performance of random forest by ROC curves.ROC graphs plot FAR on thex-axis and DR on they-axis.Fig.2(a)illustrates DR vs.FAR,whereit is the total ROC and Fig.2(b)is the part enlarged corresponding to FAR from 0%to 0.1% .It is seen from Fig.2 that 100 trees is slightly superior to others,since its curve is higher than that of others and very close to the coordinate point(0,1)at the far left of the figure,which means that it achieves a higher detection rate at the same false alarm rate.We ran 50 replications of 10-fold crossvalidation to assess the error rate for a range of trees numbers with I-880 data.Tree number is from 10 to 100 in this case.In 10-fold cross-validation,the training set is split into 10 approximately equal partitions and each in turn is used for testing and the remainder is used for training.In the end,every instance is used exactly once for testing.

Tab.1 Comparison of different numbers of trees
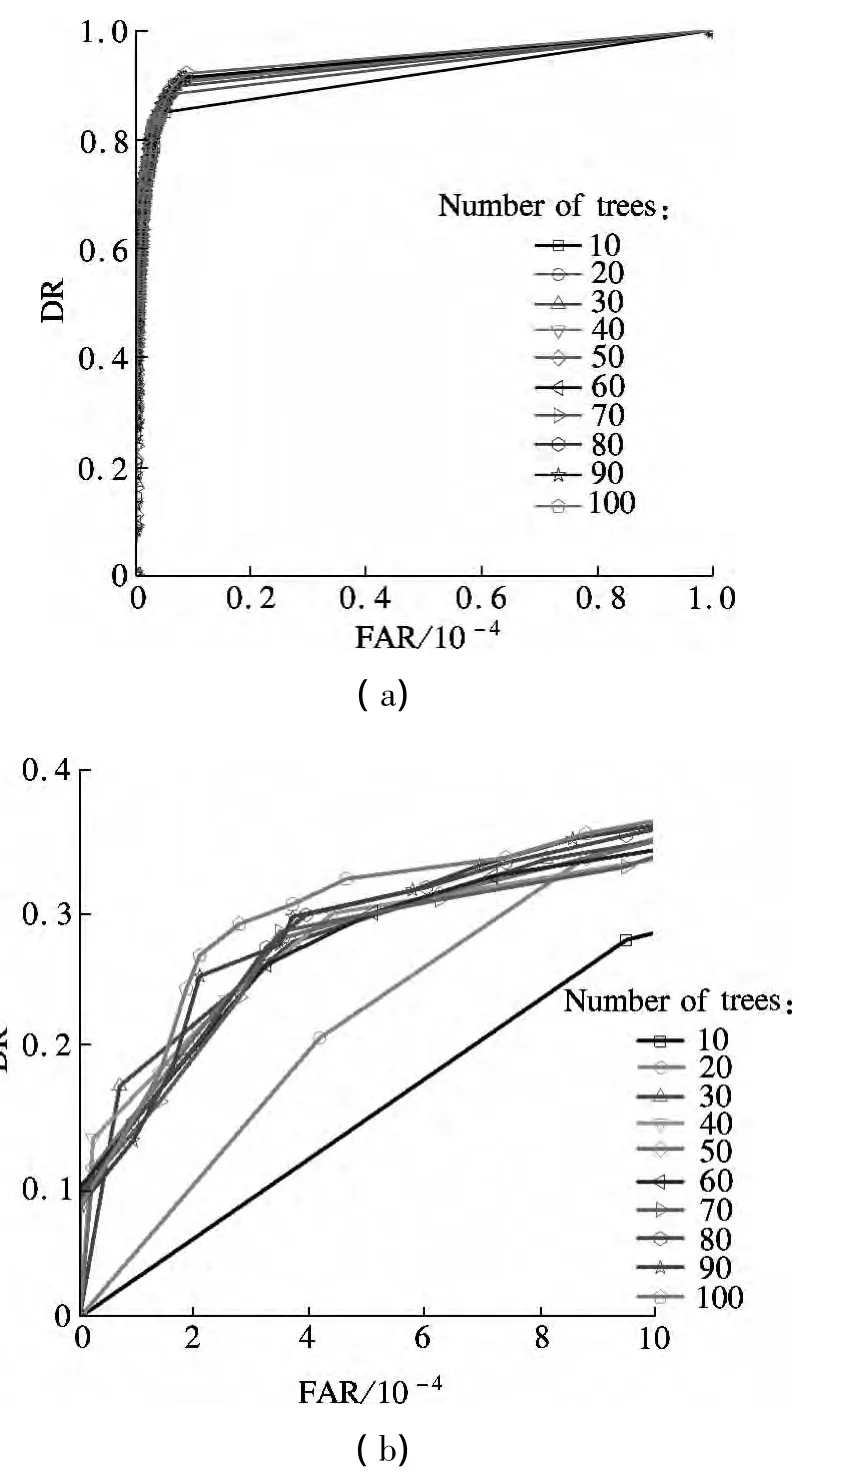
Fig.2 Comparison of different numbers of trees.(a)Total ROC curve;(b)Part enlarged of ROC curve
Figs.3(a)to(h)show box plots of the error rates.Horizontal lines inside the boxes are the median error rates.Figs.3(a)to(e)are incident detection indicators,which are different degrees of growth except for FAR.When the number of trees is fewer than 70,DR,CR and AUC grow relatively fast.FAR fluctuates around the median error rate 0.093.In Figs.3(f)to(h),MAE and RMSE decrease gradually and reach the lowest when the tree number is 100.The value of EC is very close to 100,which shows that random forest is highly effective.
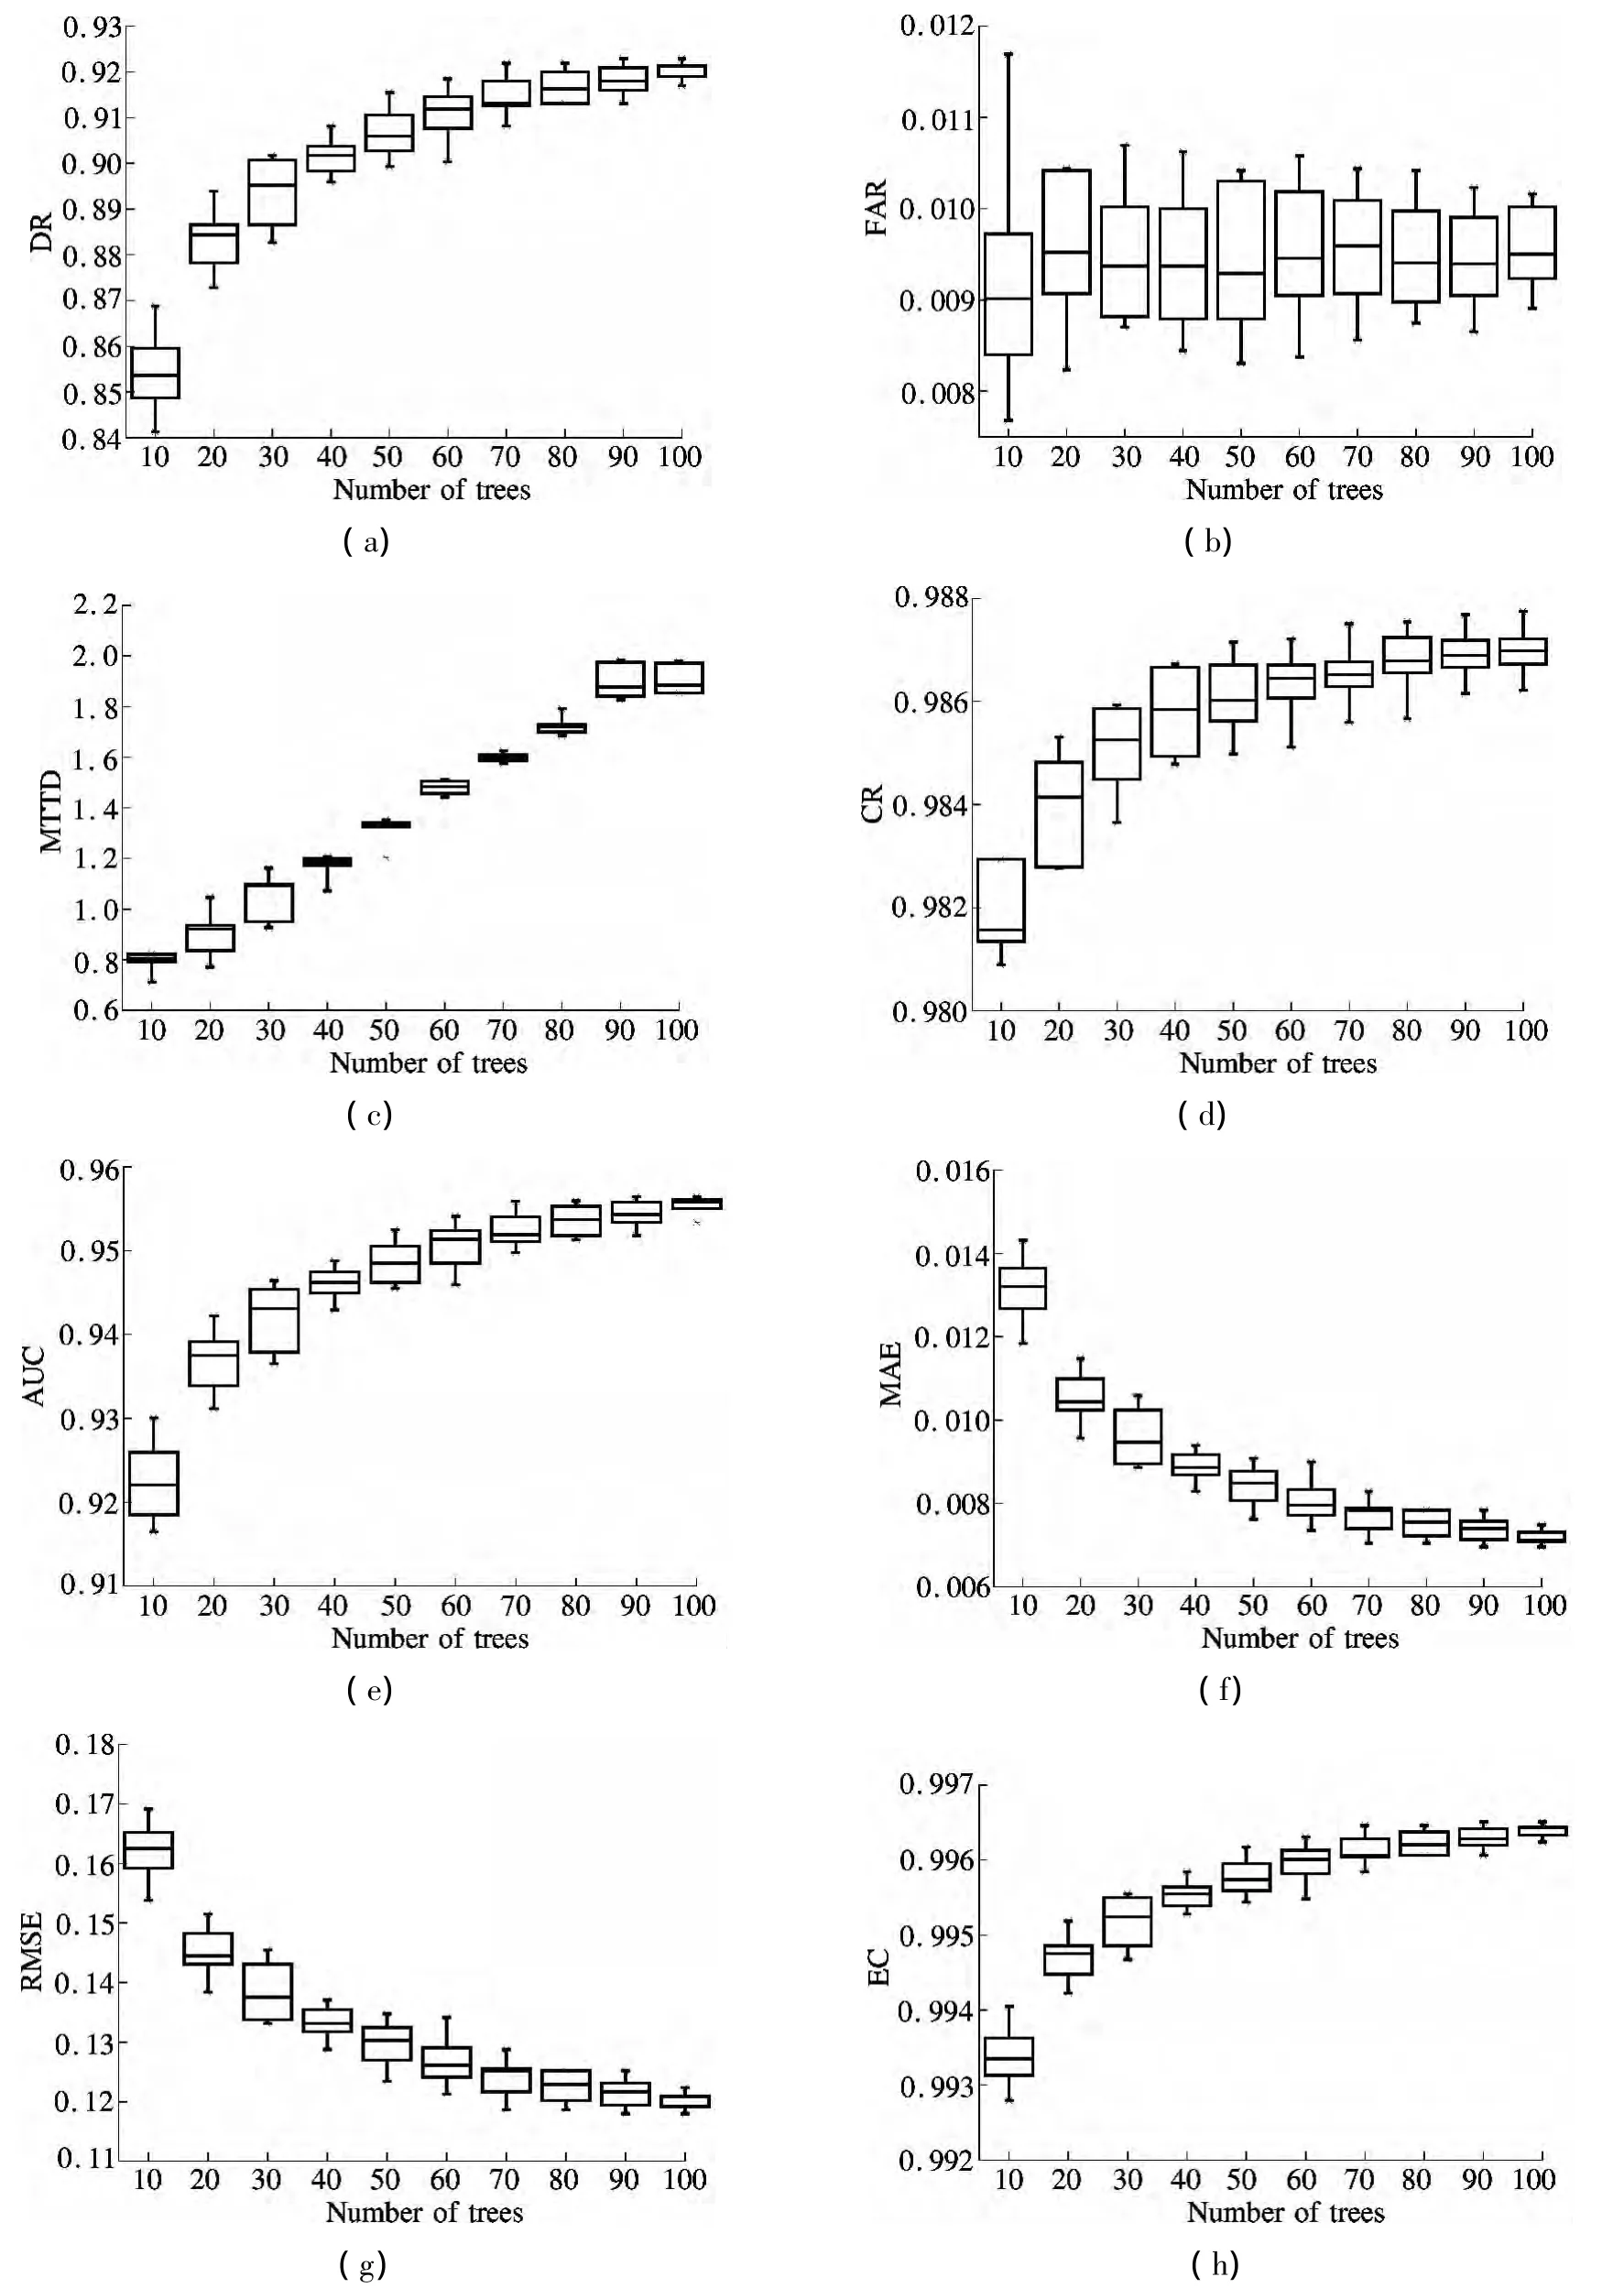
Fig.3 Box plots of 10-fold cross-validation test error rates of I-880 data set.(a)DR;(b)FAR;(c)MTTD;(d)CR;(e)AUC;(f)MAE;(g)RMSE;(h)EC
3.3 Experiment 2
In the experiment,we compare the random forest classifier with the decision tree classifier.We use C4.5 and CART as the decision tree classifier.The random forests of 10 trees,40 trees and 100 trees consider three random features(namely,RF-10,RF-40,and RF-100)when constructing.The results from the random forest algorithm are compared with those from C4.5 and the CART algorithm with the I-880 data set.Five performance measures,DR,FAR,MTTD,CR and AUC are computed for three algorithms,which are shown in Tab.2.It is observed that two decision tree classifiers yield a similar detection rate,and C4.5 obtains a slightly better DR with the corresponding number of 69.49%;however,the DR of random forests(RF-10,RF-40,RF-100)are more than 84%.Because the I-880 data set is unbalanced,the performances of C4.5 and CART are not ideal.That is to say,random forest can deal with unbalanced data.As MTTD is concerned,the 0.84 min of MTTD yielded by RF-10 is the best one.Random forests(RF-40,RF-100)generate 40 trees and 100 trees,so they consume more time.RF-40 obtains the lowest FAR with 0.87%.Both CR and AUC reach more than 90%,which are superior to those of C4.5 and CART.The values of MAE,RMSE and EC of random forest are the best among three different algorithms,especially RF-100.Among five comparisons,to a certain extent,it can be concluded that random forest can obtain a better incident detection ability compared with C4.5 and CART.

Tab.2 Comparison of C4.5,CART and random forest
Next,we compare the performance of the random forest algorithm by ROC curves.Here we give one kind of ROC curve,which is a transfiguration plot by DR against FAR.As we all know,a single incident scenario contains several incident instances.If an instance belonging to this incident scenario is classified to an incident class,an alarm is declared for this incident scenario and this incident scenario is detected triumphantly.When multiple instances are classified to an incident class,only the instance with the maximal probability is used for depicting ROC curves,since its probability represents the probability of the incident scenario being detected.Therefore,such kind of ROC curve emphasizes the ability of an algorithm to detect an incident as opposed to its FAR,so DR and FAR are more meaningful for evaluating incident detection algorithms.Figs.4(a)and(b)illustrate DR vs.FAR,where Fig.4(a)is the total ROC and Fig.4(b)is the part enlarged corresponding to FAR from 0 to 0.1.It is clear seen from this figure that random forest is superior to C4.5 and CART,since its AUC is larger than that of C4.5 and CART.When the FAR is equal to 0.1,the AUC of random forest is greater than that of C4.5 and CART.In Fig.3(b),when FAR's value is less than 0.02,random forests(RF-10,RF-40,RF-100)are closer to they-axis.So,it achieves higher DR at the same false alarm rate.
3.4 Experiment 3
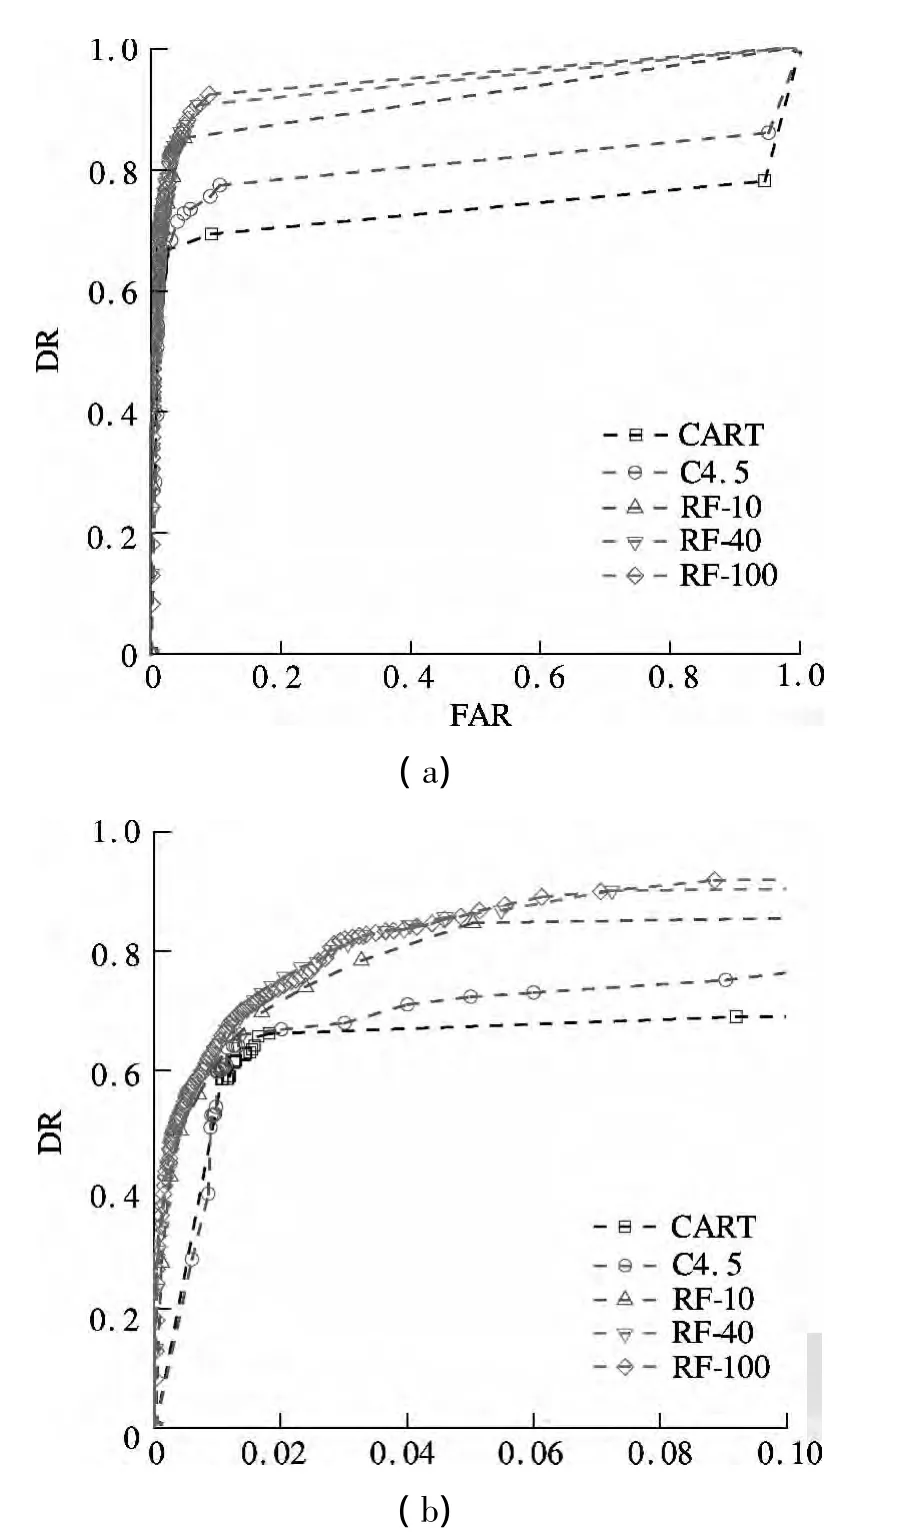
Fig.4 Comparisons of C4.5,CART and random forest.(a)Total ROC curve;(b)Part enlarged of ROC curve
Among existing traffic incident detection algorithms,the MLF has been investigated in freeway traffic incident detection and achieved good results.The magnitude of weight adjustment and the convergence speed can be controlled by setting the learning and momentum rates.The value of the learning rate is set to be 0.3,and the momentum rate is 0.2.The tree number of random forest is set to be 100.Five performance measures,DR,FAR,MTTD,CR and AUC are computed for MLF and random forest,which are shown in Tab.3.It is observed that they yield similar classification rates,and random forest obtains a better CR.DR and AUC of random forest are better than those of MLF.As FAR is concerned,the 0.95%of the FAR yielded by random forest is the best one.MLF obtains the higher MTTD with 4.73 min.The values of MAE,RMSE and EC of random forest are better than those of other algorithms;especially when the tree number is 100,the performance is the best.
Figs.5(a)and(b)illustrate DR vs.FAR,where Fig.5(a)is the total ROC and Fig.5(b)is the part enlarged corresponding to FAR from 0%to 0.6%.The performance of MLF is lower than that of random forest.It is shown that random forest is significantly comparative to an MLF neural network and our experiments demonstrate that random forest has great potential for traffic incident detection.
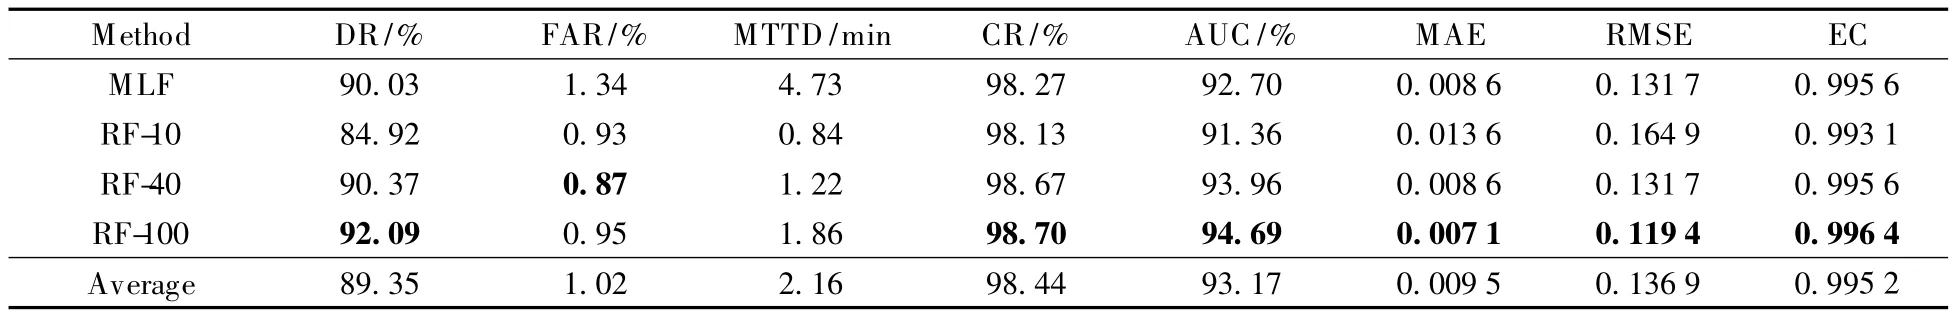
Tab.3 Comparison of MLF and random forest

Fig.5 Comparisons of MLF and random forest.(a)Total ROC curve;(b)Part enlargment of ROC curve
4 Conclusion
Based on the results of three experiments,the following conclusions are made:1)Random forest is effective in enhancing the classification strength.2)Random forest is effective in avoiding over fitting.3)Random forest has strong potential in traffic incident detection.
Random forest achieves satisfactory incident detection rates with deemed acceptable false alarm rates and mean times to detect.As our experiments point out,random forest can achieve better result if the number of trees is appropriate for MTTD.The decision tree is an individual classifier which only needs training one time,while random forest needs to train many individual tree classifiers to construct a decision tree ensemble.As a result,compared with the decision tree algorithm,the random forest algorithm consumes more time.It is concluded from our testing results that random forest can provide a comparable performance to a neural network.So it has a good potential for application in traffic incident detection.
If the decision tree number is appropriate,the random forest running time is short.So there is a great potential for real-time detection of traffic incidents.The MTTD problem should be noted when using random forest.There are many trees in the forest,but the key is how many trees can achieve an ideal MTTD.Besides,random forest lacks transferability like neural networks.So,how to produce a transferable incident detection algorithm without the requirement of explicit off-line retraining in the new site,that is to say,adaptive traffic incident detection based on random forest,needs further research.
[1]Li L,Jiang R.Modern traffic flow theory and applicationⅠ:freeway traffic flow[M].Beijing:Tsinghua University Press,2011.(in Chinese)
[2]Cheu R,Srinivasan D,Loo W.Training neural networks to detect freeway incidents by using particle swarm optimization [J].Transportation Research Record,2004,1867:11-18.
[3]Srinivasan D,Jin X,Cheu R.Adaptive neural network models for automatic incident detection on freeways[J].Neurocomputing,2005,64:473-496.
[4]Payne H J,Tignor S C.Freeway incident-detection algorithms based on decision trees with states[J].Transportation Research Record,1978,682:30-37.
[5]Chen S,Wang W.Decision tree learning for freeway automatic incident detection[J].Expert Systems with Ap-plications,2009,36(2):4101-4105.
[6]Bi J,Guan W.A genetic resampling particle filter for freeway traffic-state estimation[J].Chin Phys B,2012,21(6):068901-01-068901-05.
[7]Breiman L.Random forests[J].Machine Learning,2001,45(1):5-32.
[8]Breiman L.Bagging predictors[J].Machine Learning,1996,24(2):123-140.
[9]Hand D J,Till R J.A simple generalization of the area under the ROC curve to multiple class classification problems[J].Machine Learning,2001,45(2):171-186.
杂志排行

Journal of Southeast University(English Edition)的其它文章
- Wavelet transform and gradient direction based feature extraction method for off-line handwritten Tibetan letter recognition
- Analyses of unified congestion measures for interrupted traffic flow on urban roads
- Conditional autoregressive negative binomial model for analysis of crash count using Bayesian methods
- Biodegradation of microcystin-RR and-LR by an indigenous bacterial strain MC-LTH11 isolated from Lake Taihu
- Inverse kinematic deriving and actuator control of Delta robot using symbolic computation technology
- Operation optimization modefor nozzle governing steam turbine unit