Analyses of unified congestion measures for interrupted traffic flow on urban roads
2014-09-17RenGangFanChaoHuaJingyiHuangZhengfengWuJianbo
Ren Gang Fan Chao Hua Jingyi Huang Zhengfeng Wu Jianbo
(School of Transportation, Southeast University, Nanjing 210096, China)
T raffic congestion in China is a serious concern to transportation engineersdueto itsuncontrolled growth with economic loss,additional delay and air pollution.As the mitigation of traffic congestion is a priority goal of the government,there is an increasing need to have a realistic understanding of traffic congestion and its rational quantification technique.
Traditionally,the growing of traffic congestion was considered as the result of the growth of vehicular traffic volume, shortfall of roadway capacity, etc.Accordingly,congestion mitigation measures have emphasized the reduction of traffic volume and the increase of roadway capacity.Therefore, high-traffic volume and less roadway capacity, etc.are the causes of congestion;delay, additional fuel consumption and increasing traffic density,etc.are the results of congestion[1].
With growing concerns about traffic congestion,efforts are made to reveal the severity of this problem in a quantitative manner.However, it is found that either the operational characteristics(such as speed, delay, travel time,density, etc.)or the volume characteristics(such as traffic volume, volume to capacity ratio, traffic volume per lane, etc.)are used independently and singularly to quantify congestion on urban roads[2-4].
Maitra et al.[5]proposed a balanced measure of congestion combining speed and flow,which embodies the operational characteristic and the volume characteristic,respectively.In this congestion model, congestion is quantified as the area under the speed-flow envelope between the free flow point and the operating point.However, for traffic flow on urban roads, the increase of traffic volume is not the only reason of the reduction of vehicular speed[6-7].The vehicle stops at an intersection also significantly affects the travelspeed ofthis intersection's adjacent roads.In addition, speed is not the only operational characteristic of traffic flow on urban roads.Delay, queue length, stop rate or other traffic parameters are often used to characterize the degree of congestion.Therefore, it is necessary to make further investigation of the congestion nature of interrupted flow on urban roads.
To further investigate the traffic congestion of interrupted flow on urban roads,field data collection is conducted.Then, the correlation features of traffic parameters are studied,and the traffic parameters of interrupted traffic flow are divided into two categories:the basic parameters and the operation parameters.Through nonlinear fitting of parameters of different categories,a comprehensive evaluation method for the quantification of the congestion of urban roads is presented,and the feasibility of this method is demonstrated.
1 Field Data Collection and Analysis
1.1 Data collection
Using the traffic parameters to study the nature of traffic congestion can be dated back to the 1950s.A series of congestion quantification indicators have been established.These indicators can be classified into three categories:the indicators based on HCM;the indicators based on the queuing theory and the indicators based on travel time .The fundamental parameters involved in different categories are different, as shown in Tab.1.These fundamental parameters are also the most common and critical parameters in congestion analysis[9].All of these fundamental parameters includingv/c, stop rate,delay,travel speed and queue length are selected to be analyzed in this study.
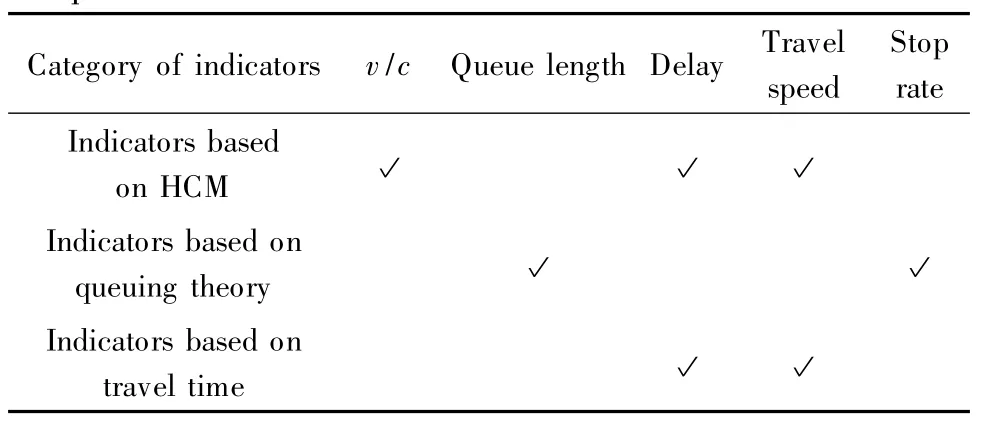
Tab.1 Fundamental parameters involved in congestion quantification indicators
To study the traffic status of urban roads and intersections,field data collection is conducted at the north approach of an intersection located on Jiangdong road in Nanjing.The north approach of this intersection is an eight-lane divided road with four through lanes.The circle length of the signaled intersection is 160 s,and the green time for the through vehicles of the north approach is 60 s.The traffic capacity of the through lanes of the north approach is 1 900 pcu/h.The length of the adjacent north road is 270 m.
A video camera was set up in the field for recording traffic data.A total of 30 h of video tapes were recorded.The recorded video tapes were later reviewed in the laboratory for obtaining traffic data.By reviewing video tapes, over 300 groups of intersection delay, maximum queue length,v/c(volume to capacity ratio), stop rate data of the north approach every 5 min were collected,as well as the travel speed data of the adjacent north road.
1.2 Data analysis
1.2.1 Correlation analysis of parameters
In order to analyze the relationships between different traffic parameters of the interrupted flow,the pairwise correlation analysis is conducted to study the correlation relationship of the collected parameters.The correlation coefficient valuesRof every two parameters are obtained.TheP-value(significant value)of the correlation coefficient is calculated.All these values are shown in Tab.2.|R | <0.3 means that two parameters are slightly correlated;0.3≤|R| <0.7 means that two parameters are moderately correlated,an|dR| ≥0.7 means that two parameters are highly correlated.The value ofPillustrates whetherRis significant.P< 0.01 means that its correspondingRis highly significant;0.01<P<0.05 means that its correspondingRis significant, andP≥0.05 means that its correspondingRis not significant.
The values of correlation coefficients of different parameter pairs are different.The value of the correlation coefficient betweenv/cand stop rate is -0.089,which means thatv/cand stop rate are slightly correlated.The values of the correlation coefficients ofv/cand intersection delay,v/cand travel speed,stop rate and maximum queue length are 0.392, - 0.325, 0.506, respectively,which means that they are moderately correlated.The values of other correlation coefficients are greater than 0.7, which means that they are highly correlated.
MostP-values shown in Tab.2 are 0.00, which means that their corresponding correlation coefficients are highly significant.TheP-value of the correlation coefficient ofv/cand stop rate is 0.177,which means that it is not significant.So it can be concluded that all the parameters are highly or moderately correlated,except forv/cand stop rate which are not correlated to each other.Ifv/cchanges, stop rate does not change with it,vice versa.
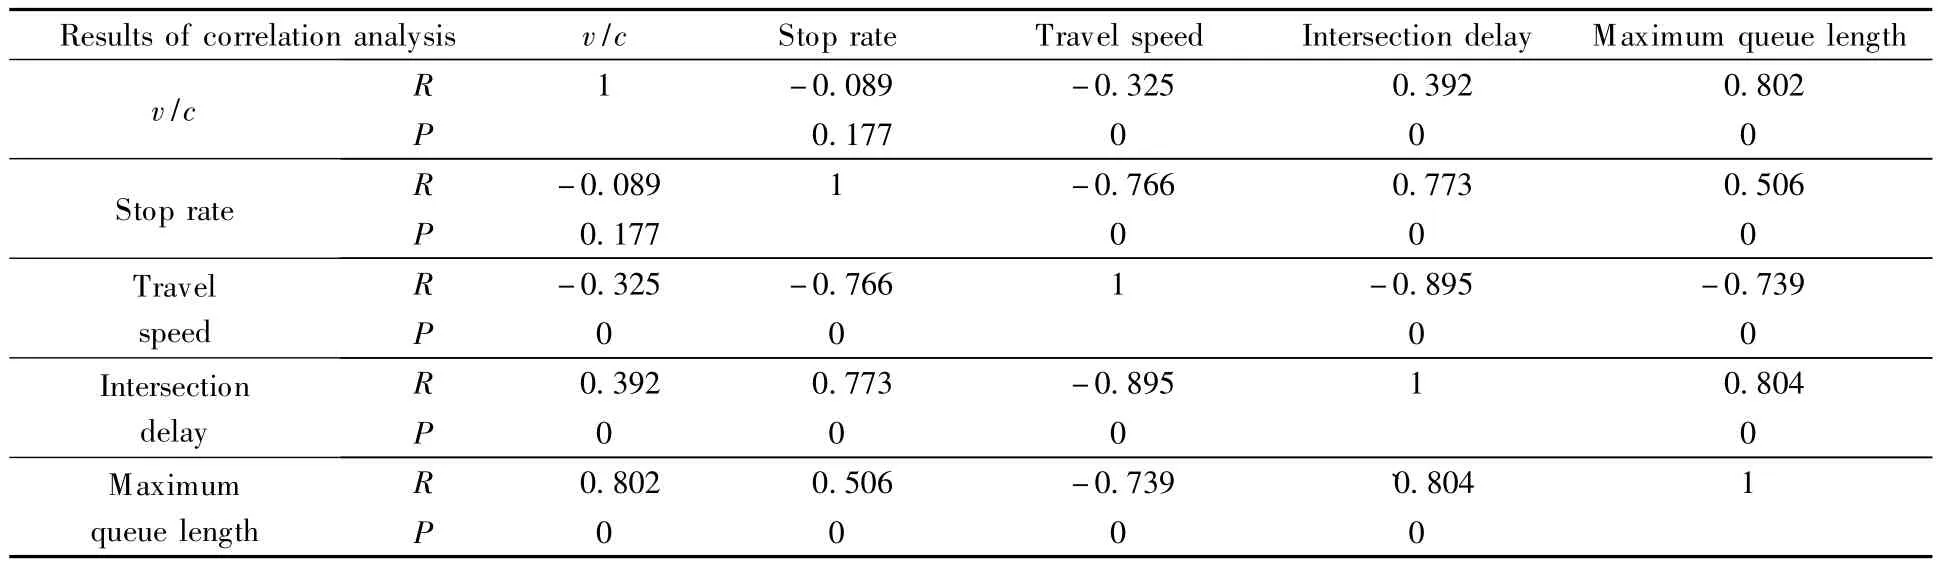
Tab.2 Results of correlation analysis of interrupted traffic flow
Generally speaking,two conclusions can be drawn from the correlation analysis.1)Travel speed, intersection delay and maximum queue length have similar correlation characteristics.For the three parameters, each of them is significantly correlated to one another,and each of them is highly correlated tov/cor stop rate.2)v/cand stop rate have similar correlation characteristics.These two parameters are not correlated to each other,but each of them is highly or moderately correlated to travel speed, intersection delay and maximum queue length.
1.2.2 Nonlinear fitting of parameters
It can be concluded from the correlation analysis of parameters that when traffic flow is unsaturated,stop rate has similar correlation characteristics tov/c(which is a typical representation of the volume characteristic).So stop rate andv/care put together as one category in this study, classified as the basic parameters, which is expressed asxi.x1meansv/c, andx2means stop rate.Travel speed,intersection delay,and maximum queue length are traditionally classified as the operational characteristics.They have similar characteristics in correlation analysis.These three parameters are put together as the other category in this paper,classified as the operational parameters, which is expressed asyj.y1means travel speed,y2means intersection delay,andy3means maximum queue length.
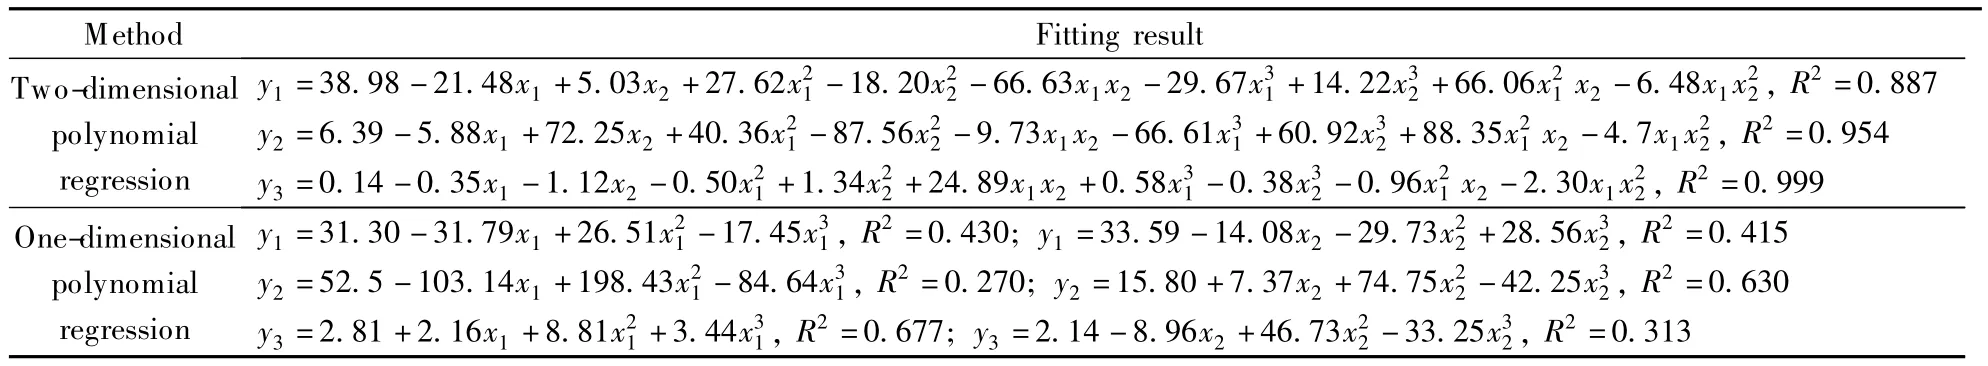
Tab.3 Fitting results of polynomial regression
To analyze the relationships between the basic parameters and the operational parameters,polynomial regression is introduced in this paper.The nonlinear regression model of SPSS 19.0 is adopted.The results of the one-dimensional polynomial regression and the two-dimensional polynomial regression are shown in Tab.3.
The two-dimensional polynomial fitting models bring a higher degree of fitting of regression compared with the one-dimensional polynomial fitting models,and the operational parameters change with the variations of bothv/cand stop rate.It can be seen from Tab.3 that the coefficients of determination of the two-dimensional polynomial fitting models are 0.887, 0.941, 0.999, which correspond to travel speed, intersection delay, maximum queue length, respectively.Takingv/cas the independent variable,the coefficients of determinationR2of the one-dimensional polynomial fitting models are 0.430,0.270,0.667, which correspond to travel speed, intersection delay, and maximum queue length, respectively.Taking stop rate as the independent variable,the coefficients of determinationR2of the one-dimensional polynomial fitting models are 0.415,0.630,0.313,which correspond to travel speed, intersection delay, and maximum queue length, respectively.
Setting stop rate as a fixed value,the fitted polynomials of two variables can be regarded as the polynomials of one variable whose operational parameters change with the variation ofv/c.These polynomials of one variable can be described asthe operationalparameters-v/ccurves.For different levels of stop rate, there are different operational parameters-v/ccurves correspondingly.To verify the validity of the fitting results of the two-dimensional polynomials models,the stop rate is separately fixed at 0.8 and 0.3.The operational parameter-v/ccurves of different operational parameters are given in Fig.1.The scattered points(which represent field data)of different stop rates(0.8 and 0.3)are also shown in Fig.1.It can be concluded from the comparisons of the curves and the scattered points that all these of the two-dimensional polynomial models fit well with the field data.
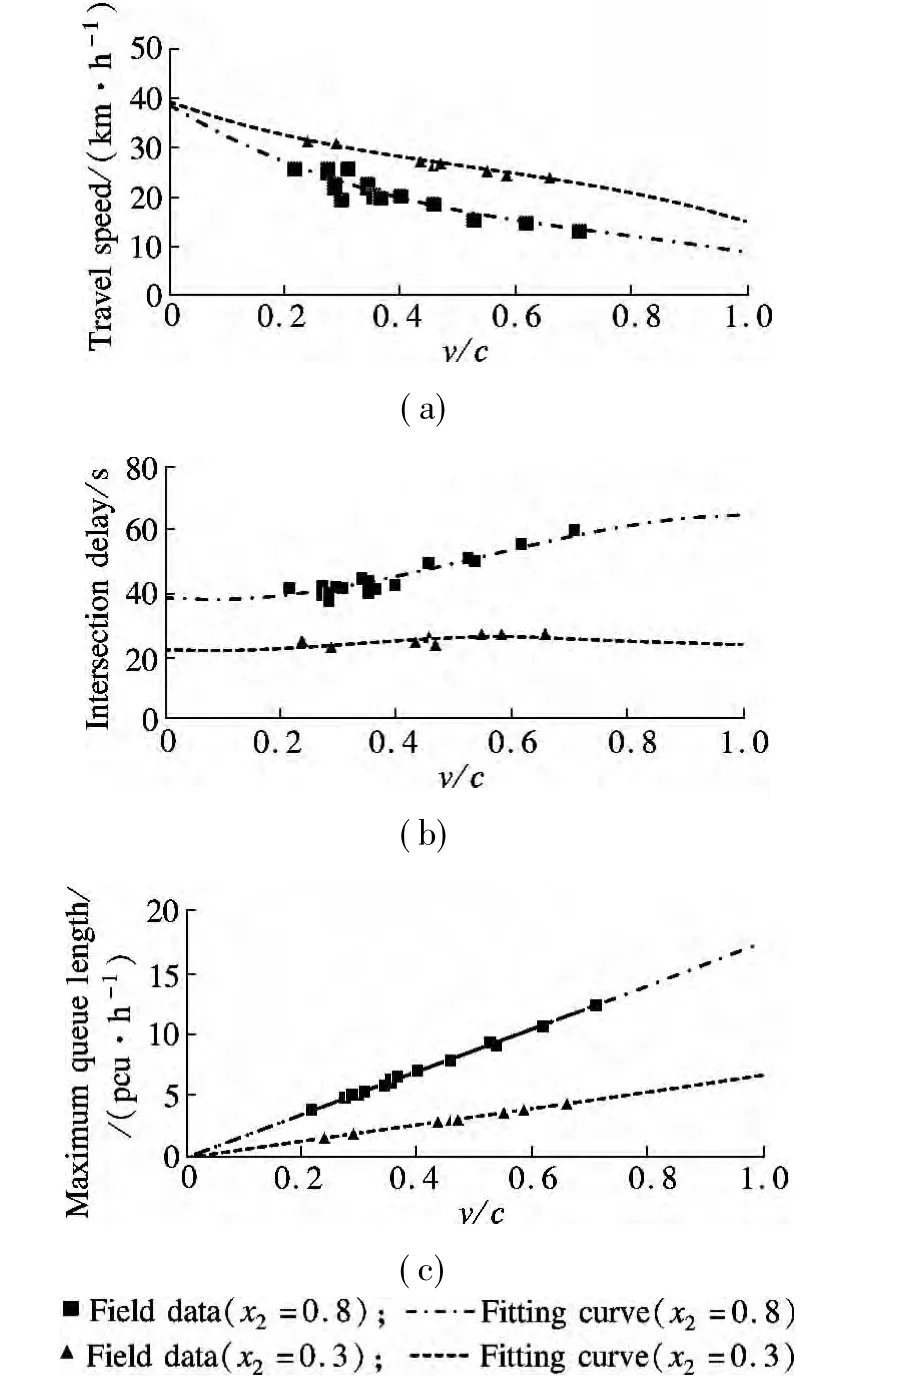
Fig.1 Comparisons between field data and fitting curves.(a)Travel speed;(b)Intersection delay;(c)Maximum queue length
2 Comprehensive Congestion Models of Interrupted Flow
2.1 Conceptualization
Considering that a comprehensive measure of conges-tion should embody both operational characteristics and volume characteristics[5],v/c(belongs to volume characteristics)and one operational parameter(belongs to operational characteristics)are put together as the basic unit of congestion analysis.The basic units can be expressed asYj={x1,yj},j=1,2,3.The congestion index corresponding to basic unitsYjisCj(j=1,2,3).C1represents the congestion index based on travel speed,andC2represents the congestion index based on intersection delay.C3represents the congestion index based on the maximum queue length.Congestion indices can be calculated as

whereCj=fj(Yj)is the congestion calculation equation;yj=gj(x1,x2)is the two-dimensional polynomial regression equation,which is derived from the nonlinear fitting of parameters.
When the basic parameters()are obtained from data collection,the corresponding operational parameters can be calculated according to the two-dimensional polynomial regression equationytj=gj(,),and the corresponding congestion indices,can be calculated consequently.
2.2 Modeling congestion
According to the traffic congestion model proposed by Maitra et al.[5], traffic congestion can be expressed as the additional operational burden derived from the increase ofv/c.Congestion indices can be obtained by referring to the operational parameter-v/ccurves described in section 1.2.2.
Take the index based on travel speed as an example for illustration.Different values of stop rate correspond to different travel speed-v/ccurves, as shown in Fig.2.When the stop rate is 1,the relationship between travel speed andv/ccan be described as curveAB.When the stop rate is 0,the relationship between travel speed andv/ccan be described as curveDC.When the value of stop rate is smaller than 1 and greater than 0(0<x2<1),the relationship between travel speed andv/ccan be described as a curve between curveABand curveDC.
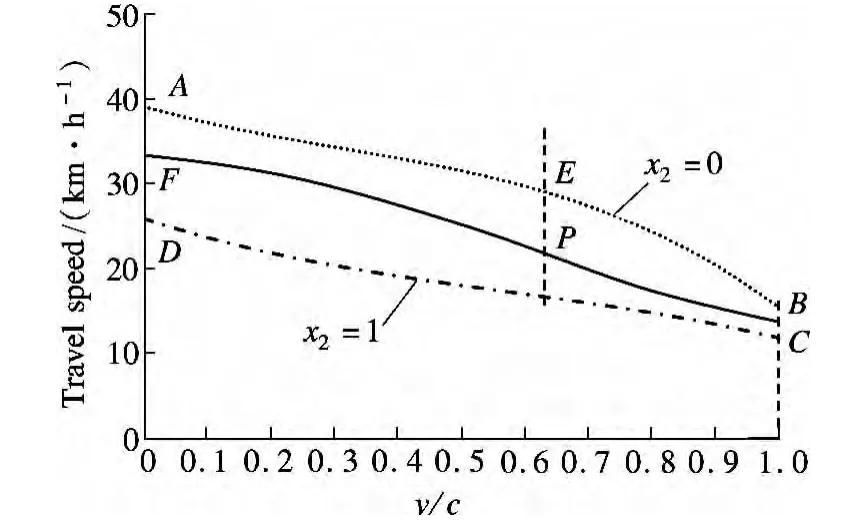
Fig.2 Travel speed-v/c curves
For the obtained basic parameter(x1t,x2t),according to the stop rate,there is a certain travel speed-v/ccurve corresponding to it.Suppose that it is the solid curve in Fig.2.The additional loss of travel speed can be expressed as the area between curveABand curveFP,and(the congestion index based on travel speed)can be expressed as

Similarly,andchange with the variations ofv/cand stop rate,and then the traffic congestion can be expressed as the increase of intersection delay and maximum queue length.
3 Example Application
In order to demonstrate the feasibility of the comprehensive congestion evaluation method proposed in this paper,comparative analysis between the proposed method and the existing methods for the level of service evaluation is conducted.First, 4 h of field data collection is conducted.48 groups of data includingv/c, stop rate,travel speed,intersection delay and maximum queue length are collected.Secondly, based on the method proposed in this paper, the values of congestion indicesC1,C2,C3of each group of data are calculated.Thirdly, the existing level of service measures based on travel speed(refers to HCM), intersection delay(refers to HCM), and maximum queue length(refers to Ref.[10]), respectively,are calculated.The HCM divides traffic conditions into six levels of service,which are represented byAtoF,respectively.In Ref.[10], the traffic conditions are divided into five levels of service, which are represented by 1 to 5, respectively.Finally, the scatter plots of the 48 groups of data are made, as shown in Fig.3.
It is interesting to note that generally the proposed congestion indices and existing measures show the same trend.Higher levels of service correspond to higher value of congestion indices.While the proposed congestion indices show differences even within the same level of service class.
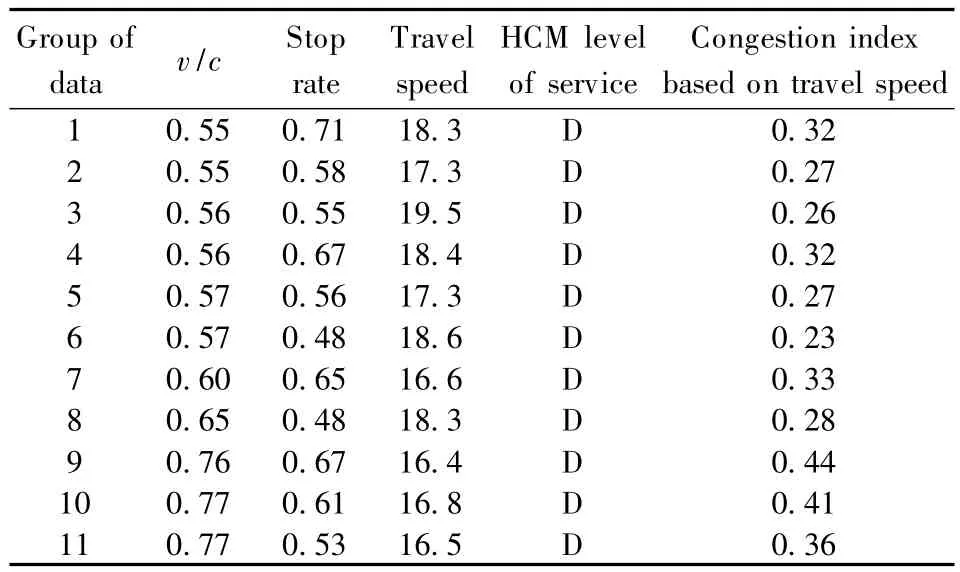
To further analyze the differences of the congestion indices at the same level of service class,the 11 groups of traffic parameters at the HCM level of serviceDare selected,as shown in Tab.4.It can be seen from Tab.4 that due to the differences in stop rate,data groups with the samev/ccorrespond to different values of travel speed.Using eitherv/c(which represents volume characteristic)or travel speed(which represents an operational characteristic)cannot capture the real status of the conditions.
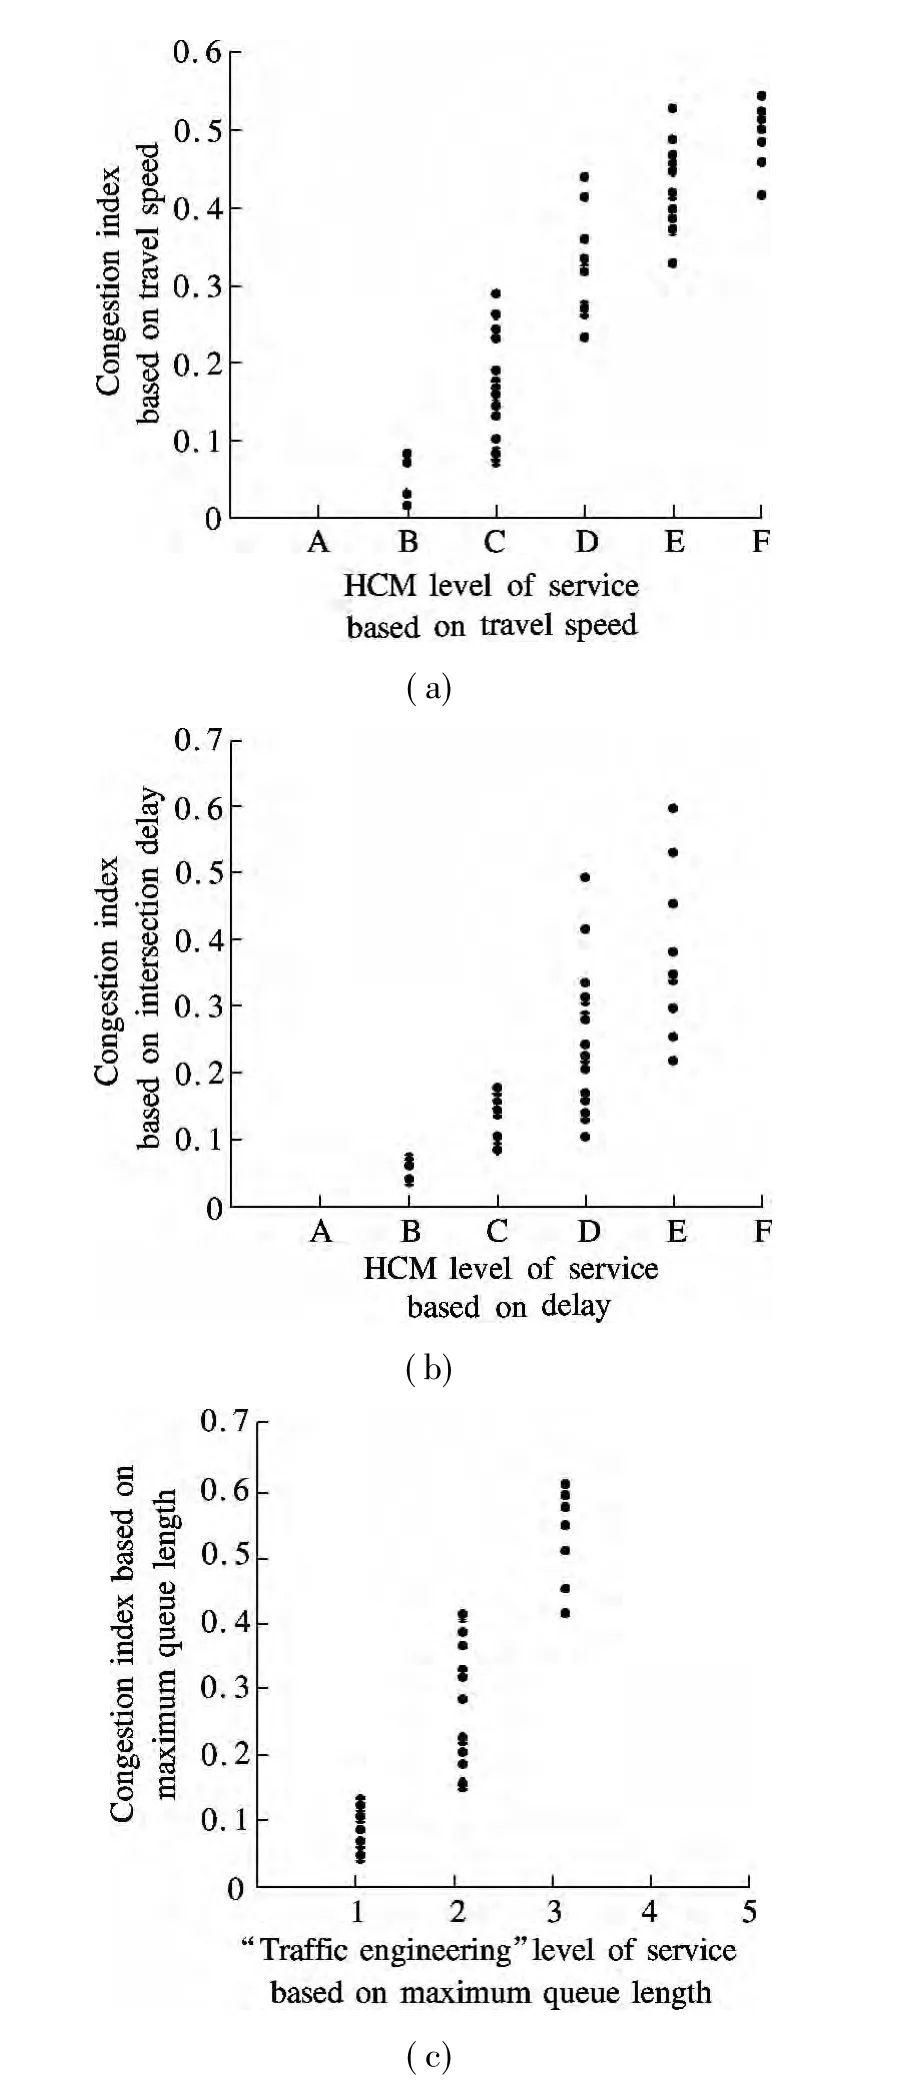
Fig.3 Scatter plots of proposed methods and existing methods.(a)Congestion evaluation method based on travel speed;(b)Congestion evaluation method based on intersection delay;(c)Congestion evaluation method based on maximum queue length
Tab.4 Illustration of selected data groups
Comparing the first two groups of data,they have the same value ofv/c,while the travel speed values of these two groups are different.So it is not appropriate to only adoptv/cto represent the status of these two conditions.In this case,the congestion index proposed in this paper can represent the situation in whichv/cis low but high stop rate causes low travel speed.The 1st and 8th groups of the data have the same value of travel speed,while the values ofv/care different.So it is not appropriate to only adopt travel speed to represent the status of these two conditions.In this case, the congestion index proposed in this paper can represent the situation in which travel speed is high but high value ofv/cdecreases the freedom of travelling.
4 Conclusion
The traffic parameters of interrupted flow in China can be divided into different categories.In this paper, the collected parameters can be divided into two categories:the basic parameters and the operational parameters.Every operational parameter can be well fitted by the corresponding two-dimensional polynomial regression model of basic parameters,which means that bothv/cand stop rate(notv/conly)are the causes of the traffic status'variations of interrupted flow on urban roads in China.
Based on the two-dimensional polynomial regression model of the operational parameters and basic parameters,the comprehensive congestion measures combining operating characteristics and volume characteristics can be deduced.Example application shows that the congestion evaluation method proposed in this paper has the same trend with the existing methods for level of service evaluation.Higher levels of service correspond to higher values of congestion indices.Moreover, because the proposed indices in this paper combine both volume characteristics and operational characteristics,they can provide a more detailed indication of the congestion status than the existing methods.
[1]Transportation Research Board.Highway capacity manual2010[M ].Washington DC:Transportation Research Board, 2011.
[2]Aftabuzzaman M.Measuring traffic congestion—a critical review [C/CD]//Transportation Research Board Annual Meeting.Washington DC,2007.
[3]Joombo K, Randall L.Characterization of congestion based on speed distribution:a statistical approach using Gaussian mixture model[C/CD]//Transportation Research Board Annual Meeting.Washington DC,2005.
[4]Anjaneyulu M,Nagaraj B.Modeling congestion on urban roads using speed profile data [J].Journal of the Indian Roads Congress, 2009(1):65-74.
[5]Maitra B,Sikdar P K,Dhingra S L.Modeling congestion on urban roads and assessing level of service [J].Journal of Transportation Engineering, 1999, 125(6):508-514.
[6]Hemant K S, Mansha S.Speed-flow analysis for interrupted oversaturated traffic flow with heterogeneous structure for urban roads[J].International Journal for Traffic Transport Engineering, 2012, 2(2):142-152.
[7]Sofer T, Polus A, Bekhor S.A new, comprehensive,congestion measure for freeways [J].Advances in Trans-portation Studies, 2012(29):45-57.
[8]Zhu F L.Research on index system of urban traffic congestion[D].Nanjing:School of Transportation of Southeast University, 2006.
[9]Ji X Z.The research on the key indices of urban transportation performance[D].Shanghai:School of Transportation Engineeringof Tongji University,2007.
[10]Ren F T.Traffic engineering[M].Beijing:China Communications Press, 2008.
杂志排行

Journal of Southeast University(English Edition)的其它文章
- Wavelet transform and gradient direction based feature extraction method for off-line handwritten Tibetan letter recognition
- Conditional autoregressive negative binomial model for analysis of crash count using Bayesian methods
- Design and analysis of traffic incident detection based on random forest
- Biodegradation of microcystin-RR and-LR by an indigenous bacterial strain MC-LTH11 isolated from Lake Taihu
- Inverse kinematic deriving and actuator control of Delta robot using symbolic computation technology
- Operation optimization modefor nozzle governing steam turbine unit