Added Resistance Acting on Hull of a Non Ballast Water Ship
2014-07-30NgoVanHeandYoshihoIkeda
Ngo Van He and Yoshiho Ikeda
1. Marine System Engineering, Osaka Prefecture University, Osaka 599-8531, Japan
2. Department of Ship Engineering and Fluid Mechanics, Hanoi University of Science and Technology, Hanoi 10000, Vietnam
1 Introduction1
Non Ballast Water Ships were developed at the Laboratory of the authors in Japan. The ships were discovered to drastically reduce their resistance in calm water by eliminating large amounts of ballast water. The ship has multiple podded propulsors which can move up and down to keep the propeller-depth in non ballast water conditions,round cross sections to reduce its wetted surface, a buttock-flow stern shape to reduce its viscous pressure resistance, a frontal engine room to reduce the trim angle in non ballast water conditions and a streamlined super-structure to reduce its wind resistance. It was confirmed that the ships could reduce the resistance by 43.7% in ballast conditions and by 17.4% in full load conditions. The original ship was developed with a blunt bow, without a bulbous bow, and it is named as the NBS-original (Tatsumiet al., 2010). The resistance tests of the model demonstrated that it has a rather higher resistance with a low Froude number even under 0.15 because wave resistance may slightly occur.
The improved bulbous bow shape for the NBS was developed, which could reduce added resistance in calm water as well as in waves. It has a minimum resistance hull form in calm water, and it is named as the NBK-N6(Tatsumiet al., 2011; Tomitaet al., 2011). In the research project on the development of a minimum resistance hull form for non ballast tankers and bulkers in waves, a commercial CFD “ANSYS-Fluent” was applied to optimizeation of the bulbous bow shape for the NBS in regular and short head waves. The resistance acting on the hull was defined as the object function in the optimization process. The bulbous bow shapes were considered as the designed parameter as follows: the volume of the bulbous bow, height of the volume center, angle of the bow bottom and length of the bow. Then, the optimum bulbous bow shape was found. It is named as the NBK-N5. The moderated wave has a wave height isof 0.02 m and a ratio of wave length to ship lengthλ/Lpp>lt;0.6 for a 2 m of model for the computations and experiments (Heet al., 2013).
In this paper, added resistances acting on three kinds of bow shapes of the NBS in high waves up to 0.07 m for a 2 m model were theoretically and experimentally investigated.At first, resistances acting on the hulls of the ships in regular head and shorter waves with a wave heightHw= 0.02 m,λ/Lpp>lt;0.6 were calculated by a commercial CFD“ANSYS-Fluent,”, and they were compared with those of the experimental results in the towing tank at Osaka Prefecture University in Japan to validate the CFD results.Secondly, the performances of the ships in high waves(Hw>gt;0.02 m) were computed. A lot of information on pressure distributions, wave patterns and flow fields in the boundary layer as well as the resistances acting on the hulls were investigated by the CFD. The results were compared with each other for the three kinds of bow shapes of the ships to find an optimum one in high waves. Lastly, the calculated results of the resistances acting on the hulls of the ships were compared with those of the experimental results to validate the computed results of the CFD.
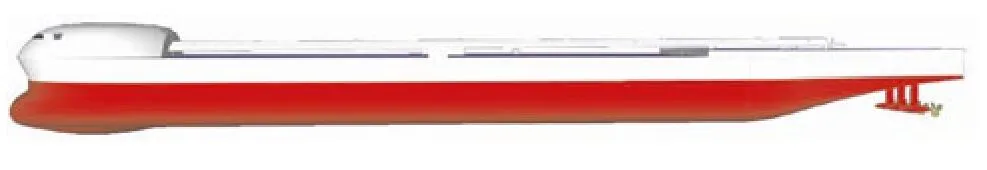
Fig. 1 Non Ballast Water Tanker developed at the Ikeda Lab at Osaka Prefecture University, Japan
2 Models and fluid domain used for computation
2.1 Ship models used for measurement and calculation
Three ship models are selected as the object ones,NBS-original, NBK-N5 and NBK-N6. The NBS-original is the original hull shape developed in the research project of non ballast water ships (Tatsumiet al., 2010), NBK-N6 has the optimum bulbous bow in calm water (Heet al., 2012),and NBK-N5 has the optimum hull in moderate regular head waves (Hw=0.02m for a 2m model) which were developed by the authors (Heet al., 2013). Figs. 2~6 show the body plans of the ships. Their stern shapes are the same. Table 1 shows the principal particulars of them.

Fig. 2 Body plan of the simple hull form, named as the NBS-original, without a bulbous bow

Fig. 3 Body plan of the improved hull form, NBK-N6 with a developed bulbous bow to reduce the wave resistance in calm water
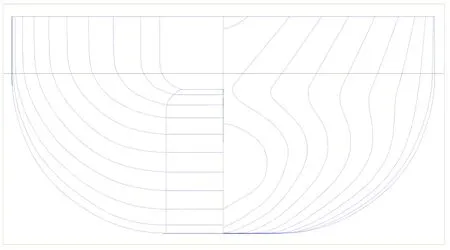
Fig. 4 Body plan of the optimum hull form, NBK-N5 with an optimum bulbous bow in regular head and shorter waves, Hw>lt;0.02m, λ/Lpp>lt;0.6
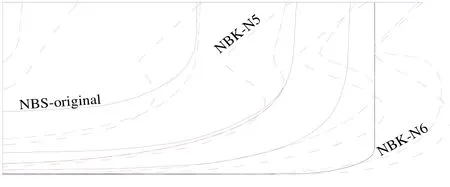
Fig. 5 Profiles of the bow shapes of the ships
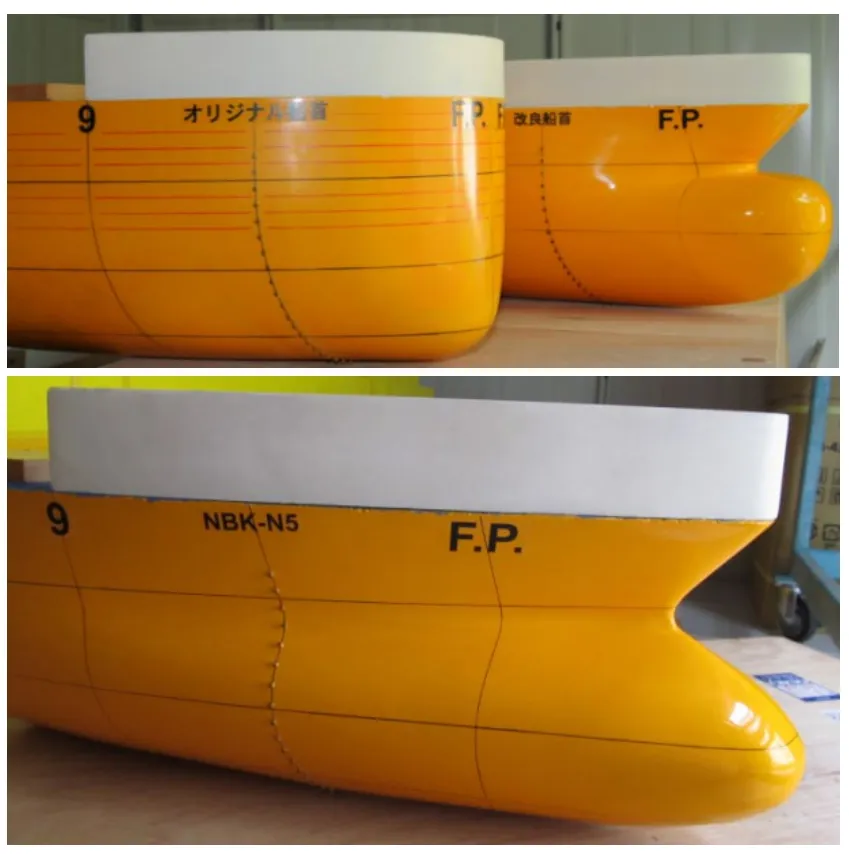
Fig. 6 Images of the bow shapes of the ships, NBS-original,NBK-N6 and NBK-N5 for the experiments

Table 1 Principal particulars of the ship models
2.2 Fluid domain and meshing
As is well known, with the computational fluid dynamics(CFD), the domain of the fluid, meshing and boundaries conditions have effects on the CFD results. The practical guidelines for the ship CFD applications updated in 2011 by the 26thInternational Towing Tank Conference (ITTC) is referred to for the tunings of the calculating conditions.
In this research, a commercial CFD “ANSYS-Fluent” was used. The Volume of the Fluid model (VOF) k-ω for unsteady flow was used. The velocity inlet is setup for the inlet. The pressure outlet is setup for the outlet of the fluid domain for calculation (Heet al., 2011). The structuredH–grid is used for meshing of the 1.8 million grids, and the fluid domain is limited to 15 m of length, to 1.6 m of breadth,to 1.6 m of depth for a 2 m model as shown in Fig.7.

Fig. 7 Fluid domain and meshing in the computation
3 Dynamic pressure and wave pattern
3.1 Wave pattern at free surface
In this section, the calculated waves from the CFD in the conditions;Hw=0.04m,λ/Lpp=0.3 andFn=0.163, are shown.The incident regular and short head wave with a sinusoidal profile is used in this research. The computed wave patterns in a wave cycle forλ/Lpp=0.3 are shown in a birds-eye view in Figs. 8~12. We can see that the incident waves are disturbed at the bows of the ships, and the waves rise in front of the bows and fall at the side shoulders. The rise of the front waves of the NBS-original is higher than those of the NBK-N6 and NBK-N5. It should be noted that incident waves shown in these figures look like they are not in a steady oscillating condition because the scales of the expressions of the free-surface elevation are too rough.
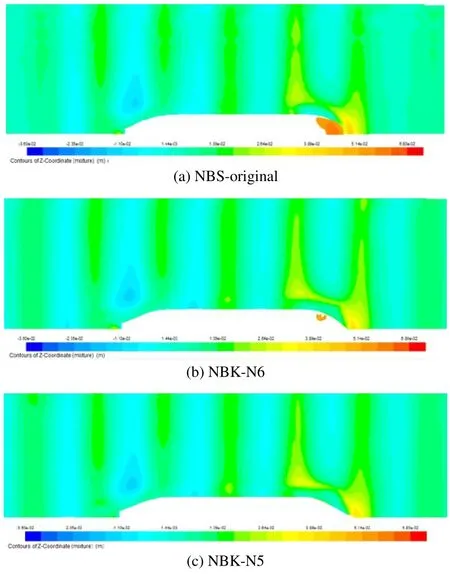
Fig. 8 Wave patterns on the free surface at the moment time 0 in waves, Hw=0.04m, λ/Lpp=0.3, Fn=0.163

Fig. 9 Wave patterns on the free surface at the moment time0.25τw in waves, Hw=0.04m, λ/Lpp=0.3, Fn=0.163
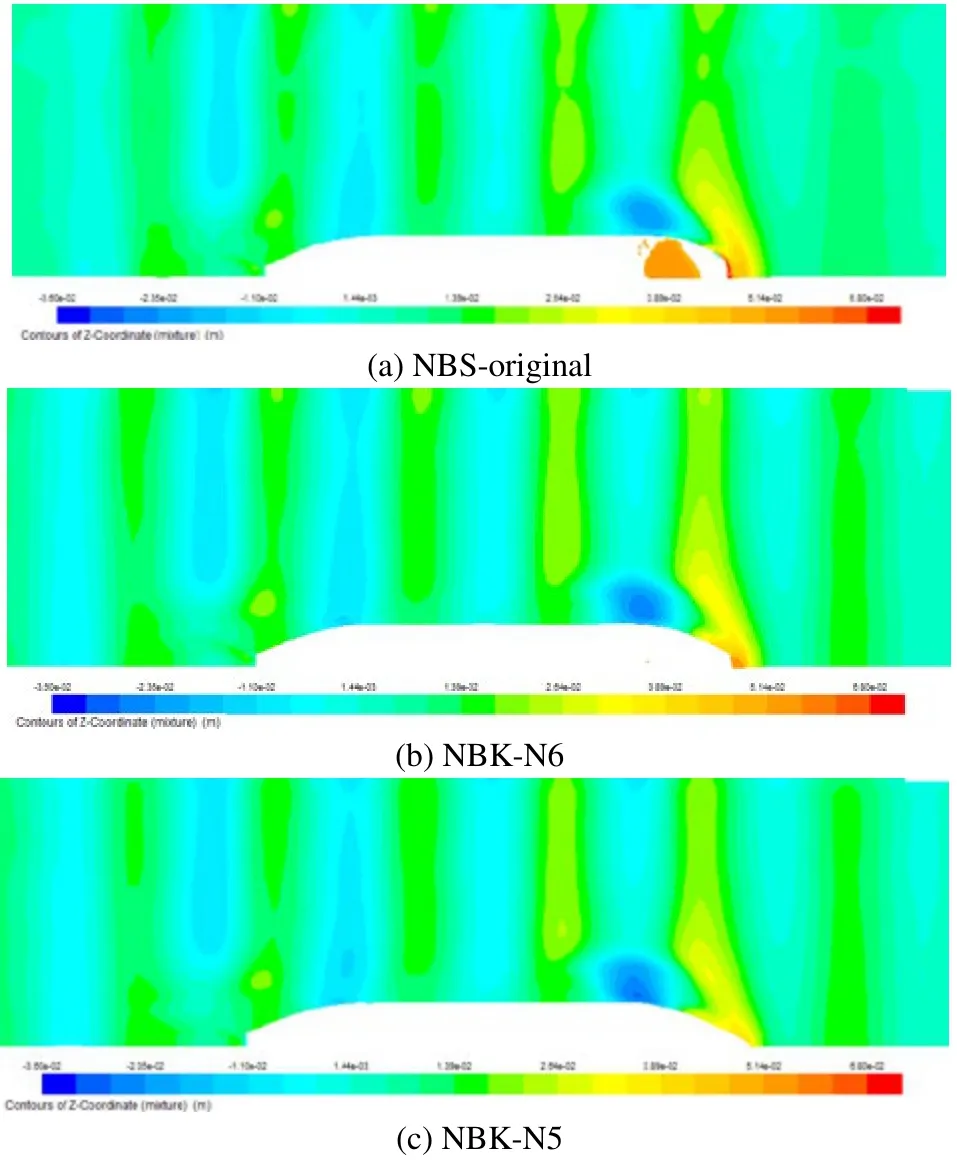
Fig. 10 Wave patterns on the free surface at the moment time 0.5τw in waves, Hw=0.04m, λ/Lpp=0.3, Fn=0.163

Fig. 11 Wave patterns on the free surface at the moment time 0.75τw in waves, Hw=0.04m, λ/Lpp=0.3, Fn=0.163

Fig. 12 Wave patterns on the free surface at the moment time τw in waves, Hw=0.04m, λ/Lpp=0.3, Fn=0.163

Fig. 13 Profiles of the waves around the bow when the wave crest is at the bow (t=0.25τw), Hw=0.04m, λ/Lpp=0.3,Fn=0.163
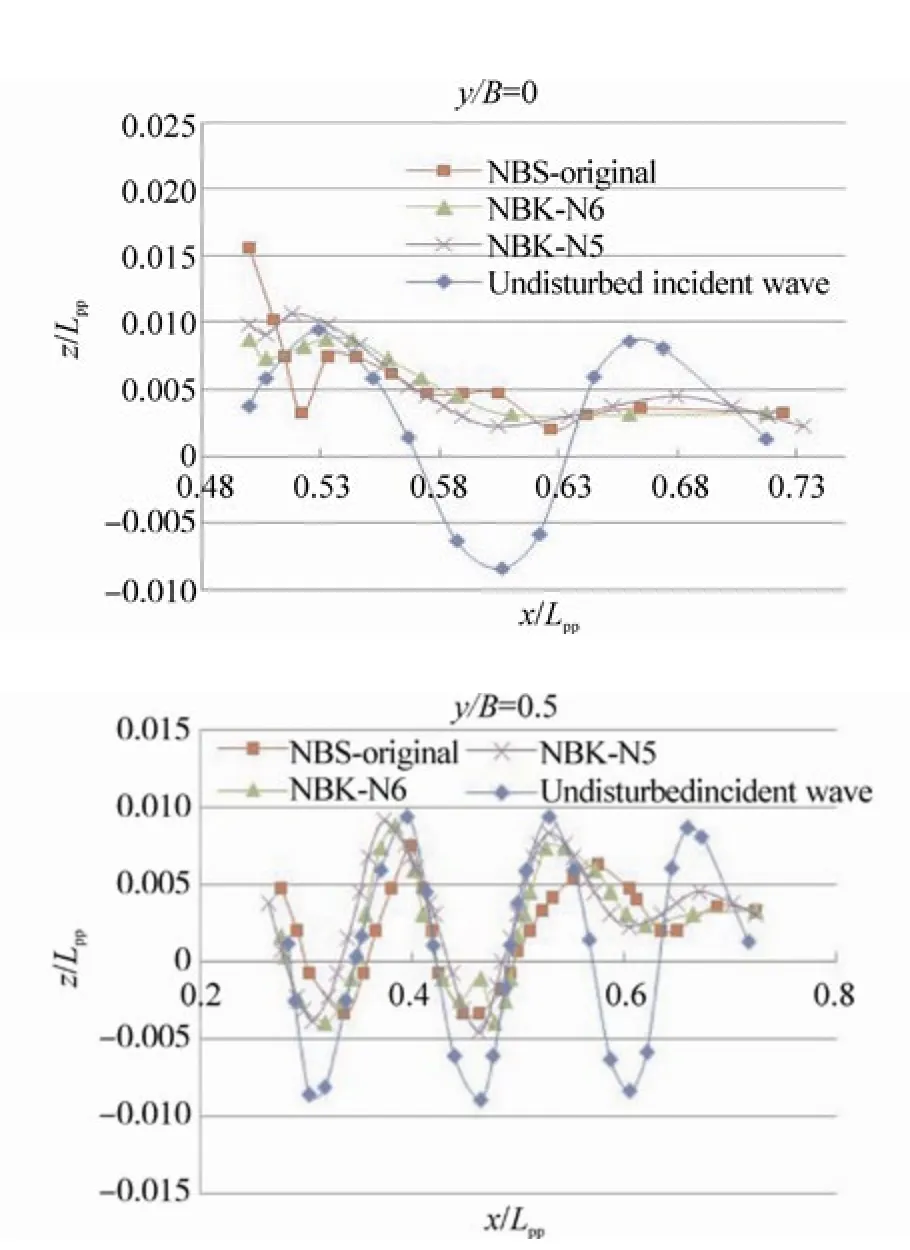
Fig. 14 Profiles of the waves around the bow at time 0.75τw,Hw=0.04m, λ/Lpp=0.3, Fn=0.163
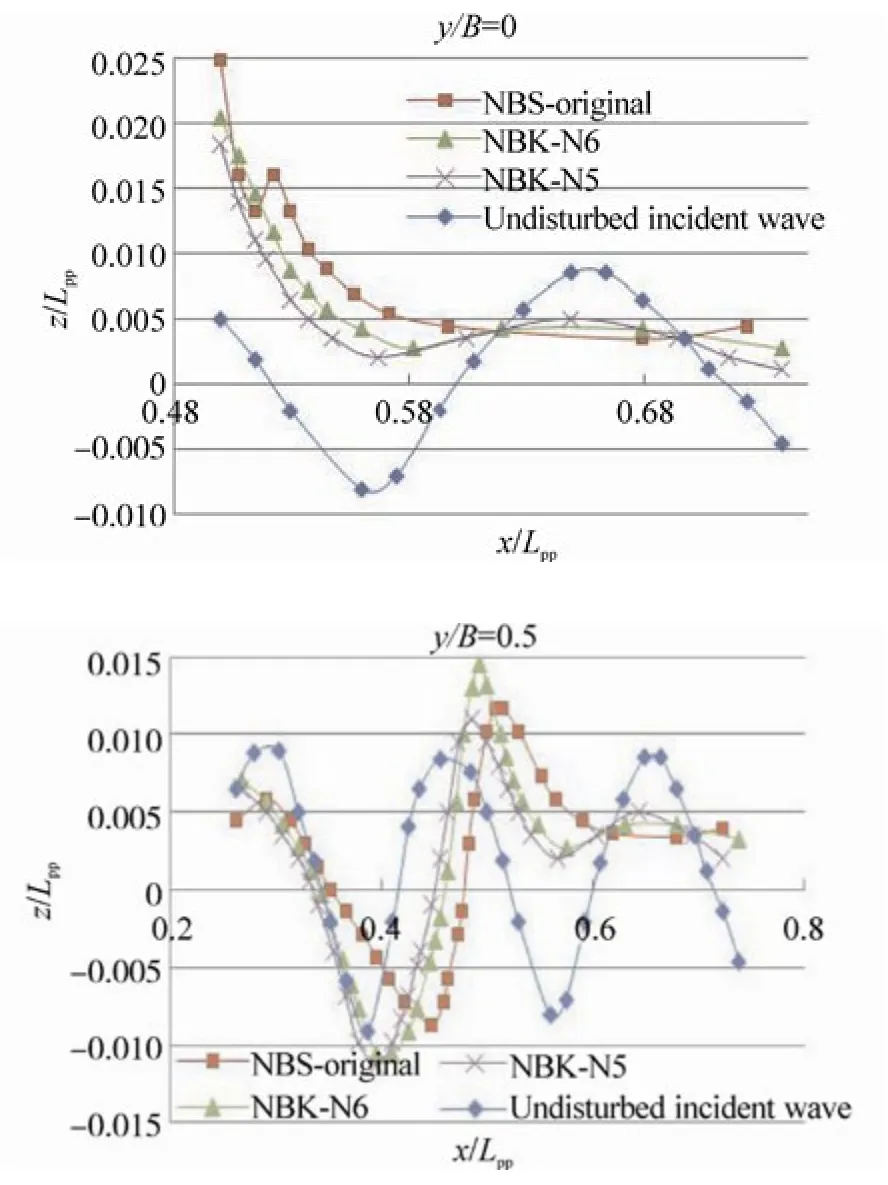
Fig. 15 Profiles of the waves around the bow when the wave crest is at the bow (t=0.25τw), Hw=0.04m, λ/Lpp=0.4,Fn=0.163

Fig. 16 Profiles of the waves around the bow when the wave trough is at the bow (t=0.75τw), Hw=0.04m, λ/Lpp=0.4,Fn=0.163
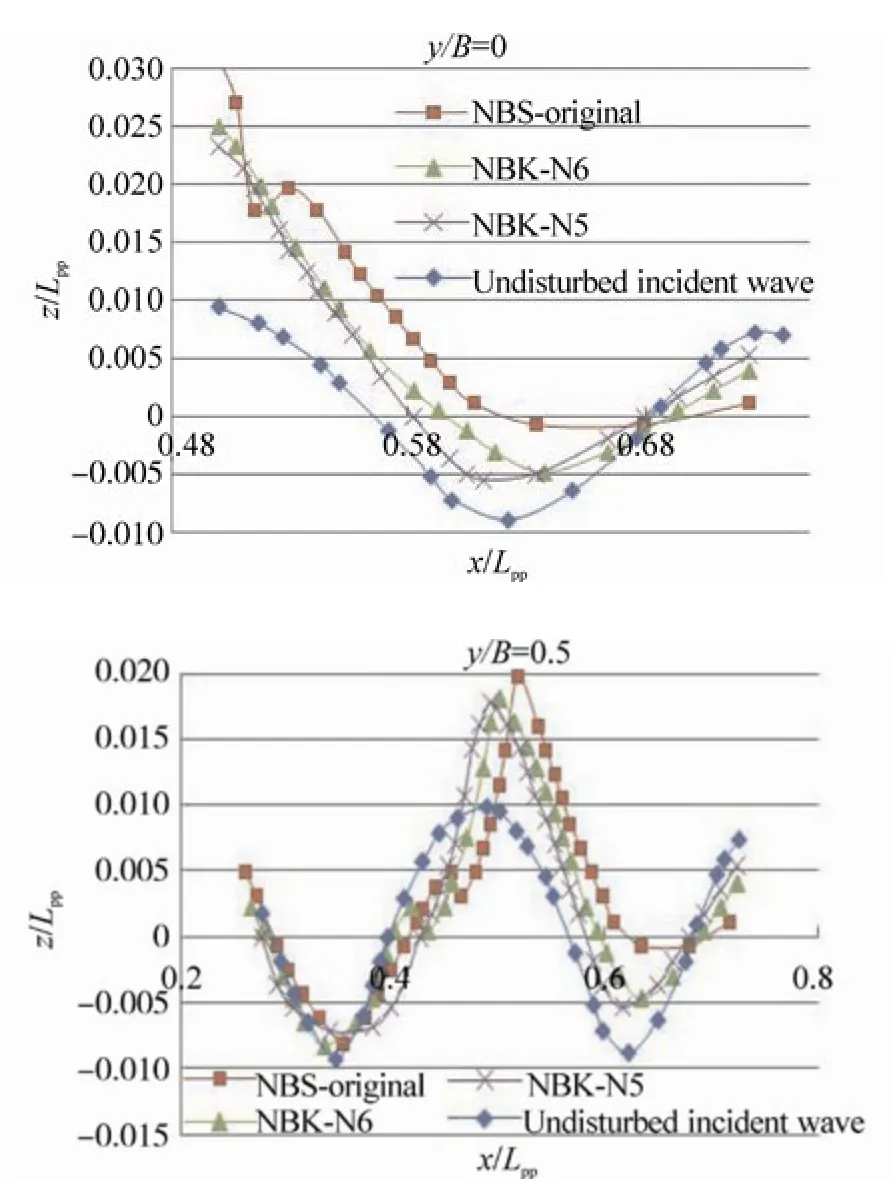
Fig. 17 Profiles of the waves around the bow when the wave crest is at the bow (t =0.25τw), Hw=0.04m, λ/Lpp=0.6,Fn=0.163

Fig. 18 Profiles of the waves around the bow when the wavetrough is at the bow (t=0.75τw), Hw=0.04m, λ/Lpp=0.6,Fn=0.163

Fig. 19 Profiles of the waves around the bow of the NBS-original when the wave crest is at the bow (t=0.25τw), Hw=0.04m, λ/Lpp=0.3, and in calm water at Fn=0.163

Fig. 20 Profiles of the waves around the bow of the NBS-original when the wave trough is at the bow (t=0.75τw), Hw=0.04m, λ/Lpp=0.3, and in calm water at Fn=0.163
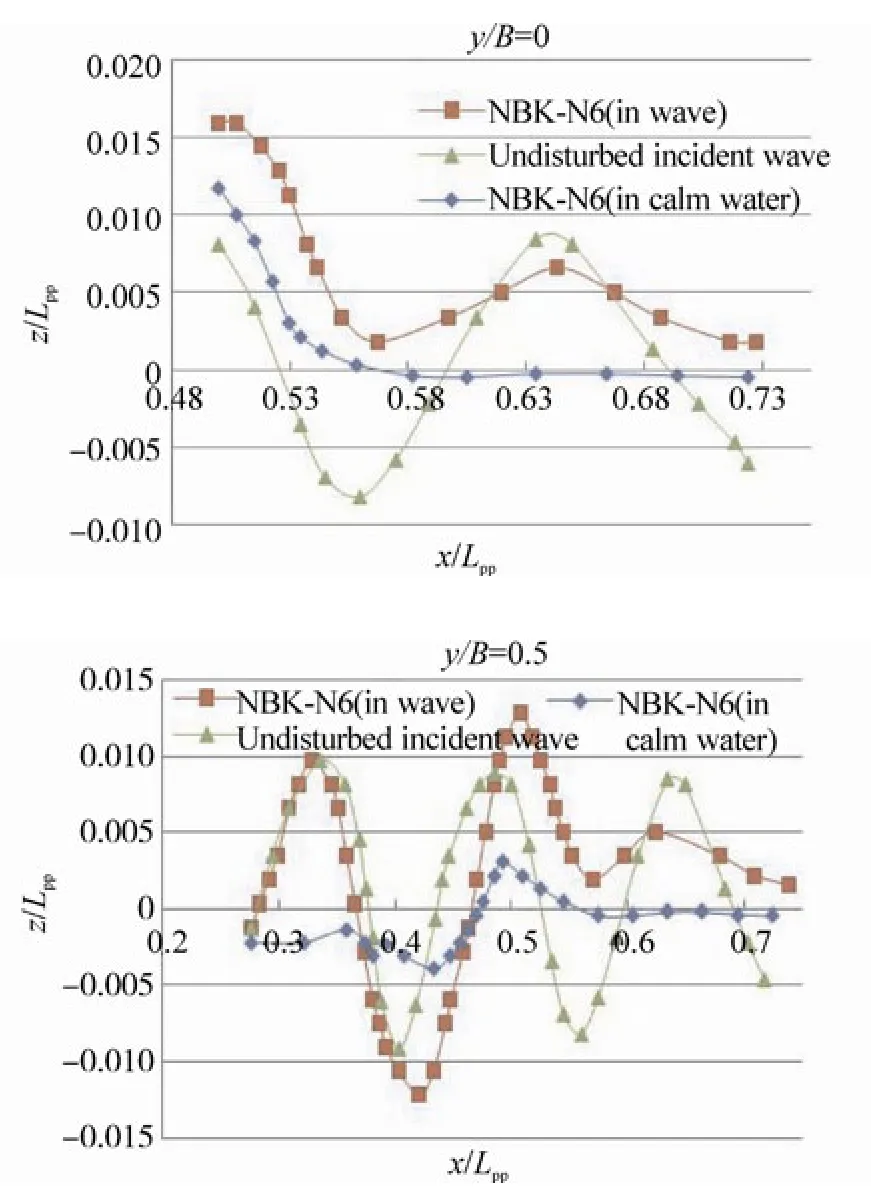
Fig. 21 Profiles of the waves around the bow of the NBK-N6 when the wave crest is at the bow (t=0.25τw),Hw=0.04m, λ/Lpp=0.3, and in calm water at Fn=0.163
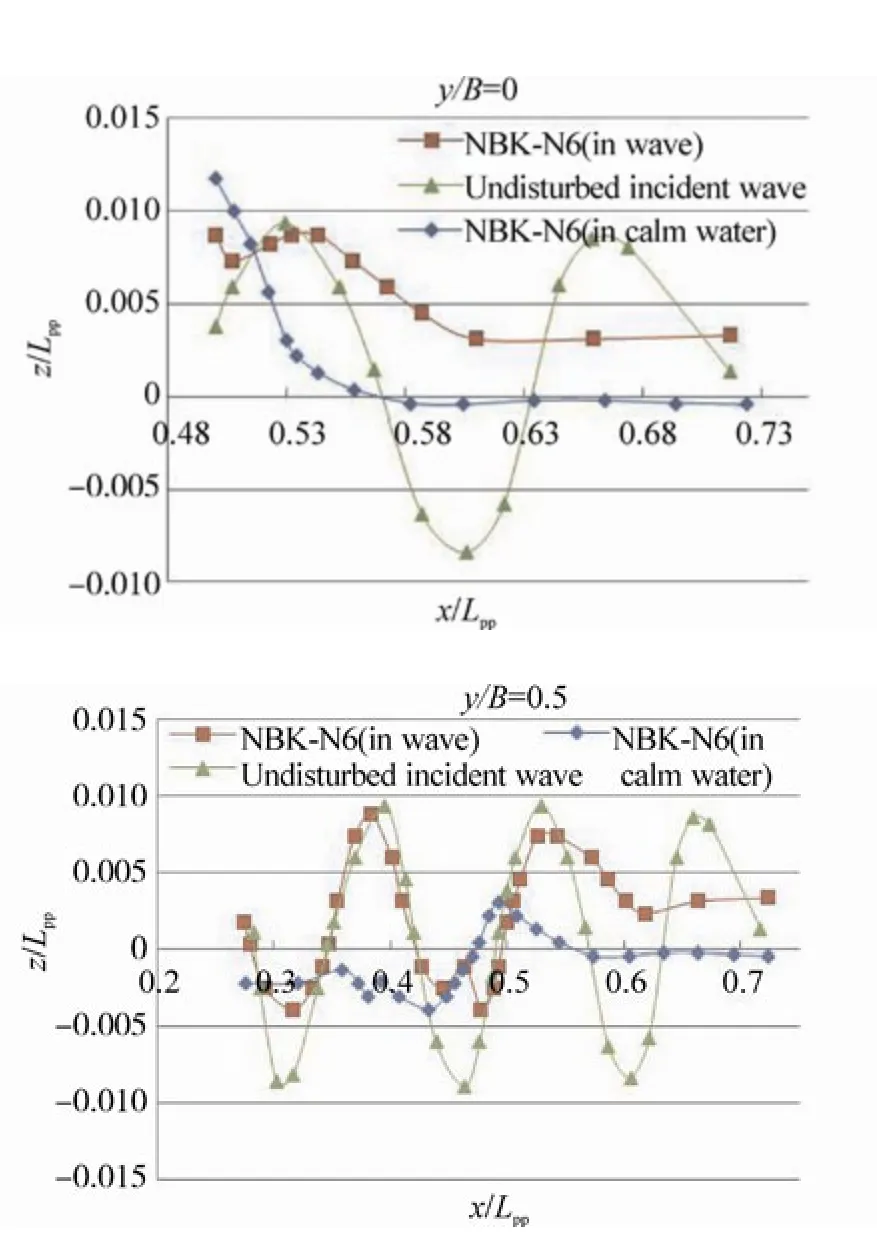
Fig. 22 Profiles of the waves around the bow of the NBK-N6 when the wave trough is at the bow (t =0.75τw),Hw=0.04m, λ/Lpp=0.3, and in calm water at Fn=0.163
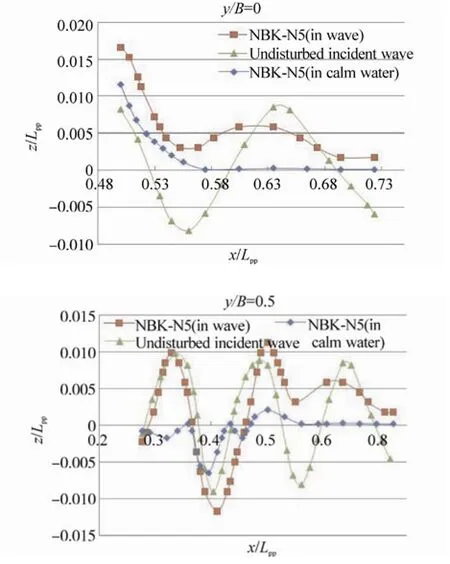
Fig. 23 Profiles of the waves around the bow of the NBK-N5 when the wave crest is at the bow (t=0.25τw),Hw=0.04m, λ/Lpp=0.3, and in calm water at Fn=0.163
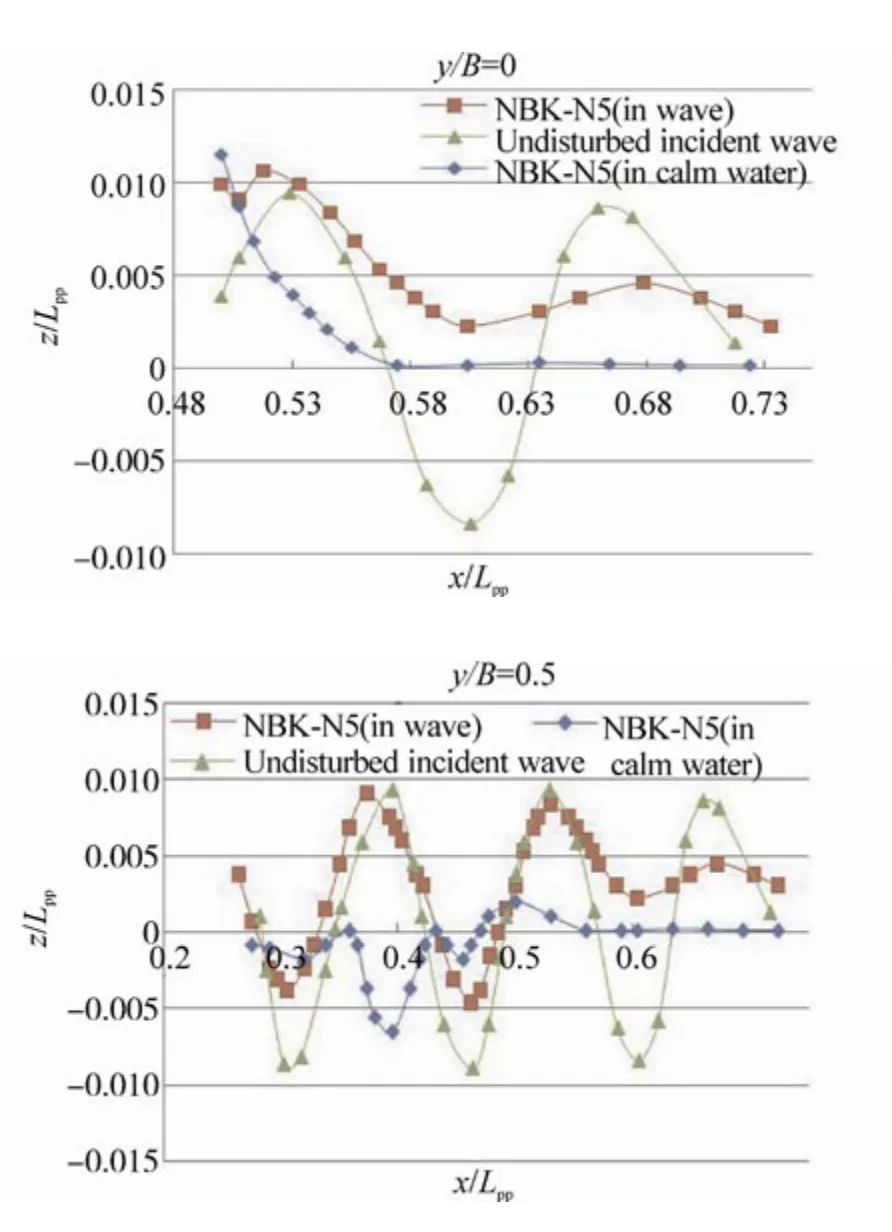
Fig. 24 Profiles of the waves around the bow of the NBK-N5 when the wave trough is at the bow (t=0.75τw),Hw=0.04m, λ/Lpp=0.3, and in calm water at Fn=0.163
Wave profiles on the center plane (y/B=0) and the side plane (y/B=0.5) near the bows (the bow is located atx/Lpp=0.5) are shown in Figs. 13~24. In the figures, x denotes the longitudinal axis, where plus of the x axis is defined from the aft to the front of the ship, the origin of which is at the mid-ship. Theyis the transverse axis, the origin of which,y=0 is located inat the centerline of the ship andzis the vertical axis, zero is set at the draft of the ship, where plus ofzis defined from the bottom to the upper direction. In the calculations, the relative wave lengths (λ/Lpp) are 0.3, 0.4 and 0.6, and the corresponding wave periods (τw) are 0.4 sec, 0.45 sec and 0.6 sec, respectively. The wave height (Hw) is 0.04 m.The wave profiles shown in these figures represent those at the moments when the wave crest locates near the bow(t=0.25τw) and when the wave trough locates near the bow(t=0.75τw).
The results ofλ/Lpp=0.3 shown in the upper section of Fig.13 demonstrate that when the wave crest locates near the bow’s edge, the wave runs up on the bow of the NBS-original up to about 2.5 times of the wave amplitude of the incident waves, and those of the NBK-N6 and the NBK-N5 run up to about 1.5 times. We can also see that large sinusoidal oscillations of incident waves disappear on the center plane in front of the bows and only small amplitude oscillations remain in front of the bows. The results of Fig. 14 at the moment when the wave trough locates near the bows show that higher water levels above the calm water surface are kept in front of the bows in a wave length.
Similar tendencies of the wave profiles can be seen in the calculated results for longer waves,λ/Lpp=0.4 and 0.6, as shown in the upper figures of Figs. 15~18.
Figs. 19~24 show the computed profiles of the waves around the bow of the ships in calm water and in waves. The results as shown in the figures are calculated with wave heightHw=0.04 m andλ/Lpp=0.3 at Froude number 0.163. As shown in Figs. 19 and 20, the amplitude of the waves around the bow of the NBS-original is the amplitude of the incident wave plus thewith amplitude of the wave caused by the ship running in calm water. These are the same as those of the NBS-original, but the waves from the bow of the NBK-N6 and the NBK-N5 are clearly reduced by half of the amplitude of the incident wave as shown in Figs. 21~24.The results demonstrate that there is a reduction in the added resistance acting on the hull of the NBK-N6 and the NBK-N5 with the developed bulbous bows.
3.2 Dynamic pressure distribution over the hull surface of the ships in high waves
Calculated dynamic pressure distributions over the hull surface of the ships running in high waves are shown in Figs.25~36. The dynamic pressures just outside of the boundary layers are shown in these figures. In the figures, the lower dynamic pressure area is shown in the blue area, where higher static pressure acts on the hull’s surface. The upper figures show pressure distributions on the half front half of the hull’s surfaces of the three ships, the middle ones show those on the half of the aft hull’s surfaces and the bottom ones show those on the side surfaces.
The pressure distributions forλ/Lpp=0.3 in a wave cycle are shown in Figs. 25~29 demonstrate that low dynamic pressure is widely spread out on the bow of the NBS-original and this pressure may cause larger added resistance due to the head waves. We can see some disturbed pressure distributions on the bow of the NBS-original due to spray. The pressure distributions on the half aft surface are slightly different among the three ships. This may suggest that viscous resistances are different among them.
The added resistance acting on the hull must increase if the area of low dynamic pressure on the half front half of the hull’s surfaces is wide. On the contrary, higher dynamic pressure (red or yellow area) on the surface reduces the resistance. From the results of the dynamic pressure distributions, we can know how the bow shapes change the flow around the hulls and the pressure over the hulls’s surfaces.
The results shown in this section suggest that the bulbous bow of the NBK-N5 reduces the area of low dynamic pressure and increases the high dynamic pressure area on the front half of the hull’s surface at the moment when the crest and the trough of the incident waves hit the bow.
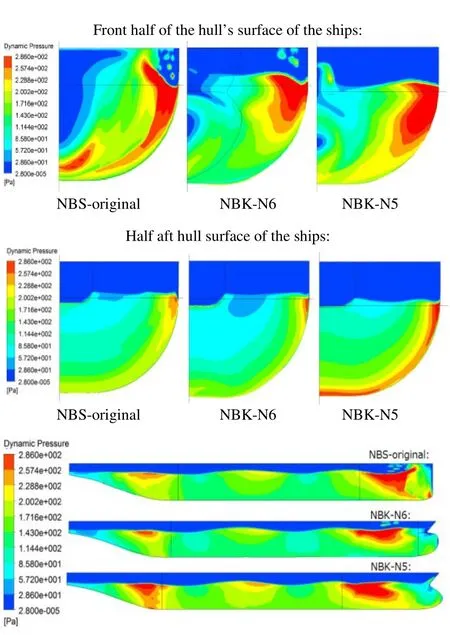
Fig. 25 Dynamic pressure distributions at the moment time 0 in waves, Hw=0.04m, λ/Lpp=0.3, Fn=0.163
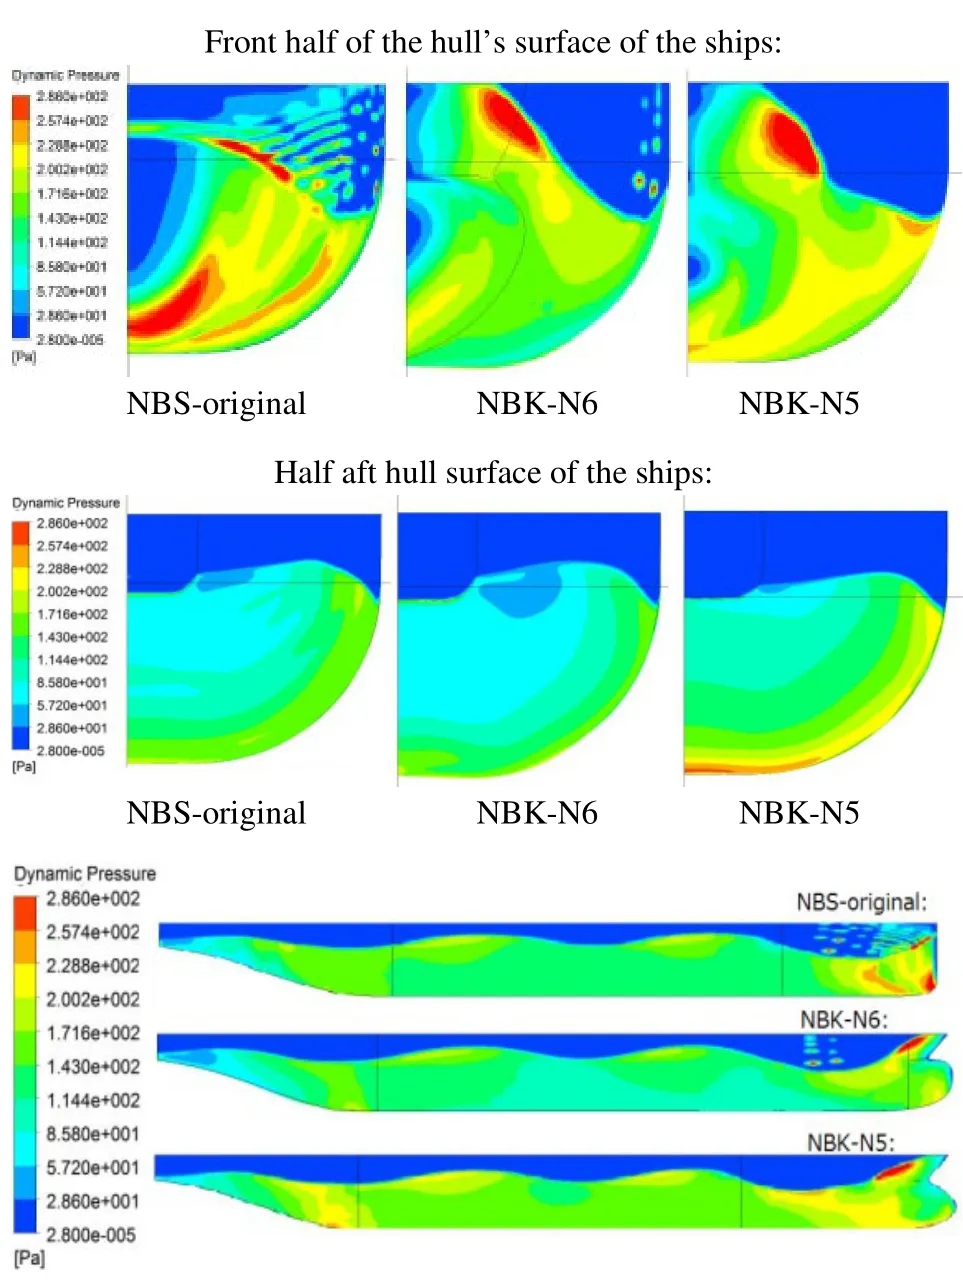
Fig. 26 Dynamic pressure distributions at the moment time 0.25τw in waves, Hw=0.04m, λ/Lpp=0.3, Fn=0.163

Fig. 27 Dynamic pressure distributions at the moment time 0.5τw in waves, Hw=0.04m, λ/Lpp=0.3, Fn=0.163

Fig. 28 Dynamic pressure distributions at the moment time 0.75τw in waves, Hw=0.04m, λ/Lpp=0.3, Fn=0.163
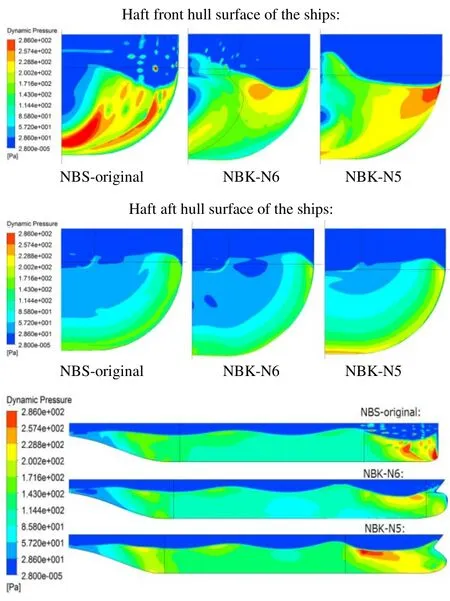
Fig. 29 Dynamic pressure distributions at the moment time τw in waves, Hw=0.04m, λ/Lpp=0.3, Fn=0.163
3.3 Velocity distribution in the boundary layer
In this section, the velocity distribution in the boundary layer at the centerline of the aft perpendicular (AP) of the ships running in high waves and in calm water are investigated by the CFD. It should be noted that the AP is located at the end of the stern. The incident wave is a head wave, its wave height (Hw) is 0.04 m, and its ratio of wave length to ship length (λ/Lpp) is 0:3.
In Fig. 30, the calculated velocity distributions of the three ships in calm water are shown. Slight differences between the NBS-original and the other two ships with bulbous bows can be seen. It can be said that the wakes at the stern end of the NBK-N5 is slightly weaker than that of the NBS-original and NBK-N6.
In Figs. 31~33, the calculated velocity distributions in high waves are shown in a wave cycle. The results show that the velocities in the boundary layers in waves are faster than those in calm water. This fact means that the wakes of the ships weaken due to head waves and suggests that propulsive efficiency of the ships is decreased by the head waves.

Fig. 30 Velocity distributions in the boundary layer at the centerline of the AP of the ships in calm water at Fn=0.163
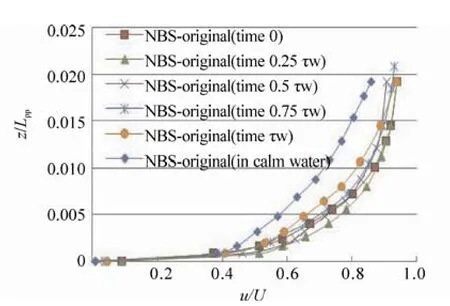
Fig. 31 Velocity distributions in the boundary layer at the centerline of the AP in one circle wave of the NBS-original running in a regular head wave at Fn=0.163, Hw=0.04 m, λ/Lpp=0.3
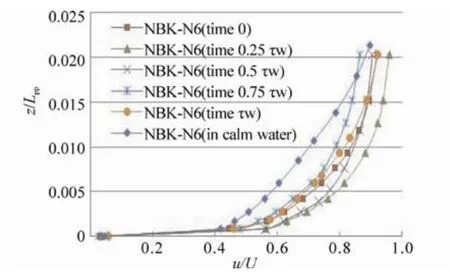
Fig. 32 Velocity distributions in the boundary layer at the centerline of the AP in one circle wave of the NBK-N6 running in a regular head wave at Fn=0.163, Hw=0.04 m, λ/Lpp=0.3

Fig. 33 Velocity distributions in the boundary layer at the centerline of the AP in one circle wave of the NBK-N5 running in a regular head wave at Fn=0.163, Hw=0.04 m, λ/Lpp=0.3
4 Added resistances acting on the ships in high waves
4.1 Added resistance acting on the ships in moderate waves, with wave height; Hw=0.02 m
In this section, resistance acting on the ships in regular head waves with wave height;Hw=0.02 m, and a ratio of wave length to ship length;λ/Lpp>lt;0.6 is shown in Figs. 34 and 35. The calculated results and the experimental results are also shown in the figures.Cwshown in Fig. 34 is the added resistance due to waves, and is defined as follows:.

whereCTis the total coefficient of a ship in waves and CT(0)is the total coefficient of the ship in calm water.
The results show that the CFD results are consistent with the experimental results. The experimental results demonstrate that the resistance acting on the NBK-N5 is the smallest among the three ships at the region ofλ/Lpp>lt;0.6. It can be said that the bow of the NBK-N5 can reduce the added resistance due to waves by 60% and the total resistance of waves by 15% as compared to the NBS-original.

Fig. 34 Comparison of the added wave resistance coefficient between the CFD and experimental results of the ships in waves, Hw=0.02 m at Fn= 0.163
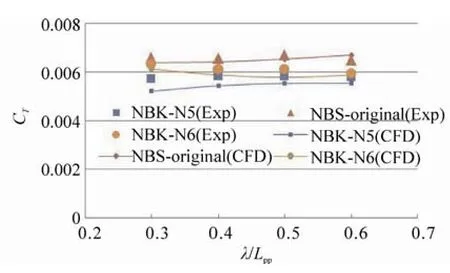
Fig. 35 Comparison of the total resistance coefficient between the CFD and experimental results of the ships in waves, Hw=0.02 m at Fn= 0.163
4.2 Added resistance acting on the ships in high waves,wave height; Hw>gt;0.02 m
Resistances acting on the three ships in high waves are calculated and measured at the towing tank at Osaka Prefecture University. The calculated results given by the CFD are compared with the experimental results to validate the CFD results. The wave used for the computations and the experiments is a regular head and a high one, where the ratio of wave length to ship length is kept atλ/Lpp=0.6, and the wave height is changed from 0.02 m to 0.07 m. The length of the ship is 2 m with the CFD and with the experiments.
The calculated and measured results of resistances acting on the ships are shown in differently defined coefficients in
Figs. 36~39. As shown in the figures, agreements between the CFD results and the experimental ones are good.
The results of added resistance in terms of a common resistance coefficient shown in Fig. 36 demonstrate that the bulbous bow of the NBK-N5 significantly decreases added resistance in high waves and that the NBK-N5 is the best hull form for reducing the total resistance acting on the hull in shorter waves.
Fig. 37 shows the results of the added resistances due to waves in terms of another coefficient defined as follows:

Both calculated and experimental results clearly show that the coefficients decrease with increasing wave height. This means that added resistances acting on the ships are not proportional to the square of the wave height.
Fig. 38 shows the total resistance coefficients of them in the waves, and Fig. 39 shows the increasing rate of the total resistances due to head waves. The calculated results demonstrate that the resistance in waves of the NBS-original increases by double of it in calm water at a wave height of 0.045 m, but that the resistance of the NBK-N5 reaches double at a wave height of 0.07m with the 2 m models.

Fig. 36 Computation and measurement of the added wave resistances coefficient acting on the ships in high waves, λ/Lpp=0.6 at Froude number 0.163
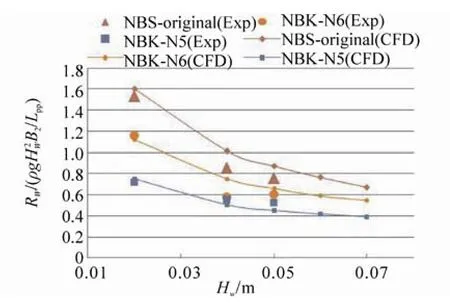
Fig. 37 Computation and measurement of the added wave resistances coefficient acting on the ships in high waves, λ/Lpp=0.6 at Froude number 0.163
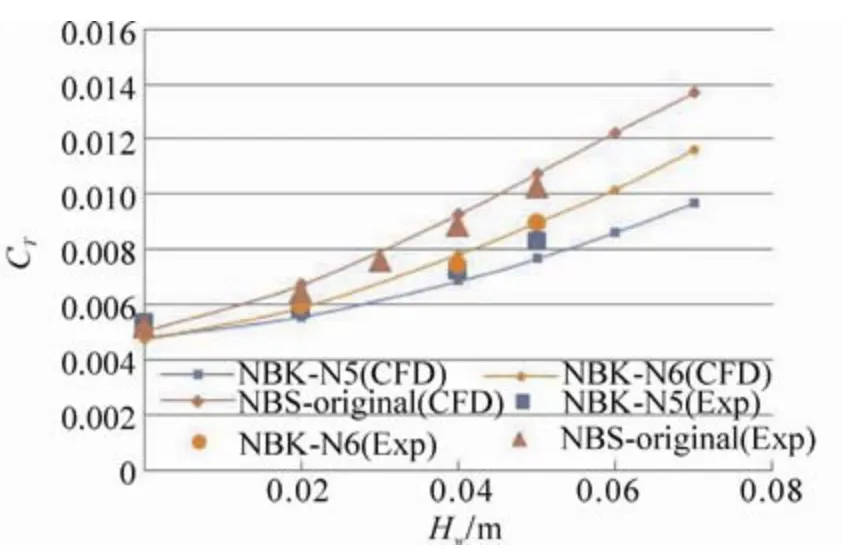
Fig. 38 Computation and measurement of the totalresistances coefficient acting on the ships in highwaves, λ/Lpp=0.6 at Froude number 0.163
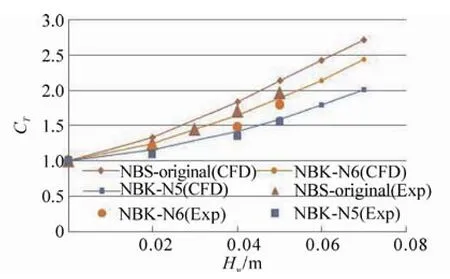
Fig. 39 Computation and measurement of the ratio of the total resistances coefficient in waves by the total resistance coefficient in calm water of the ships,λ/Lpp=0.6 at Fn=0.163
5 Conclusion
In this paper, the performances of three kinds of non ballast water ships with and without bulbous bows in regular head waves are theoretically and experimentally investigated. The following conclusions were obtained.
1) The CFD “ANSYS-Fluent” gives us fairly good results for the resistances acting on the hulls of the ships in regular head waves, with the height of waves;Hw>gt;0.02 m. The computed results including pressure distribution, waves and profile of wave patterns are useful to understand the causes of the reduction of added resistance.
2) Using the CFD, the best bow form for the non ballast water ships in head waves with shorter wave lengths can be determined. It has been experimentally confirmed that this form has the minimum resistance in head waves.
3) The model NBK-N5 is confirmed to be the best one in this research. It can significantly reduce the total resistance in shorter head waves.
4) Reduction of the total resistance of the NBK-N5 in head waves is maintained even in high waves.
5) It was theoretically and experimentally confirmed that added resistance due to waves is not proportional to the square of the wave height. The CFD can correctly show the dependency of the added resistance on wave height.
He NV, Nihei Y, Ikeda Y (2011). A study on application of a commercial cfd code to reduce resistance acting on a non ballast tanker - Part 1.The Japan Society of Naval Architects and Ocean Engineers, Kobe, 415-418.
He NV, Nihei Y, Ikeda Y (2012). A Study on application of a commercial CFD code to reduce resistance acting on a non ballast tanker – Part 2.The 6th Asia-Pacific Workshop on Marine Hydrodynamic, Johor, 264-269.
He NV, Ikeda Y (2013). Optimization of bow shape for a non ballast water.Journal of Marine Science and Application, 12(3),251-260.
Tatsumi T, Nihei Y, Ikeda Y (2010). Development of a new energy saving tanker with non ballast water and podded propulsor.The 5th Asia-Pacific Workshop on Marine Hydrodynamic,Osaka,25-28.
Tatsumi T, Nihei Y, Ikeda Y (2011). Development of a new energy saving tanker with non ballast water - Part 1.The Japan Society of Naval Architects and Ocean Engineers, Fukuoka, 216-218. (in Japanese)
Tomita A, Nihei Y, Ikeda Y (2011). Development of a new energy saving tanker with non ballast water - Part 2.The Japan Society of Naval Architects and Ocean Engineers, Fukuoka, 219-222. (in Japanese)
杂志排行

Journal of Marine Science and Application的其它文章
- Hard Foulers Induced Crevice Corrosion of HSLA Steel in the Coastal Waters of the Gulf of Mannar (Bay of Bengal), India
- An Approximate Method for the Surge Response of the Tension Leg Platform
- CFD Simulation of the Vertical Motion Characteristics of the Moonpool Fluid for the Truss Spar
- Dynamic Coupled Analysis of the Floating Platform Using the Asynchronous Coupling Algorithm
- Numerical Investigation of Mooring Line Damping and the Drag Coefficients of Studless Chain Links
- Floating Production Platforms and their Applications in the Development of Oil and Gas Fields in the South China Sea