Numerical Investigation of Mooring Line Damping and the Drag Coefficients of Studless Chain Links
2014-07-30ZhengqiangXuandShanHuang
Zhengqiang Xu and Shan Huang
Dept. of Naval Architecture and Marine Engineering, University of Strathclyde, Glasgow,Henry Dyer Building, 100 Montrose Street, Glasgow G4 0LZ1, UK
1 Introduction0F0F 1
The low frequency (LF) motion and mean offset of a floating structure increase considerably as water depth increases. It is noticed that the offset related to the LF motion and mean offset accounts for 50% at a depth of 70 m,while this value jumps to approximately 95% of the total offset at a depth of 2000m (Ormberg and Larsen,1998).Hence, for the design of the mooring system in deepwater which requires the knowledge of large amplitude motions and the corresponding forces, it is of prime importance to predict the mean offset and LF motion.
The LF surge motion amplitude of the low-damped moored system is dependent on the system damping, since the natural surge frequency of the system is close to the frequency of slow drift forces. Previously, when predicting the motions of a moored system, the damping of the moorings/risers was often neglected, because the drag areas represented by the moorings/risers are quite small when compared to that of the vessel. However, according to some other studies, the damping of the moorings/risers is quite considerable. For instance, the main contribution (as much as 80%) to the surge damping of the moored system can be the mooring line damping, which is mainly caused by the drag force acting on the mooring lines (Huse and Matsumoto, 1989).
A large amount of research has been carried out to predict the magnitude of the mooring line damping. Most of the theoretical calculation results are consistent with the experiment results when only the LF motion is taken into account, while a big discrepancy still exists between the theoretical calculations and the experimental results in the case of LF superimposed with high frequency (HF) motions.For instance, in the study conducted by Huse and Matsumoto (1989), they found that with the superimposed HF motions the calculations over-predict the mooring line damping by a factor in the range of 1.2 to 2. Similarly,Brown and Mavrakos (1999) found that with only drift-induced oscillation the numerical values are in fair agreement with the experimental data, while for combined wave and drift motions, the agreement is not good with the numerical mean values over-predicting the experimental values by 70%. A possible reason for the discrepancies is the selection of the drag coefficients.
When calculating damping contributions as well as current/wave loading of mooring lines, it is crucial to apply proper drag coefficients, which actually is very difficult to achieve due to several factors. Firstly, there is limited knowledge about the exact values of the drag coefficients because of the complexity of the problem. Typically, a range of values for the drag coefficients is recommended and specified in related rules, such as DNV-RP-C205 (DNV,2010a) and DNV-OS-E301 (DNV, 2010b). For example,with DNV-RP-C205, the recommended value of the normal drag coefficient is 2.2-2.6 for the stud chain and is 2.0-2.4 for the stud-less chain. These typical values for the Reynolds numbers in the range of 104−107are normal for the longitudinal slender structure axis and if they are without effects from marine growth or any influence from oscillations. Secondly, most of the drag coefficient values obtained through experiments in steady flows have some discrepancies between different towing tests (Wichers and Dercksen, 1994). Although experiments of chains in oscillating flows have been done (Lyonset al., 1997; Young,2007), these experiments are limited to low-Re numbers(103−104) and large scatter exists among these results.
Along with the development of high-performance computers, CFD methods have become increasingly popular.Ongoing research yields software that improves the accuracy and speed of complex simulation scenarios such as transonic or turbulent flows. High Reynolds-number flows past bluff bodies, such as square cylinders, have been simulated with admirable accuracy by the use of CFD methods. It therefore becomes possible to attempt to determine the drag coefficients of chain links through the application of CFD methods.
The paper is organized as follows: Section 2 investigates the importance of the selection of drag coefficients for the damping of moorings. In Section 3 the numerical model validation is conducted by simulating a smooth circular cylinder under steady flows. The Re-dependence of the drag coefficient of a circular cylinder is assessed by using different turbulence models. Based on the performance of different turbulence models, the large eddy simulation (LES)model is selected to study the effects of the Reynolds number on the drag coefficient of a stud-less chain in Section 4. Concluding remarks are given in Section 5.
2 Mooring line damping and its sensitivity to CD variations
The calculations of the mooring line damping in the surge direction is completed by the ‘indicator diagram’ method(Webster, 1995). The ‘indicator diagram’ can be derived by plotting the time history of the top-end surge motion against the time history of the horizontal force. The area under the resulting closed loop is then related to the energy dissipationE

whereSis the LF surge motion associated with the periodT;HFis the corresponding horizontal force.
For sinusoidal motionS=Aosin(2πt/T), the equivalent linear dampingccan be given by:

The damping of the moorings is mainly due to the fluid viscous drag force acting on the mooring lines. For such slender structures, the hydrodynamic loads are usually calculated by using the semi-empirical Morison equation,which is formulated below:

whereCMis the inertia coefficient;CDis the drag coefficient;ρis the fluid density;Uis flow velocity;
U>gt; is flow acceleration;Dis the effective diameter of the slender cylinder structure;F(t) is the hydrodynamic force on the unit length of the slender structure.
It can be seen that forces are directly related to the hydrodynamic coefficientsCDandCM, which vary with the various flow parameters, such as the Reynolds number,Keulegan-Carpenter numberKCand the roughness of the surface. However, in most of the publications about mooring line damping, the drag coefficientsCDare assumed to be constant (Webster, 1995; Sarkar and Taylor, 2000;Johanninget al., 2007), although it is known that the variations ofCDcould have a considerable effect on the mooring line damping.
It is desirable to know which part of the mooring line is more sensitive to the variations of the drag coefficient when calculating the damping of moorings. This is studied by a chain-wire-chain combination at a water depth of 400m. The lay-out and dimensions of the mooring line are illustrated in Table 1 and Fig. 1.

Table 1 Constitutions and dimensions of a single mooring line

Fig. 1 Layout of a single mooring line
The drag coefficient for the stud-less chain is selected as 2.3 based on the nominal diameter and for the wire is 1.2.The energy dissipations of the mooring line under 4 different top surge-direction motions are calculated respectively with given drag coefficients, as listed in Table 2.It can be seen that with superimposed HF motions, the energy dissipation (mooring line damping) could increase dramatically when compared to the case with the LF motion only. This significant effect of superimposed HF motions on mooring line damping was first emphasized by Huse and Matsumoto (1988).
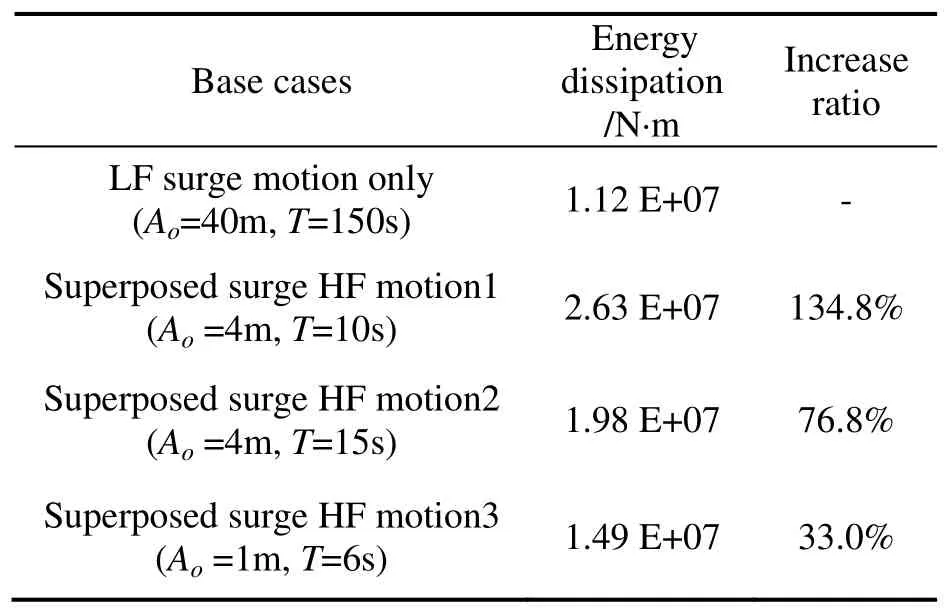
Table 2 Energy dissipation of a single mooring line under different motions
To study the sensitivity of mooring line damping due toCDvariations along the line, the chain and wire are divided into many segments with the same length (in the present study, it is 10 m per segment). The smallCDvariation(ΔCD) is made each time for only one segment. According to the Taylor series, the energy dissipation variation due to the small ΔCDcan be written as:

whereE(CD)is the base energy dissipation;E(CD+ΔCD)is the new energy dissipation due to theCDvariation at one segment.
BothE(CD)andE(CD+ΔCD)can be calculated. Then for each segment of mooring line, the variation-sensitivity of energy dissipation due to theCDvariation can be calculated by:

For each of the cases given in Table 2,E′(CD) is evaluated and plotted along the arc-length in Fig. 2. For the energy dissipation variations due toCDvariations, the most sensitive parts along the line are at the top side and touch down area, which are usually composed of chain links for a chain-wire-chain combination line.This indicates the importance of determining the drag coefficients of the chain links. Additionally, compared to the situation with the LF motion only, the cases with the superposed HF motions are becoming more sensitive with the energy dissipation variation caused byCDchange, especially at the touch down area.
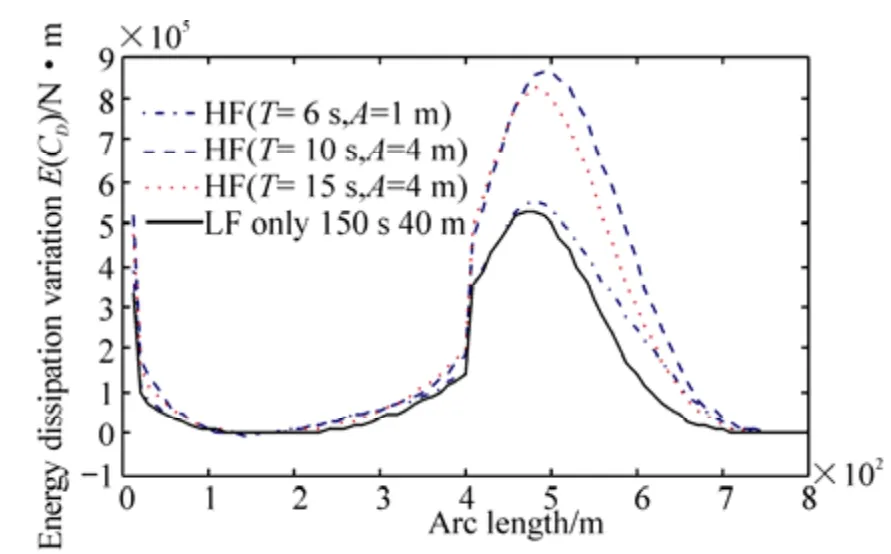
Fig. 2 Comparison of energy dissipation variations due to CD variations under different motions
3 CFD model validation - steady flows past a smooth cylinder
The validation of the CFD model for steady flow past chain links is done by the CFD simulation of a circular cylinder under steady flows. The reasons for selecting a circular cylinder is twofold. Firstly, flow characteristics around the chain and the circular cylinder could be similar due to the shape similarity; secondly, as a classic problem,lots of experimental data about the flow past a circular cylinder is available, which makes the CDF model validation much easier.
3.1 Numerical methods
The SSTk−ωmodel of the URANS approach and LES are selected here to simulate the turbulent flow around a cylinder. The selection of the SSTk−ωmodel is due to the fact that this model proposed by Menter and Rumsey(1994) is mainly for separated flows under adverse pressure gradients, which is exactly experienced by circular cylinders under steady flows. It would be quite desirable for engineering practice if results with acceptable accuracy could be obtained by this turbulence model with low computing costs. The reason for the selection of the LES model is its commendable performance (Breuer, 1997;Breuer, 1998; Breuer, 2000; Kim and Mohan, 2005).Although LES is comparatively more expensive with its computing costs, with the recent advances in computing power the LES is nearly ready and feasible for practical applications.
The boundary conditions and computation domain are selected as follows: the upstream with the ‘velocity inlet’boundary condition is located at 15Dupstream and the boundary condition ‘pressure outlet’ is located at 25Ddownstream from the centreline of the cylinder. The‘symmetry’ boundary condition is placed at the top and bottom boundaries 10Dfrom the cylinder ax which form a blockage ratio of 5% for the cylinder. The span-wise length ofDπis used to guarantee that the span-wise extent is larger than the span-wise correlation length for all the Reynolds numbers in the sub-critical regime. The ‘periodic’boundary condition is applied to the pair of lateral boundaries in the span-wide direction. No slip ‘wall’boundary condition is applied to the cylinder wall.
Turbulent flows could be significantly affected by the presence of walls where the viscosity-affected regions have large gradients in the solution variables. So the near-wall hexahedral mesh with the distance of 10−4Dfrom the cylinder surface at the wall-adjacent cells is created, which aims to directly resolve the near-wall region by keeping desirable values of+yless than 1 for all the Reynolds numbers at the sub-critical regime. The successive ratio(growth ratio) along the radial direction of the cylinder surface is approximately 1.08, which could guarantee more than 10 cells in the laminar region. The mesh along the circumferential direction has 160 wall-adjacent cells that can properly incorporate the cylinder curvature. Three different cell numbers (Nz=48/64/80) along the span-wise direction generate three different mesh cases with a total number of cells from 1.26 to 2.10 million. The effects of the mesh resolution along the span-wise direction will be discussed later.
3.2 Results and discussions
3.2.1 Re-dependent global flow parameters
The numerically predicted global flow parameters, such as the mean drag coefficient, RMS of the lift oscillations, are compared with the available experimental values (Scheme,1983; Hallamet al., 1977), as shown in Fig. 3 and Fig. 4.The numerical results of the global flow parameters obtained by LES are in a fairly good agreement with the experimental values, while the SSTk−ωturbulence model over-predicts the meanCDand RMS of the lift for small Reynolds-number flows and significantly under-estimates the meanCDfor higher Reynolds-number flows. The 2D and 3D URANS models got almost similar results for flows past a cylinder at higher Reynolds numbers.
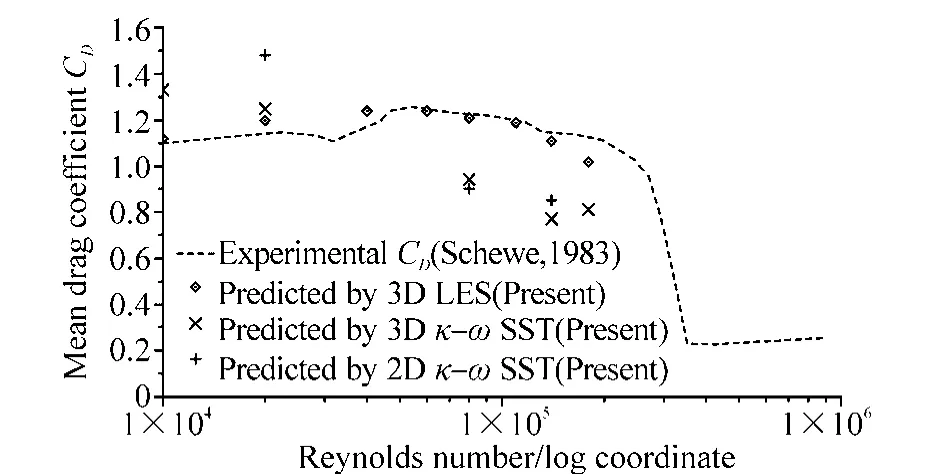
Fig. 3 Calculated drag coefficients of a smooth cylinder as a function of Re by different models
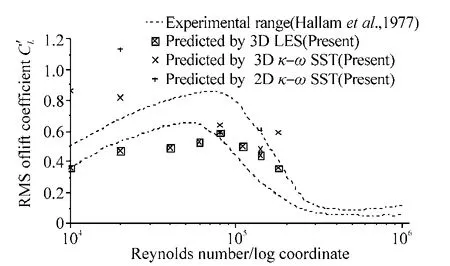
Fig. 4 Predicted RMS of the lift coefficient of a smooth cylinder as a function of Re by different models
3.2.2 Comparative assessment of URANS and LES for flow past a cylinder at a high Reynolds number of1.4×105
The time histories of the hydrodynamic coefficients (drag and lift) obtained from LES and 3D URANS models are illustrated in Fig. 5. The time traces of the force coefficients calculated by the LES model reveal the quasi-periodic behaviour of the drag and lift coefficients, with their amplitudes varying irregularly over time, while the time histories from the URANS model partly failed to capture this characteristic.
An accurate prediction of pressure distribution around the cylinder surface is critical to realistically calculate the forces on the cylinder, therefore, the time averaged pressure distribution on the cylinder surface calculated by LES and 3D URANS models is shown in Fig. 6, together with the experimental data obtained by Cantwell and Coles (1983).

Fig. 5 Time histories of the force coefficients by different turbulence models (Re=1.4×10⁵)
The negative peak predicted by the numerical method is bigger than the measured one, especially for the SSTk−ωmodel. However, good consistency exists between the measurement and LES model concerning the separation angle deduced from the inflection point of the meanCPcurve, while the separation angle predicted by the SSTk−ωmodel is comparatively larger. That could partly explain why the mean drag coefficient calculated by this URANS model is much smaller than the measured value.
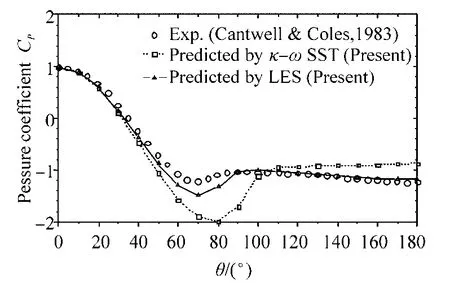
Fig. 6 Mean pressure coefficient on the cylinder surface for(Re=1.4×10⁵)
Fig. 7 depicts the predicted mean stream-wise velocities along the wake centreline by two different turbulence models. There is fair overall agreement between the predictions and the experimental measurement. Considering the poor performance of URANS in predicting the global flow parameters, it is of little surprised to see that the 3D URANS model was even able to get much better results in predicting the mean stream-wise velocities. As can be seen from Fig.7 and Fig. 8, the length of the time-averaged recirculation bubble predicted by the LES model is found to be a little bigger than the one predicted by the URANS,which is much closer to the value that was reported by Cantwell and Coles (1983). According to the study conducted by Franke and Frank (2002), the length of the average time in LES has a notable influence on the accuracy of the statistical quantities, such as the recirculation bubble length. For instance, it was found that with the increase of the number of averaging cycles, the recirculation length also increases.In the present study, the mean stream-wise velocity,mean pressure coefficient and recirculation length were obtained by 50 averaging cycles, which are sufficiently big compared to those used by Franke and Frank (2002).
3.2.3 Three-dimensional effects
For steady flows past a cylinder atRe>gt;200, the two-dimensional features of the vortex shedding in the range 40 >lt;Re>lt; 200 become distinctly three-dimensional. The three-dimensional effect of the vortex shedding could be considerable in predicting the forces, and hence are investigated by considering the grid resolution along the span-wise direction. Listed in Table 3 are the results obtained by different turbulence models under different mesh resolutions for steady flow past a cylinder at aRenumber of 8× 10⁴. It can be seen that the LES is only effective when a sufficient number of cells in the span-wise direction are used to resolve the smaller three-dimensional eddies, while the 3D URANS model is not sensitive to the mesh resolution along the span-wise direction.

Fig. 7 Comparison of the mean stream-wise velocity alongthe centreline aft of the cylinder (Re=1.4×10⁵)
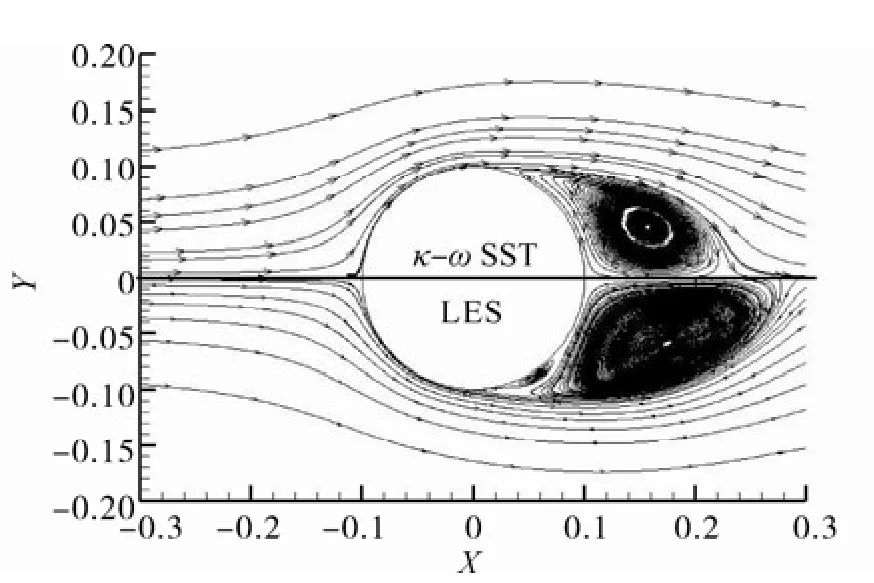
Fig. 8 Streamline of the time-averaged flow by different turbulence models (Re=1.4×10⁵)

Table 3 Impact of the span-wise-cell number on numerical results for steady flows past cylinders (Re=8×10⁴)
In fact, in the study from Young and Ooi (2007), the effect of the span-wise mesh resolution was considered for the steady flow past a cylinder at Re = 3900. They found that the 16-span-wise-cell LES case offered similarly poor results as the 3D URANS case with the same grid, while the 32/48 span-wise-cell LES cases got fairly good results.
The three-dimensional vortex structures can be further presented by iso-surfaces of vorticity magnitude of the LES model, as shown in Fig. 9. However, for the 3D URANS model, the flow-field in the wake is essentially two-dimensional as with the 2D URANS model (see Figs.10-11). This also explains why increasing the span-wise cell number of the 3D URANS model didn’t improve the results.
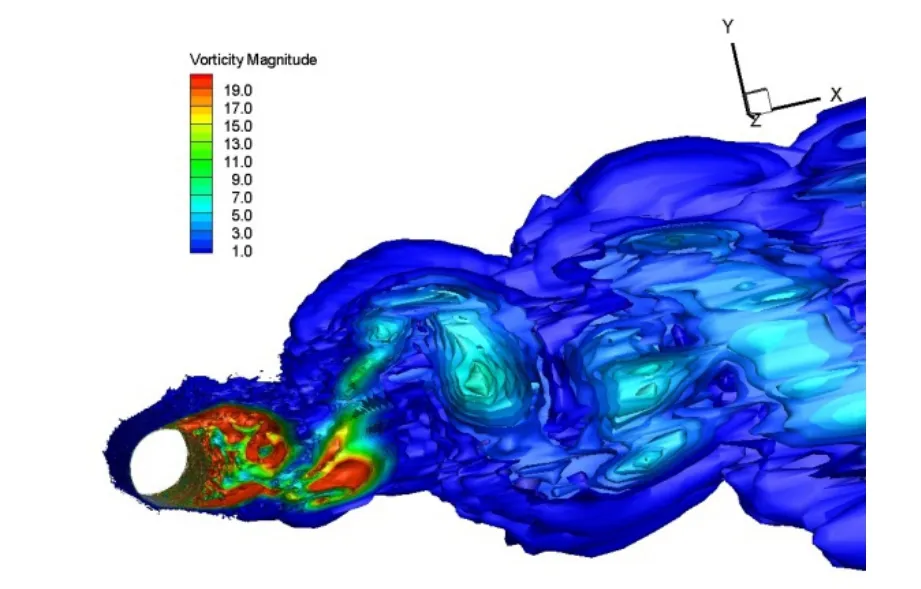
Fig. 9 Iso-surface of vorticity magnitude by the LES model(Re=1.4×10⁵)
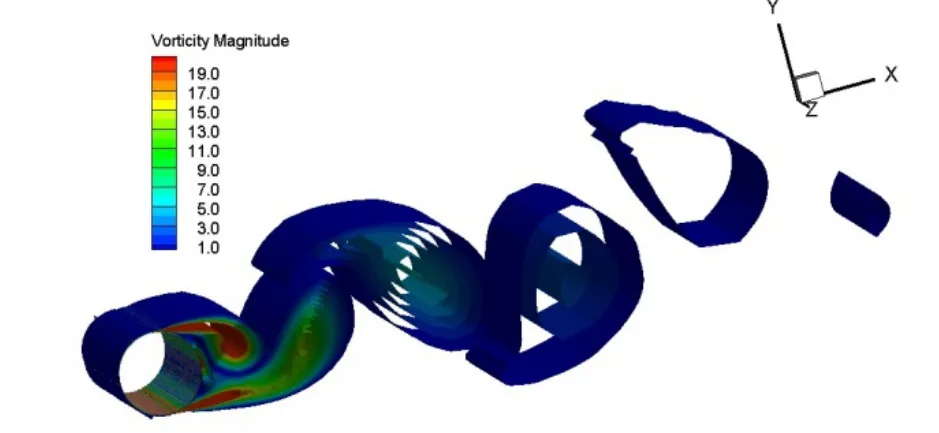
Fig. 10 Iso-surface of vorticity magnitude by 3D URANS model (Re=1.4×10⁵)
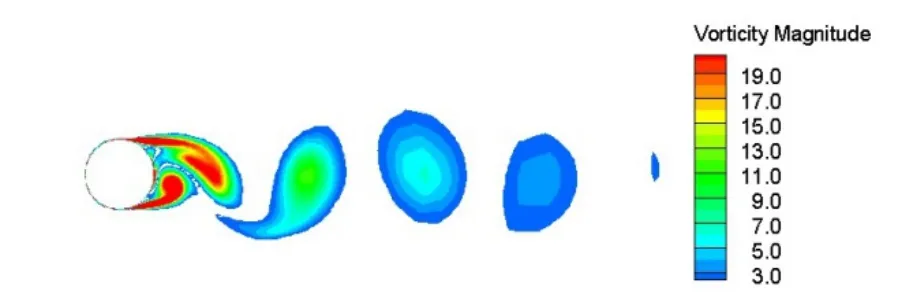
Fig. 11 Iso-surface of vorticity magnitude by 2D-URANS model (Re=1.4×10⁵)
4 Numerical calculation of CD of a studless chain
For the model validations, the LES model is selected to simulate steady flows past a stud-less chain, where the effect of the flow direction and Reynolds number are studied for the stud-less chain with its geometry illustrated in Fig. 12.

Fig. 12 Geometrical model of a stud-less chain (Orcina,year).
4.1 Numerical method
According to the geometrical periodicity of the stud-less chain, a chain segment composed of a complete chain and two half-chains is selected as the simulation object, as shown in Fig. 13. Correspondingly, the ‘periodic’ boundary condition is applied to the top and bottom sides along the span-wise direction. The span-wise length of the chain segment is 8D(D: nominal diameter of the chain). The upstream and downstream boundaries are located 10Dand 25Dfrom the centre-line of the chain segment, while the‘velocity inlet’ and ‘pressure outlet’ boundary conditions are applied to the upstream and downstream boundaries,respectively. The ‘symmetry’ boundary condition is applied to the left and right sides which are 10Dfrom the centre-line of the chain segment. The no-slip ‘wall’condition is applied to the chain surface.
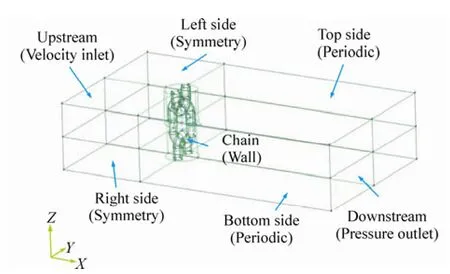
Fig. 13 Illustration of the boundary conditions of a stud-less chain segment
Hybrid meshes including hexahedral, wedge and tetrahedral meshes are used to discretize the space of the computational domain due to the complexity of the chain geometry, as illustrated in Fig. 14.
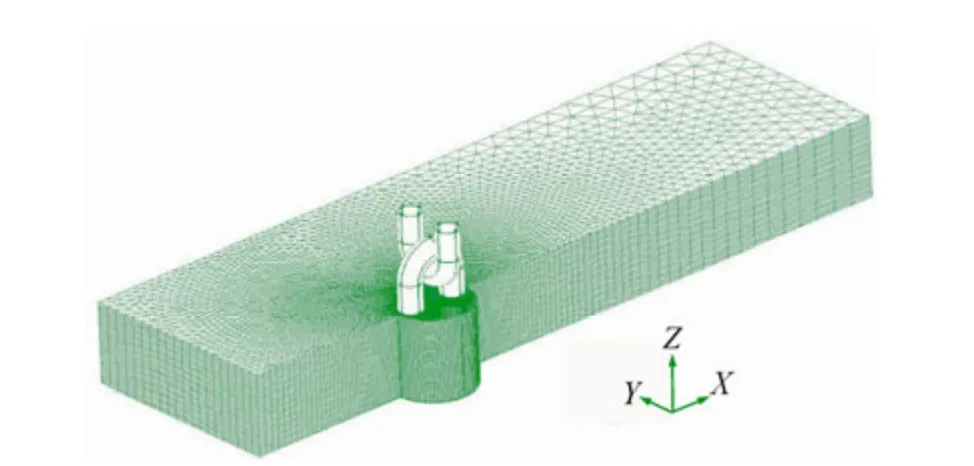
Fig. 14 Computational grids for the chain segment (mesh partly displayed)
In order to better solve the turbulent boundary layer near the surface of the chain segment, a structured mesh with hexahedral cells is used in the inner layer of the wall (Fig.15). This is achieved by separating the connected point of two chain links with a gap of 10%D. This gap is quite small compared to the span-wise length of the chain link and as a result, its effects are deemed as small or negligible. The distance from the wall surface at the wall adjacent cells is 5×10⁻⁵Dto achieve a desirabley+less than the unity of all the Reynolds numbers considered. The total number of cells is approximately 7.7 million.
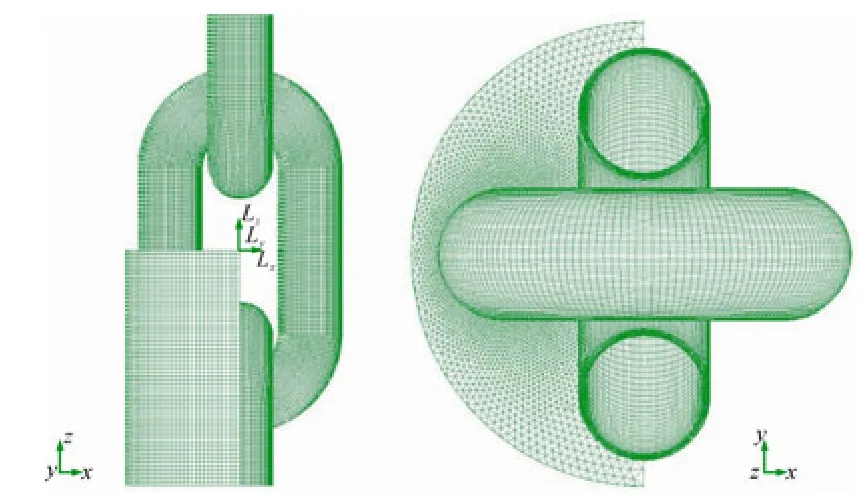
Fig. 15 Local grids in the cylindrical domain with structured mesh around the chain
4.2 Results and discussions
The Reynolds number and Strouhal numberStfor the flow past a fixed chain segment are defined as below:

whereU∞is the steady flow velocity;Dis the nominal(bar) diameter of the chain;υis the fluid kinematic viscosity;fis the frequency of vortex shedding.
The drag coefficientCDand lift coefficientCLof a stud-less chain are defined as follows:

whereFDis the drag force on the chain segment;LFis the lift force on the chain segment;U∞is the faraway flow velocity;Lis the length of the chain segment(L=8D);Dis the nominal diameter of the chain;ρis the fluid density.
4.2.1 Effects of flow directions
Three different flow directions have been considered for steady flow past a chain segment, as shown in Fig. 16. To study the effects of the flow direction, steady flow past a chain segment at the Reynolds number of 6×10⁴is considered for these three situations. The calculated drag coefficients for the different cases are summarized in Table 4

Table 4 Impact of the flow direction on the drag coefficient of a stud-less chain (Re=6×10⁴)
It can be seen that the predicted values ofCDare quite similar for these three flow angles. This is especially true for the 0-degree-flow case and 90-degree-flow case, which is quite reasonable due to the geometrical characteristics of the chain. In summary, the effects of flow direction (at least for these three directions) on the drag coefficient of the stud-less chain can be ignored.
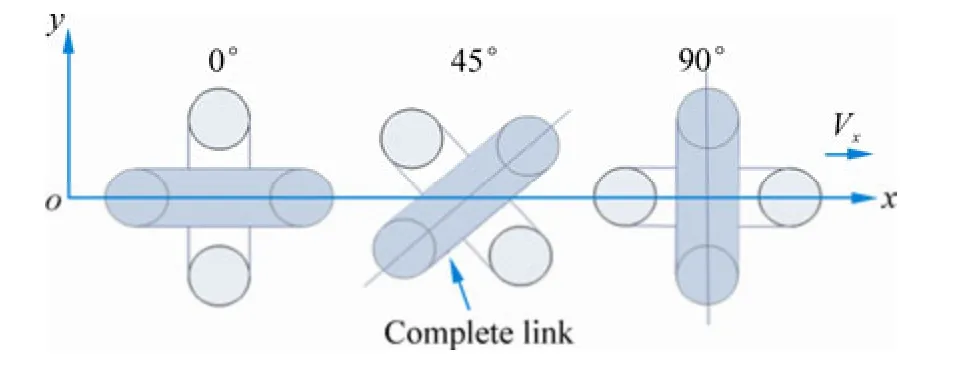
Fig. 16 Direction definition of the steady flow past a chain segment
Illustrated in Fig. 17 are the time histories of the force coefficients of the chain for 0-degree flow atReof 6×1 04.Using a power spectrum analysis of the lift coefficient history, it can be seen that no obvious single frequency of vortex shedding can be identified, as shown in Fig. 18. This is totally different from the steady flow past a smooth cylinder at this Reynolds number which has a dominant vortex shedding frequency and corresponding Strouhal number.
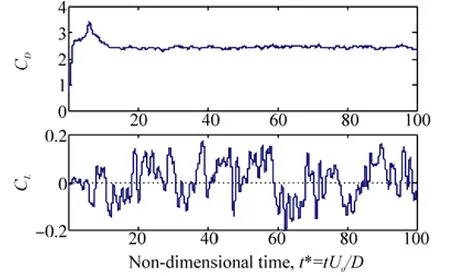
Fig. 17 Time histories of the predicted force coefficients of the chain by LES (Re= 6×10⁴, 0°flow)
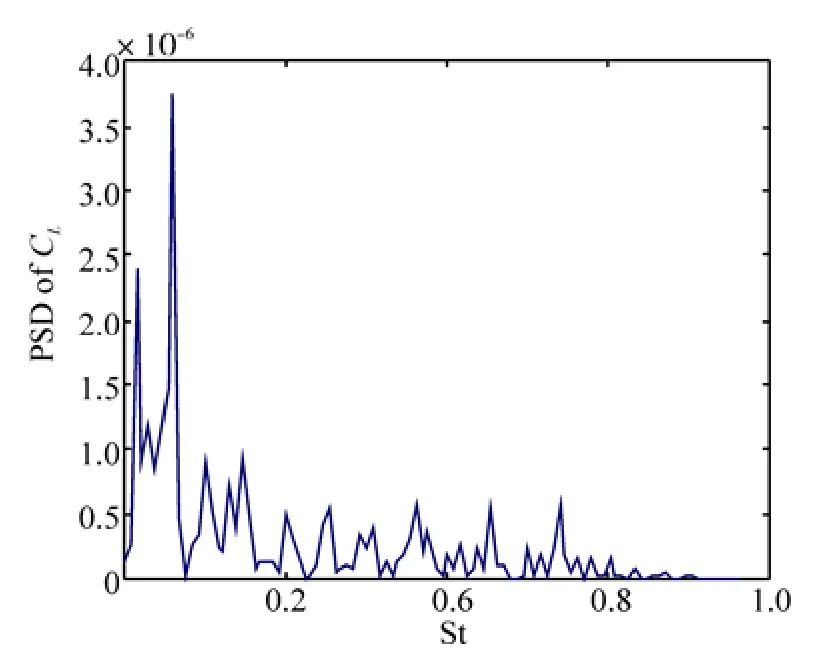
Fig. 18 Statistical properties of the lift coefficient of thechain segment (Re= 6×10⁴, 0°flow)
4.2.2 Effects of Reynolds numbers
Taking the steady flow with a flow direction of 0 degrees,the impact of the Reynolds number on the drag coefficient of the chain is considered. The calculated drag coefficient as a function of Re is illustrated in Fig. 19, together with the recommended value-range from DNV-RP-C205.
It can be seen that with the increase of the Reynolds number, the predicted drag coefficient of the stud-less chain decreases. There is also strong consistency between the predictedCDand the recommended values. From the experience of LES modelling the steady flow past a smooth cylinder, it is known that without enough grids along the span-wise direction, the predicted drag coefficient from the LES is a little smaller than the experimental value for a high Reynolds number. In the present study, 160 cells along the span-wise direction ( 8Dlength) is used in the mesh model of the stud-less chain links, which may not be enough for the higher Reynolds number considered here (3× 10⁵). It could explain why the LES predicted drag coefficient of the chain decreases fast with the increase of the high Reynolds number.
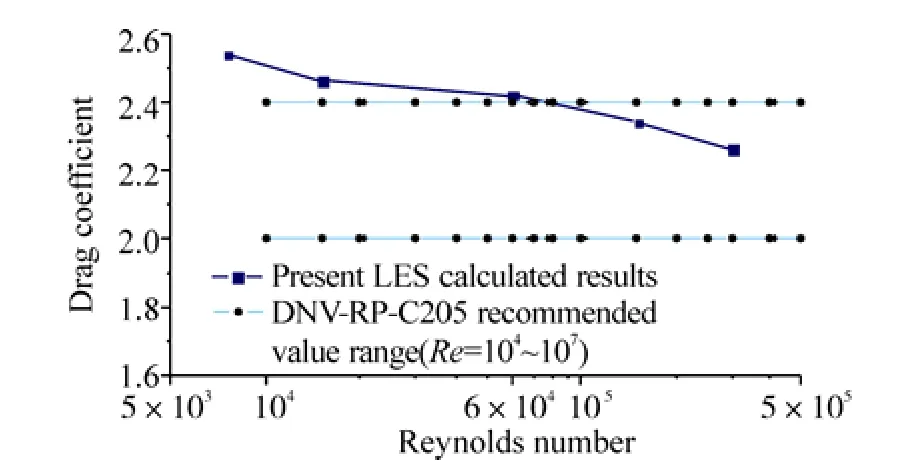
Fig.19 Predicted drag coefficient of the stud-less chain as a function of the Reynolds number
5 Conclusions
By investigating a chain-wire-chain mooring system, the sensitivity of energy dissipation (damping) variations due toCDvariations has been ascertained. It was found that the damping of the touch-down area is more sensitive to theCDvariation. This shows the importance ofCDselection for chain links. The CFD method is then adopted to determine the Re-dependentCDvalues of a stud-less chain. The Numerical model validation is completed by simulating steady flows past a smooth circular cylinder. Through the comparisons it can be seen that the LES model can well predict the global flow parameters by capturing the three-dimensionality of small eddies, which have considerable influence on the forces. Therefore, steady flows past a chain segment have been simulated by the LES model. The effects of flow direction was studied and for the given three different directions the results are quite similar to each other. The Re-dependence of theCDof a stud-less chain is considered by simulating different flow velocities along the 0-degree direction. The predictedCDvalues decrease with the increase of the Reynolds numbers, which is consistent with the available experimental data. However,the effects of theKCnumber and the inclination angle on theCDvalues, which could be more important than that of the Reynolds number, are not included here and will be considered in the future work.
Acknowledgements
This work is part of the PhD study of the first author. The generous financial support for the PhD study from GL -Nobel Denton based in London is gratefully acknowledged.The CFD simulations are completed by using High Performance Comptuing (HPC) in Universtiy of Strathclyde,Glasgow.
Breuer M (1998). Numerical and modeling influences on large eddy simulations for the flow past a circular cylinder.International Journal of Heat and Fluid Flow, 19, 512-521.
Breuer M (1998). Large eddy simulation of the sub-critical flow past a circular cylinder: numerical and modeling aspects.Int.J. Numer. Meth. Fluids, 28, 1281-1302.
Breuer M (2000). A challenging test case for large eddy simulation: high Reynolds number circular cylinder flow.Int'l J. Heat and Fluid Flow, 21, 648-654.
Brown DT, Mavrakos S (1999). Comparative study on mooring line dynamic loading.Marine Structures, 12, 131-151.
Cantwell B, Coles D (1983). An experimental study of entrainment and transport in the turbulent near-wake of a circular cylinder.Journal of Fluid Mechanics, 136,321-374.
DNV (2010a). DNV Recommended Practice DNV-RP-C205.Environmental Conditions and Environmental Loads.
DNV (2010b). DNV Offshore Standard DNV-OS-E301.Position Mooring.
Franke J, Frank W (2002). Large eddy simulation of the flow past a circular cylinder atRe=3900.Journal of Wind Engineering and Industrial Aerodynamics, 90, 1191-1206,2002.
Hallam MG, Heaf NJ, Wootton LR (1977). Dynamics of marine structures. Report UR8, CIRIA Underwater Engineering Group, Atkins Research and Development, London.
Huse E, Matsumoto K (1988). Practical estimation of mooring line damping.Offshore Technology Conference, Houston,Texas, USA, 543–552.
Huse E, Matsumoto K (1989). Mooring line damping due to first- and second-order vessel motion.Offshore Technology Conference, OTC6137, Houston, Texas, USA.
Johanning L, Smith GH, Wolfram J (2007). Measurements of static and dynamic mooring line damping and their importance for floating WEC devices. Ocean Engineering,34, 1918-1934.
Kim SE, Mohan LS (2005). Prediction of unsteady loading on a circular cylinder in high Reynolds number flows using large eddy simulation.Proceedings of OMAE 2005, Halkidiki,Greece, 2005.
Lyons GJ, Brown DT, Lin HM (1997). Drag coefficients for mooring line hydrodynamic damping.Proceedings of the Seventh International Offshore and Polar Engineering Conference, Honolulu, USA, 1997.
Menter FR, Rumsey CL (1994). Assessment of two-equation turbulence models for transonic flows.25th AIAA Fluid Dynamics Conference, Colorado, AIAA 94–2343, 1994.
Orcina (2011). OrcaFlex User Manual. Version9.5a, Orcina Ltd,.
Ormberg H, Larsen K (1998). Coupled analysis of floater motion and mooring dynamics for a turret-moored ship.Applied Ocean Research, 20, 55-67.
Sarkar A, Taylor RE (2000). Effects of mooring line drag damping on response statistics of vessels excited by firstand second-order wave forces.Ocean Engineering, 27,667-686.
Scheme G (1983). On the force fluctuations acting on a circular cylinder in cross-flow from subcritical up to transcritical Reynolds numbers.Journal of Fluid Mechanics, 133,265-285.
Wichers J, Dercksen A (1994). Investigation into scale effects on motions and mooring forces of a turret-moored tanker.Offshore Technology Conference, Houston, Texas, USA.
Webster WC (1995). Mooring-induced damping.Ocean Engineering, 22, 571-591.
Young ME, Ooi A (2007). Comparative assessment of LES and URANS for flow over a cylinder at a Reynolds number of 3900.16th Australasian Fluid Mechanics Conference,Crown Plaza, Gold Coast, Australia, 2007.
Young WS (2007).Hydrodynamic analysis of mooring lines based on optical tracking experiments. PhD thesis, Texas A>amp;M University, 2007.
杂志排行
Journal of Marine Science and Application的其它文章
- Hard Foulers Induced Crevice Corrosion of HSLA Steel in the Coastal Waters of the Gulf of Mannar (Bay of Bengal), India
- An Approximate Method for the Surge Response of the Tension Leg Platform
- CFD Simulation of the Vertical Motion Characteristics of the Moonpool Fluid for the Truss Spar
- Dynamic Coupled Analysis of the Floating Platform Using the Asynchronous Coupling Algorithm
- Floating Production Platforms and their Applications in the Development of Oil and Gas Fields in the South China Sea
- Bucket Group Effect of the Composite Multi-bucket Structure
