Phenol Oxidation by Combined Cavitation Water Jet and Hydrogen Peroxide*
2012-02-14LUYiyu卢义玉LIUYong刘勇XIABinwei夏彬伟andZUOWeiqin左伟芹
LU Yiyu (卢义玉), LIU Yong (刘勇),3,**, XIA Binwei (夏彬伟) and ZUO Weiqin (左伟芹),3
1 State Key Laboratory of Coal Mine Disaster Dynamics and Control, Chongqing University, Chongqing 400044, China
2 State and Local Joint Engineering Laboratory of Methane Drainage in Complex Coal Gas Seam, Chongqing University, Chongqing 400044, China
3 College of Safety Science and Technology, Henan Polytechnic University, Jiaozuo 454000, China
1 INTRODUCTION
Phenol as one of the most common organic water pollutants is highly toxic even in low concentrations.Besides, phenol leads further to the generation of substituted compounds during disinfection and oxidation processes in natural water. Phenol is also relevant in the field of environmental research, because it has been chosen frequently as a model pollutant and many data are available on its removal and destruction in particular with respect to wastewater treatment [1].
Phenol exists in all industrial wastewater, such as refineries (6-500 mg·L-1), coke making operations(28-3900 mg·L-1), coal processing (9-6800 mg·L-1),and manufacture of petrochemicals (2.8-1220 mg·L-1).Phenol is also the main organic constituents exist in condensate streams of coal gasification and liquefaction. What is more, phenol exists in waste water of pharmaceutical, plastics, wood products, paint, and pulp and paper industries (0.1-1600 mg·L-1).
Phenol-containing wastewater may not be conducted into open water without treatment because of the toxicity of phenol. It also contributes to off-flavours in drinking and food processing water. Thus, lots of abatement technologies for phenol from wastewater were developed, whose primary mechanisms are separation and destruction. For the separations, Tumakaka et al. [2] have developed the solid-liquid-vapor state diagram for the water-phenol system to distillate the phenol contamination. A commercial process for phenol extraction from water using methyl-isobutylketone(MIBK) was reported recently [3]. Fierro et al. [4]recently investigated the adsorption of phenol on commercial activated carbons (ACs) and on highly microporous ACs prepared from chemical activation of Kraft lignin with sodium hydroxide (AC-Na), potassium hydroxide (AC-K) or phosphoric acid (apparent surface areas 940-2340 m2·g-1). And for the destruction, Zimmerman has first developed and applied water air oxidation (WAO) as a commercial process,which is a well-established technique of importance for wastewater treatment, especially when these are too dilute to incinerate and too toxic to biotreat [5].Bhargava and Luck [6-8] have reported catalytic wet air oxidation (CWAO) of phenol as object of many investigations in recent years and these studies have also been reviewed recently. Chedeville and Kamenev have reported oxidation with ozone and hydrogen to be active in the wet total oxidation of phenol in water solution, respectively [9, 10].
Cavitation water jet provides high pressure, high temperature, intense turbulence and liquid circulation currents when cavitation bubbles collapse [11], which play a positive role for producing high reactive free radicals. Besides, it is effectively and wildly used in wastewater treatment [12]. However, it is rare that using cavitation water jet technology to degrade phenol-containing water, through plenty of technologies developed for removal of phenol.
The paper presents laboratory experiment method and results of phenol oxidizing by combined cavitation water jet and H2O2. What’s more the intermediate and final products of degradation of phenol removal are analyzed using high performance liquid chromatograph (HPLC). Finally, based on the mechanism of reaction, dynamic models of phenol degradation have been developed.

Figure 1 Sketch of cavitation nozzle

Table 1 Lists of major instruments
2 EXPERIMENTAL
2.1 Apparatus and experimental procedure
The most important experiment instrument is cavitation nozzle (as shown in Fig. 1), which decides to cavtiation water jet quality. When water flows to outlet from inlet of cavitation nozzle at high speed,two low pressure zones would be developed. One of them is clipping zone when jets is developing, the other is eddyzone when jet is flowing to static fluid.The pressure of the two zones is lower than stable pressure of bubble, which will grow because of injecting vapor. Then the bubble will collapse when it flows to high pressure zone with jet. The bubble’s collapse can lead to enormous energy, high temperature (10000 K) and strong impact force.
High pressure pump conveys the fluid in the water tank to outlet of cavitation nozzle at high speed.The test pump flow is 10 L·min-1, so it needs about 60 min to complete six cycles when the fluid in water tank is 64L. what’s more, pressure gauges, controller panel and safety valve is necessary in the experiment.Fig. 2 is schematic representation of the experimental setup and major instruments used in the experiment are shown in Table 1.
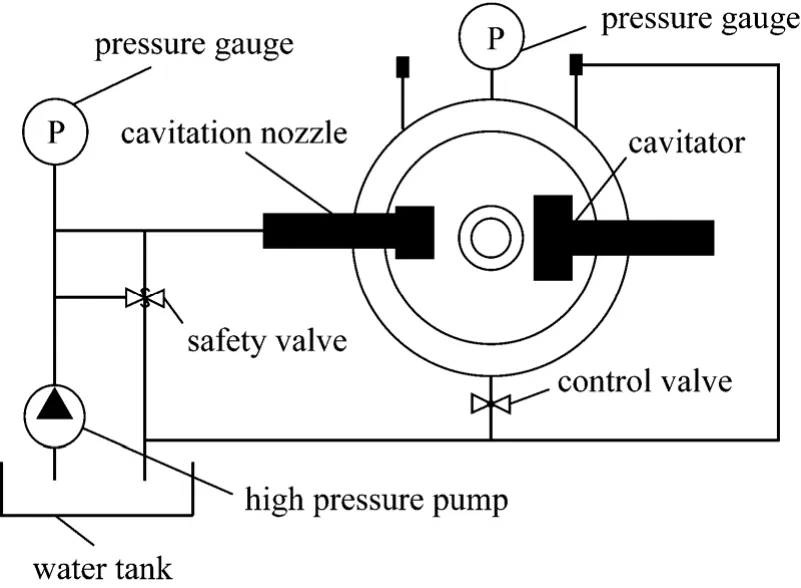
Figure 2 Schematic representation of the experimental setup
The main experiment reagent is phenol-containing wastewater, which is 64 liters laboratory-made wastewater mixed with H2O2(300 mg·L-1unless specified otherwise) for a time period of 1-1.5 h at temperature of (30±5) °C. The other experiment reagent is solution of sulphuric acid, which is diluted with sodium hydroxide in order to adjust pH. All samples are analyzed using HPLC.
When all the experiment apparatuses and reagents are prepared, injecting 64 liters phenol-containing wastewater in water tank. Then high pressure pump conveys the solution to cavitator through cavitation nozzle, which degrades partially the phenol by cavitation water jet. Then, the partially degraded solution regurgitates water tank, over and over again till 60 minutes later. During the degradation, the pressure of pump and pressure in cavitator are critical and adjustable. The velocity of water jet, which is one of key parameters of cavitation effect, depends on pump pressure, and pump pressure is adjusted willfully by safety valve between 0-30 MPa. Pressure in cavitator,named confining pressure, is adjusted by control valve between 0-20 MPa. Confining pressure is another critical parameter of cavitation effect.
2.2 Sample analysis and methods used
The intermediates and final products were analyzed by HPLC. Among the analyses, cavitation solution was diluted with methanol (1∶1) and injected into HPLC-system (Agilent 1100; ±1×10⁻⁵Au, 254 nm; relative standard deviation <0.3%) equipped with an UV-detector (270 nm) and Hypersil Octadecylsilyl C18Nautilus column (250 mm×5.0 mm; 5 μm particle size). Initially, the samples were filtered through a PE membrane with a pore size of 0.2 μm to eliminate the catalysts and particles. The cavitation sample solution is consisted of 30% water and 70% methanol. The flow rate was 0.5 ml·min-1.
3 RESULTS AND DISCUSSION
3.1 Effect of pH

Figure 3 Effect of pH value of solution on removal ratio of phenol1—pH=3; 2—pH=4; 3—pH=5; 4—pH=6
Generally, the removal rate decreases when pH increases as shown in Fig. 3. When pH is 3.0, about 95% of phenol is removed in 30 minutes. When cavitation time is 60 minutes, 100% of phenol is removed.And if pH increases to 4.0, removal rate of phenol decreases to about 90% when cavitation time is 30 minutes. Removal rate of phenol remains at about 90% even cavitation time is 60 minutes. Furthermore,only about 27.6% of phenol is removed when pH is 6.0. Thus, it can be concluded that acid greatly accelerates phenol removal. If solution is acidic, phenol molecules in the bulk-solution are oxidized rapidly by·OH when they diffuse into liquid-vapor interface of cavitation bubbles. Besides, when phenol molecules diffuse into cavitation bubbles, they could be degraded by high pressure and high temperature created by the bubble collapse. On condition that solution is neutral or alkaline, most of the phenol can not diffuse into cavitation bubbles, and then, the degradation rate is low. Besides, ·OH is hard to degraded if the solution is neutral or alkaline [13].
3.2 Effect of initial concentration of H2O2
Up to 92.3% of phenol is removed in 60 minutes when H2O2concentration is 150 mg·L-1, as shown in Fig. 4. And removal rate increases to 99.12% when H2O2concentration enhances to 300 mg·L-1. However,further increase of H2O2concentration results in decreasing of the phenol removal.

Figure 4 Relationship between H2O2 concentration and removal rate of phenol1—150 mg·L-1; 2—300 mg·L-1; 3—450 mg·L-1; 4—600 mg·L-1
Generally, the higher the H2O2concentration is,the more ·OH will be produced, which is positive for removal of phenol. However, when H2O2concentration is overmuch, there is no better effect on removal of phenol. It can be explained that excessive H2O2reacts with ·OH and generates H2O, O2and HO2· [14].Comparatively, oxidation potential of HO2· is weak and then less effect on the removal of phenol when H2O2is superfluous.
3.3 Effect of pump pressure
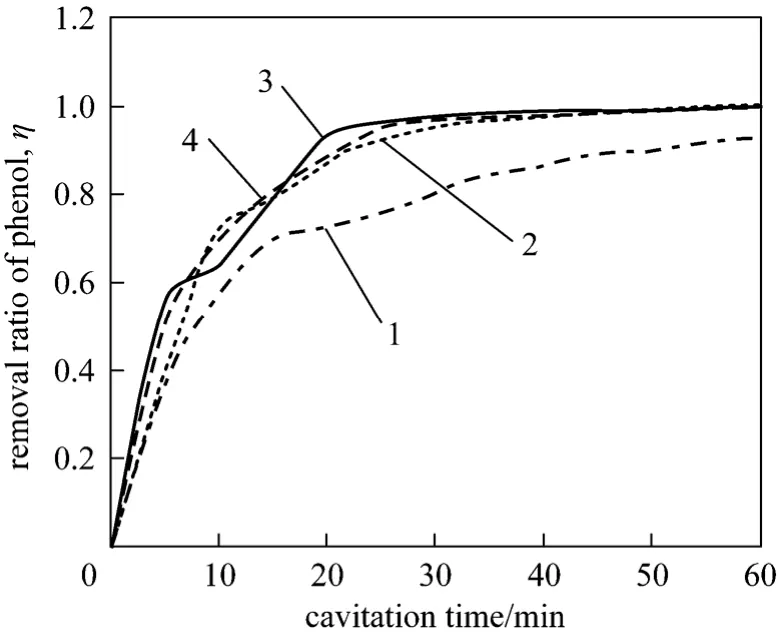
Figure 5 Relation between pump pressure and removal rate of phenol1—5 MPa; 2—10 MPa; 3—15 MPa; 4—20 MPa
As shown in Fig. 5, the removal rate of phenol increases as pump pressure when pump pressure is below 10 MPa. Once the pump pressure is higher than 10 MPa or cavitation time is more than 60 minutes,the increase of pump pressure has less or no effect on phenol removal. When pump pressures are 5 MPa and 20 MPa, the removal rate of phenol are 92.1% and 99.85% respectively. It can be explained that high pressure can promote the circulation of solution, and then more phenol containing wastewater will involve in action. However, low pump pressure cannot do it.
3.4 Effect of initial phenol concentration
Preparing four groups phenol solution whose volume are all 64 liters and initial concentration are 100 mg·L-1, 200 mg·L-1, 400 mg·L-1and 800 mg·L-1respectively. And then mixing them with H2O2, until the concentration of H2O2is 300 mg·L-1. Resetting the pH of solution with sulfuric acid to 3.0.
As shown in Fig. 6, initial phenol concentration greatly influences the removal ratio of phenol. The removal rate is 99.12% after 60 minutes of cavitation time when the initial phenol concentration is 100 mg·L-1. The removal ratio decreases to 47.68% when the initial phenol concentration rises to 800 mg·L-1.With increases of phenol concentration, the removal ratio of phenol will decrease although the total amounts of removal phenol increase.

Figure 6 Relation between initial concentration and removal rate of phenol1—100 mg·L-1; 2—200 mg·L-1; 3—400 mg·L-1; 4—500 mg·L-1
Because of phenol is volatile, phenol molecules diffuse into the cavitation bubble easily and are oxidized by the high temperature and high pressure when cavitation bubbles collapse [15]. However, when initial phenol concentration is too high, not all of the phenol molecules can enter in cavitation bubbles, thus the removal ratio of phenol decreases.
3.5 Effect of confining pressure
Figure 7 shows the relation between confining pressure and removal ratio of phenol. Removal ratio is 99% after 60 minutes of cavitation time when confining pressure is 0.5 MPa. The rate reduces to 88.7% in the same cavitation time when the confining pressure increases to 2 MPa. It can be concluded that the removal ratio decrease with the increase of confining pressure. It can be explained by when confining pressure is low, local steam pressure in cavitator will decrease sharply, and then cavitation will be stronger,which can promote the removal of phenol.

Figure 7 Relation between confining pressure and removal of phenol1—0.5 MPa; 2—1.0 MPa; 3—1.5 MPa; 4—2.0 MPa
4 ANALYSES OF DEGRADATION PRODUCTS
The test of phenol removal by combined cavitation water jet and hydrogen peroxide shows that removal rate is high. But whether or not the solution after processing can meet discharge standard of water pollutants is not sure. So detecting intermediate products and end products is necessary, then we detected by HPLC based on phenol molecular structures. Table 2 shows the chromatogram nature of relative model substance.
Figure 8 shows the chromatogram nature of sample in different times. By comparison of the specific absorption peaks with chromatogram nature of relative model substance, intermediate substances can be obtained and reaction mechanism of the cavitation degradation with H2O2can be drawn.

Table 2 Chromatogram nature of relative model substance

Figure 8 HPLC chromatograms of different reaction times
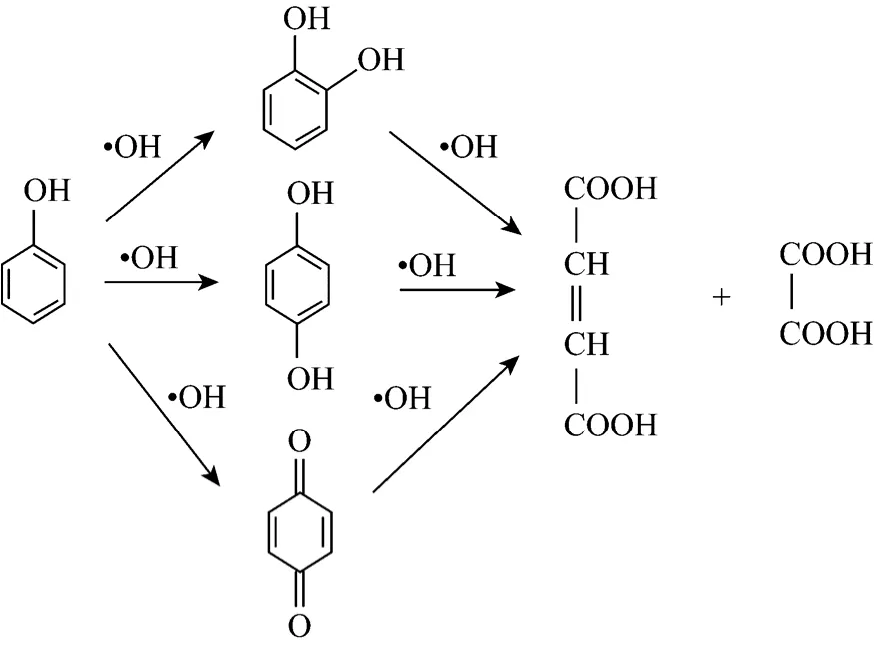
In the early stage of reaction, main products are pyrocatechol, hydroquinone and benzoquinone, which proves that hydroxyl radical is existent. In the second stage, benzene ring is further oxidized, and then maleic acid and acetic acid are produced even after 60 minutes of cavitation time. That means phenol is oxidized into aliphatic compound, and it will be more difficult for phenol to be decomposed into CO2and H2O2. Thus, hydroxyl radical is in the center of reaction and the whole reactive process is as follows.
5 DYNAMIC MODEL OF PHENOL OXIDIZED BY COMBINATION CAVITATION WATER JET WITH H2O2
5.1 Kinetic model development
The kinetic model of phenol oxidized by combined cavitation water jet with H2O2is composed of three first-order reactions. The first is phenol oxidized by cavitation water jet, then followed by H2O2, the last is phenol oxidized by combined cavitation water jets and H2O2.
(1) Phenol oxidized by cavitation water jet
Cavitation water jet can create extreme physical environment, such as high temperature and high pressure, which will react or transform organics C into C*,and finally transforms into C1.

Reaction of degradation of phenol can be expressed as:

Supposing C*is stable, then,
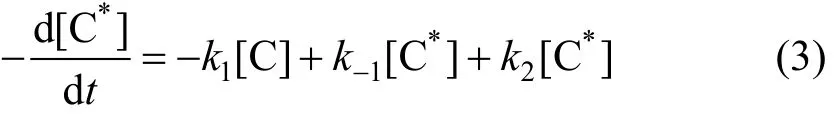
Reaction velocity of degradation phenol can be obtained by Eqs. (2) and (3) only on the condition of cavitation water jet.

(2) Phenol oxidized by H2O2
Phenol (C) can be oxidized into organics C2by H2O2

Reaction of degradation of phenol can be expressed as,
Because of [H2O2]≌[H2O2]0, the constant of apparent rate can be expressed as,

(3) Phenol oxidized by combined cavitation water jet and H2O2
Cavitation water jet reacts with H2O2to produce hydroxyl radical, which promotes phenol (C) to be transformed into C3

Reaction of degradation of phenol can be expressed as,
In this action H2O2is excess, thus there should be some side effects in this reaction system.

Supposing activated ·OH and HO2⋅ is stable, then:

Through [H2O2]>[C] in the experiment, thenk8<k5[16-19]. Thus, Eq. (13) can be expressed as,
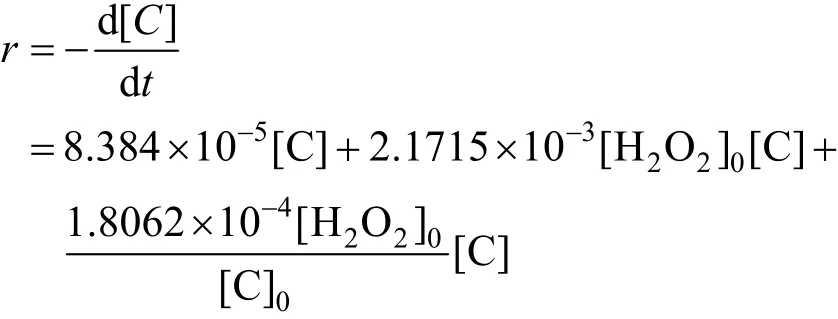
Removal speed of phenol can be expressed as,

5.2 Acquisition of kinetic parameters
If the initial concentration of the phenol remains unchanged, and initial concentration of H2O2is variable, then

When initial phenol concentration is 100 mg·L-1and initial concentration of H2O2is 50 mg·L-1, 150 mg·L-1and 300 mg·L-1, respectively. Then, we fit the dataviaEq. (17) and fitted rate constants can be developed, as shown in Fig. 9 an in Table 3.
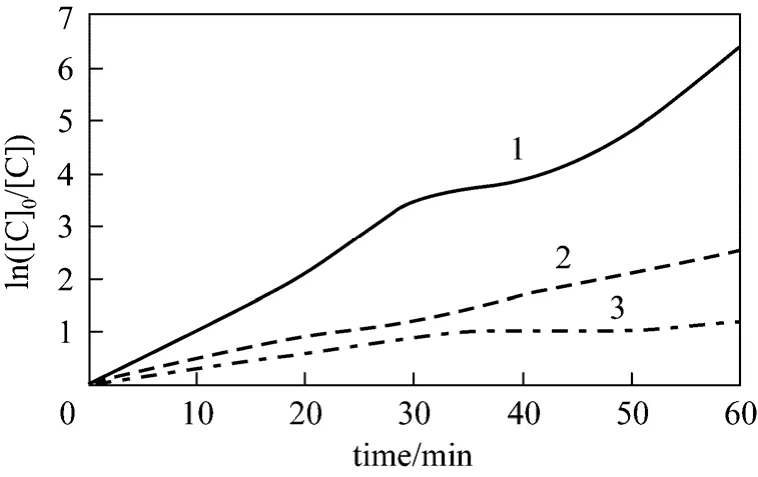
Figure 9 Kinetics rate constants when initial hydrogen peroxide concentration changed1—300 mg·L-1; 2—150 mg·L-1; 3—50 mg·L-1

Table 3 Fitted rate constants when initial hydrogen peroxide concentration changed
It can be concluded that correlation coefficient is 0.99 from Fig. 10, which means that the Eq. (19) is right in the range of investigations.

Then it is obtained thatK=8.38×10⁻⁵s-1.
As shown in Fig.10, H2O2greatly affects the removal rate of phenol. H2O2can distinctively improve the removal rate of phenol even in Small amount. It is primarily because that H2O2is transformed into hydroxyl radical, which has strong oxidability by combined with cavitation water jet. However, only small amount of phenol could be removed if cavitation water jet is used only. Generally, the more H2O2is, the more hydroxyl radical will be produced, so the effect on the removal of phenol is better. But if H2O2is excessive, H2O2has no or even adverse effects on removal of phenol. Excessive H2O2reacts with ·OH to produce H2O,O2and HO2·, and HO2· has weak oxidation potential.
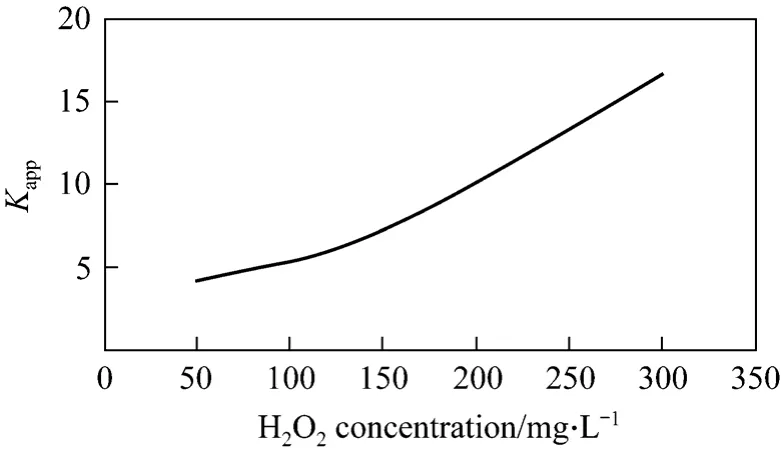
Figure 10 Relation between apparent rate constant and initial H2O2 concentration
If the initial concentration of H2O2remains unchanged, and is initial concentration of the phenol variable, then, Eq. (16) transforms into:
When initial concentration of H2O2is 300 mg·L-1and initial phenol concentration is 100 mg·L-1, 200 mg·L-1and 400 mg·L-1respectively. Then Eq. (20) can be shown as Fig. 11. Fitted rate constants are shown in Table 4.

Figure 11 Relation between apparent rate constant and initial phenol concentration1—100 mg·L-1; 2—200 mg·L-1; 3—400 mg·L-1

Table 4 Fitted rate constants when initial phenol concentration changed
It can be concluded that correlation coefficient is 0.99 from Fig. 12, which shows that Eq. (22) simulates the result well.

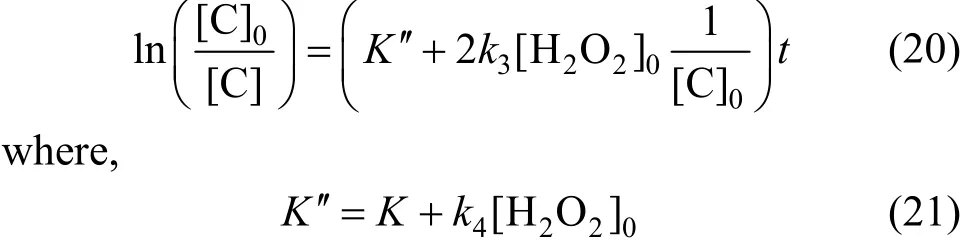
According to the analysis results,K″=1.03×10⁻⁴s-1and Eq. (23) can be obtained by solving Eq. (22)

From Fig. 12,k3[H2O2]0can be solved to be 7.9685×10⁻⁷s-1·mol·L-1, and thenk3=9.031×10⁻⁵s-1.Removal speed of phenol can be expressed as,
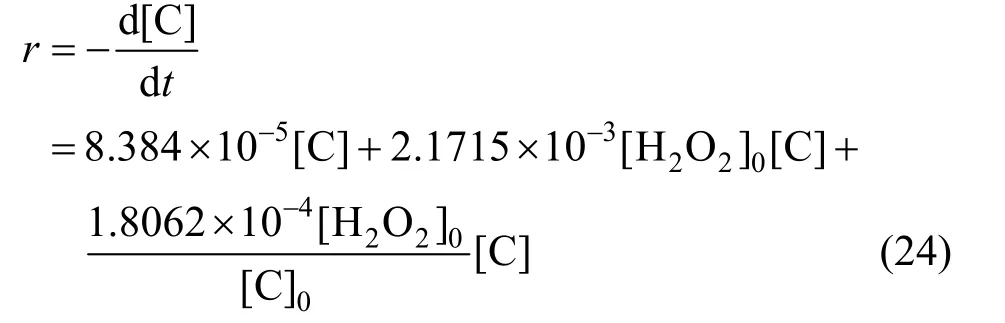
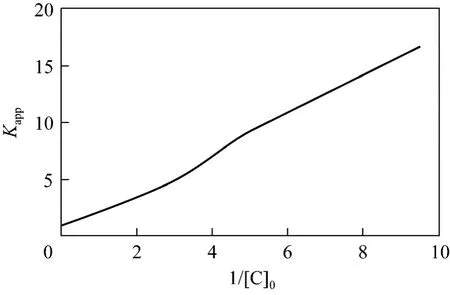
Figure 12 Relation between apparent rate constants and initial phenol concentration
6 CONCLUTIONS
The following conclusions can be drawn from the theoretical and experimental investigations on degrading phenol by combined H2O2oxidation with cavitation water jets:
(1) The technology of phenol oxidizing OR oxidization by combined cavitation water jet with H2O2is feasible, because phenol can be oxidized into organics which is easily degraded, such as quinine.
(2) When pH is 3.0, initial concentration of H2O2is 300 mg·L-1, initial phenol concentration is 100 mg·L-1, confining pressure is 0.5 MPa, cavitation time is 60 min, and pump pressure is 20 MPa, 99.85% of phenol can be mineralized, which is the best condition of removal phenol.
(3) The mechanism of reaction of H2O2oxidative degradation combined with cavitation water jets on phenol has also been confirmedviaHPLC. In the first stage, catechol, hydroquinone andp-benzoquinone are produced, which confirmed the existence of ·OH. In the second stage, maleic acid and acetic acid were produced which was the result of phenyl oxidation.
(4) There is synergetic effect between cavitation and H2O2in the technology of phenol oxidation by combination of cavitation water jet with H2O2. The promoted factor of phenol degradation rate constant is about 38.41. A simplified mechanistic model of removal of phenol is developed, which is
1 Busca, G., Berardinelli, S., Resini, C., Arrighi, L., “Technologies for the removal of phenol from fluid streams: A short review of recent developments”, J. Hazard. Mater., 160, 265-288 (2008)
2 Tumakaka, F., Prikhodko, I.V., Sadowski, G., “Modeling of solid-liquid equilibria for systems with solid-complex phase formation”, Fluid Phase Equilib., 260, 98-104 (2007).
3 QVF Engineering Gmbh, Recovery of High Boiling Solvents from Waste Water (Phenol), http://www.qvf.com/en/processsystems_3/Recovery%20Units/Phenol.shtml.
4 Fierro, V., Torne-Fernandez, V., Montane, D., Celzard, A., “Adsorption of phenol onto activated carbons having different textural and surface properties”, Micropor. Mesopor. Mater., 111, 276-284 (2008).
5 Zimmerman, F.J., “Wet air oxidation of hazardous organics in wastewater”, U.S. Pat., 2665249 (1950).
6 Bhargava, S.K., Tardio, J., Prasad, J., Fo1ger, K., Akolekar, D.B.,Grocott, S.C., “Wet oxidation and catalytic wet oxidation”, Ind. Eng.Chem. Res., 45, 1221-1258 (2006).
7 Luck, F., “Wet air oxidation: past, present and future”, Catal. Today,53, 81-91 (1999).
8 Luck, F., “A Review of industrial catalytic wet air oxidation processes”,Catal. Today, 27, 195-202 (1996).
9 Chedeville, O., Debacq, M., Ferrante Almanza, M., Porte, C., “Use of an ejector for phenol containing water treatment by ozonation”,Sep. Purif. Technol., 57, 201-208 (2007).
10 Kamenev, S., Kallas, J., Munter, R., Trapido, M., “Chemical oxidation of biologically treated phenolic effluents”, Waste Manag., 15,203-208 (1995).
11 Vonel, A., Lanterborn, W., Timm, R., “Optical and acoustic investigation of the dynamics of laser produce cavitation bubbles near a solid boundary”, J. Fluid Mechine, 208, 209-308 (1998).
12 Kalumuck, K.M., Chahine, G.L., “The use of cavitation jets to oxidze or ganic compounds in water”, Journal of Fluids Engineering,122, 465-470 (2000).
13 Zrncevic, S., Gomzi, Z., “CWPO: An environmental solution for pollutant removal from wastewater”, Ind. Eng. Chem. Res., 44,6110-6114 (2005).
14 Nanzai, B., Okitsu, K., Takenaka, N., Bandow, H., Maeda, Y.,“Sonochemical degradation of various monocyclic aromatic compounds: Relation between hydrophobicities of organic compounds and the decomposition rates”, Ultrason. Sonochem., 15, 478-483 (2008).
15 Chakinala, A.G., Bremner, D.H., Gogate, P.R., “Multivariate analysis of phenol ineralisation by combined hydrodynamic cavitation and heterogeneous advanced Fenton processing”, Applied Catalysis B:Environmental, 78, 11-18 (2008).
16 Chamarro, E., Marco, A., Esplugas, S., “Use of fenton reagent to improve organic chemical biodegradability”, Wat. Res., 35,1047-1051 (2001)
17 Pignatello, J., “Dark and photoassisted Fe3+-catalyed degradation of chlorophenoxy herbicides by hydrogen peroxide”, Environ. Sci.Technol., 26, 944-951 (1992).
18 Sawyer, D.T., Oxygen Chemistry: The International Series of Monograghs on Chemistry, Oxford University Press, New York (1991).
19 Pitter, P., “Determination of biological degradability of organic substance”, Water Res., 10, 231-235 (1976).
猜你喜欢
杂志排行

Chinese Journal of Chemical Engineering的其它文章
- HPLC Analysis of Egg Yolk Phosphatidylcholine by Evaporative Light Scattering Detector
- Removal of Organic Matter and Ammonia Nitrogen inAzodicarbonamide Wastewater by a Combination of Power Ultrasound Radiation and Hydrogen Peroxide*
- A Geometric Approach to Support Vector Regression and Its Application to Fermentation Process Fast Modeling*
- Three Dimensional Numerical Simulation of Convection-Condensation of Vapor with High Concentration Air in Tube with Inserts*
- Nanoparticle Migration in a Fully Developed Turbulent Pipe Flow Considering the Particle Coagulation*
- Regeneration of Spent Activated Carbon by Yeast and Chemical Method*