HPLC Analysis of Egg Yolk Phosphatidylcholine by Evaporative Light Scattering Detector
2012-03-22ZHOUJing周婧HUXianmei胡仙妹WANGTianxin王田心LIANGHao梁浩andYUANQipeng袁其朋
ZHOU Jing (周婧), HU Xianmei (胡仙妹), WANG Tianxin (王田心), LIANG Hao (梁浩) and YUAN Qipeng (袁其朋)*
State Key Laboratory of Chemical Resource Engineering, Beijing University of Chemical Technology, Beijing 100029, China
1 INTRODUCTION
Egg yolk is an important source of phospholipids(PLs) which are a part of cell membranes. The PLs can inhibit the crystallization of fatty acids and increase the usefulness of bioactivity components in vivo [1].The main PL in egg yolk phospholipids is phosphatidylcholine (PC) (80.5%) [2]. Other than phosphatidylethanolamine (PE) and other phospholipids, phosphatidylcholine has gained the interest of many researchers because of its pharmaceutical usefulness [3].Natural high-purity egg yolk phosphatidylcholine(EYPC) are being widely used as emulsifier or liposome in pharmaceutical and cosmetic industrial production. In addition, choline, which is involved in several biological processes, can be ingested in the form of PC rather than as free base [4], which makes PC more important than other forms of phospholipids. It was reported that dietary EYPC could significantly decrease cholesterol absorption in rats compared with soybean PC [5]. Moreover, EYPC contains relatively more saturated fatty acid than soybean lecithin does,and it may have better oxidative stability than soybean lecithin as a result [6].
Due to the importance of EYPC, the detection method is considered to be particularly important. In recent years, high performance liquid chromatography(HPLC) methods have been widely used for analyzing PLs. Common determination methods of phospholipids are based on the American Oil Chemists’ Society (AOCS)Official Method Ja7b-91 using n-hexane/2-propanol/acetate buffer as the mobile phase with a silica gel column and ultraviolet (UV) detector [7]. Other improved methods include a normal-phase column and reverse-phase solvent method with UV detection, and a binary gradient normal-phase method with evaporative light scattering detector (ELSD) detector [8].However, almost all these detection methods used before were based on the following two solvent systems:hexane/2-propanol/water and acetonitrile/water (sometimes methanol was added). To improve the peak shape and enhance the separation efficiency, the buffer salt solution or water in their mobile phase should be used in many reported methods. Nevertheless, that will significantly affect the silica gel column both on its lifespan and the separation efficiency.
It was reported that PC has weak UV absorption in the 206 nm only due to the unsaturated groups and functional groups [9]. Peak and baseline disturbances are often characteristic for this type of UV absorption[10]. ELSD affords an advantage over the UV detector and refractive index, since it is not sensitive to the flow-rate and quantifies any solute less volatile than the solvent [11]. It is compatible with a broad range of solvents and gradient elution, and the signal is independent of the degree of saturation and chain-length [12].
In fact, phosphatidylcholine is much more desirable in actual producing process, especially when using egg yolk as material. EYPC demand has been increasing in the fields of the nutrient, cosmetic and pharmacy industries because of its valuable character[13]. Although there are many studies about the purification methods of EYPC even including the use of supercritical fluid extraction to expand the production scale [14], the detection methods of EYPC are still remained as the traditional ones, which apply a mobile phase using buffer salt solution or complex gradient elution, leading to reducing the lifespan of silica gel column. Considering the importance of EYPC and practicability, the purpose of this study is to develop a set of determination method for the EYPC particularly when there is no need to calculate other phospholipids.
2 EXPERIMENTAL
2.1 Chemicals
The solventsn-hexane, 2-propanol and methanol are HPLC grade and purchased from Dikma Technology Inc. (NY, USA). Standard EYPC (1, 2-diacyl-snglycero-3-phosphocholine from egg yolk, TLC purity>99%) were purchased from Sigma-Aldrich (USA).Crude egg yolk phospholipids were made in the laboratory (purity greater than 60%).
2.2 HPLC system
The HPLC was used on a Shimadzu LC-20AVP system with two LC-20AT solvent delivery units, an SPD-20A UV/vis detector and a Sedex LT-ELSD Model 75 low temperature-evaporative light scattering detector (Sedere, Alfortville, France), a CTO-10ASVP column oven (Shimadzu, Kyoto, Japan) and a T2000P workstation (Beijing, China). HPLC separation was achieved using a normal-phase silica gel column (250 mm×4.6 mm, 5 μm, Inertsil GLTM).
2.3 Sample preparation
There are two samples used in this study for analysis: a standard EYPC solution and a crude egg yolk phospholipids solution. The standard EYPC solution was made by 10.15 mg standard EYPC dissolved in 10ml HPLC-grade methanol. The extraction of crude egg yolk phospholipids from egg yolk powder(kindly provided by Hanwei-Group, Dalian, China)was carried out according to the traditional method[15]. The optimized extraction process was as follows:5 g egg yolk powder was added to 70ml acetone and stirred for 30min at ambient temperature. The precipitation obtained by filtration from the previous step was extracted by 100ml 95% ethanol and stirred for 60 min in 50 °C water bath. Then the organic phase was separated and evaporated. Dried the product, 0.89 g crude EYPC was obtained (purity greater than 60%).This crude EYPC was stored at -20 °C until analysis.Two groups of crude EYPC were weighed about 10 mg and dissolved in 5 ml HPLC-grade hexane/2-propanol(1∶1) using hexane/2-propanol as mobile phase and in 5 ml HPLC-grade methanol using methanol/acetonitrile as mobile phase, respectively. The solution passed through a 0.45 μm filter and was collected in a centrifuge tube before analysis.
2.4 Selection of mobile phase and detector
According to the literature, the mobile phases used are the normal-phase solvent (n-hexane/2-propanol/buffer salt solution) and reverse-phase solvent (methanol/acetonitrile/water). In this study, we try to avoid using water or buffering salt solution to protect silica gel column. Because ELSD needs to evaporate the solvent,those buffer salt solutions, which cannot volatilize easily, should never exist in the HPLC-ELSD system.To achieve the best effect the mobile phases were used in different ratio solvents ofn-hexane/2-propanol or methanol/acetonitrile. After the PC peak can be separated well, UV detector and ELSD were tested and comparedto improve the PC peak type, respectively.
2.5 HPLC method validation and construction of standard curve
To ensure the validity and reliability of our developed method, the following parameters were evaluated for the validation: accuracy, repeatability,stability and recovery.
2.5.1Accuracy
The instrument accuracy of the method was evaluated by performing six replicate injections of an EYPC standard solution (10 μl each time). It can be considered acceptable only when the peak area relative standard deviation (RSD) was less than 2% .
2.5.2Repeatability
The sample repeatability of the method was evaluated by performing six replicate injections of a crude EYPC solution (10 μl each time). The peak area RSD less than 2% will prove that the method repeatability is sufficient enough.
2.5.3Stability
The stability of sample solutions was examined as well. The sample solutions were prepared in mobile phase and were stored in a refrigerator (4 °C) because the solvent volatilizing will cause inaccurate results.The sample solutions were injected 10 μl every two hours. Peak area RSD less than 2% indicates that these samples are stable in 12 h.
2.5.4Recovery
The accuracy of the method recovery was determined by the analysis of standard EYPC solution spiked with the crude EPYC solution at an equal concentration. Six replicates were analyzed and the peak areas were compared with the theoretical value. All the six recoveries should be between 95% and 105%,and RSD should be less than 2%.
2.5.5Construction of standard curves for EYPC
Standard solutions were prepared in methanol and stored in the dark at 4 °C until required. The concentration of the EYPC standard solution is 1.015 mg·ml-1. The standard solution was prepared at six volumes for HPLC-ELSD determination: 5 μl/7.5 μl/10 μl/12.5 μl/15 μl/17.5 μl.
3 RESULTS AND DISCUSSION
3.1 PL separation on different mobile phase composition
1, 2-Diacyl-sn-glycero-3-phosphocholine from egg yolk, commonly known as egg yolk phosphatidylcholine (EYPC), was analyzed on a normal-phase silica gel column using different mobile phases. By scanning the UV spectra of the standard EYPC, the strong absorption can be obtained at 206 nm (Fig. 1).This was finally chosen as the detection wavelength because it shows the best signal-to-noise response.

Table 1 Retention time and resolution for EYPC separation on silica gel column with a flow rate of 1.0 ml·min-1 and a temperature of 30 °C. Analysis performed on Inertsil column with UV detection at 206 nm
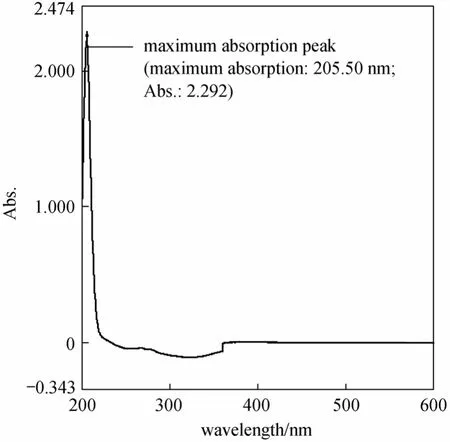
Figure 1 UV spectra absorption of the standard EYPC
According to literatures [16-23], hexane/2-propanol or methanol/acetonitrile in different proportions and buffer solution was used as the mobile phase. The normal phase silica gel column have not bond any base groups, thus water or buffer will cause the decrease of the column efficiency and lifespan. In order to increase column lifespan and make an effective detection of EYPC, the mobile phase with water will not be used in this research. The chromatographic data are shown in Table 1.
According to all the chromatograms, EYPC cannot be separated completely with other purities by only using hexane/2-propanol as mobile phase. The better separated single peak appeared when using 86%hexane/14% 2-propanol as mobile phase. Based on the above, we changed the flow rate and temperature for expecting a single peak, but the result was undesirable.
EYPC peak can be well separated using methanol/acetonitrile with no water as mobile phase. Retention time of the EYPC peak decreased when the content of acetonitrile increased from 0% to 15%. When acetonitrile was more than 15%, the retention time increased on the contrary and splitting EYPC peak appeared.The EYPC could not be eluted if the content of acetonitrile was more than 60%. Figs. 2-5 show the chromatograms of the standard EYPC solution and the sample EYPC solution which used UV detector (mobile phase: methanol; 90% methanol/10% acetonitrile).
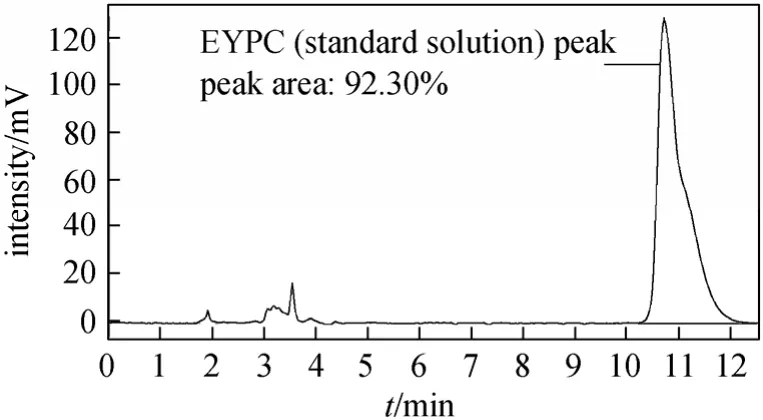
Figure 2 Chromatogram of the standard EYPC solution(Mobile phase, methanol; flow rate, 1.0 ml·min-1; column temperature, 30 °C; sample injection, 10 μl; detection, UV at 206 nm)
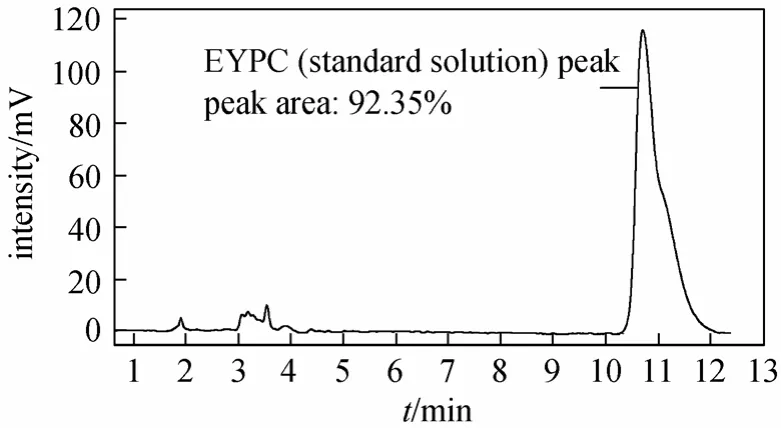
Figure 3 Chromatogram of the standard EYPC solution[Mobile phase, methanol/acetonitrile 90∶10 (volume ratio);flow rate, 1.0 ml·min-1; column temperature, 30 °C; sample injection, 10 μl; detection, UV at 206 nm]

Figure 4 Chromatogram of the sample EYPC solution(Mobile phase, methanol; flow rate, 1.0 ml·min-1; column temperature, 30 °C; sample injection, 10 μl; Detection, UV at 206 nm)
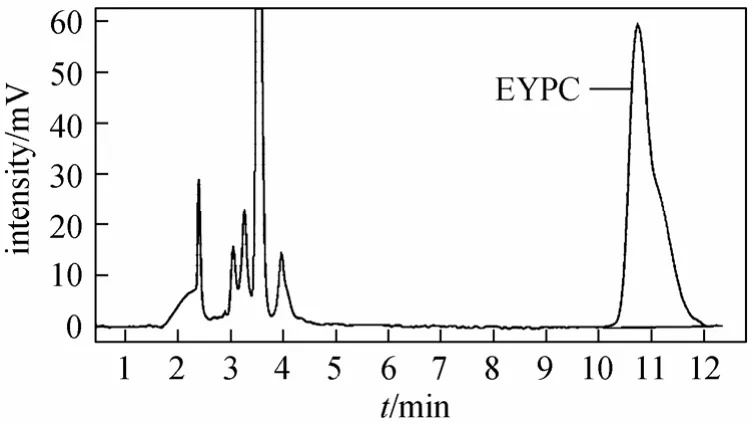
Figure 5 Chromatogram of the sample EYPC solution[Mobile phase, methanol/acetonitrile 90∶10 (volume ratio);flow rate, 1.0 ml·min-1; column temperature, 30 °C; sample injection, 10 μl; detection, UV at 206 nm]
As the chromatograms show, the drawback of methanol/acetonitrile as the mobile phase is that the shape of the EYPC peak is not a perfect single-peak but a little tailing. The EYPC peak cannot form a perfect single-peak because EYPC has very complex fatty acid residues. According to Sigma’s product information, typical egg yolk phosphatidylcholine have fatty acid contents of approximately 33% 16∶0(palmitic), 13% 18∶0 (stearic), 31% 18∶1 (oleic),and 15% 18:2 (linoleic) with other fatty acids as minor contributors, which would give an average molecular mass of approximately 768. Phospholipids lack characteristic absorption. The strong absorption in the 200-214 nm is owing to carbon-carbon double bond,carbonyl, phosphate groups and amino functional groups. As carbon-carbon double bond in the fatty acid residues is also a reason for UV absorption, different fatty acid residues in EYPC are the most likely cause of this kind of peak.
3.2 Effects of the detector
Lipid analysts were initially slow to come to terms with the potential of high-performance liquid chromatography (HPLC), mainly because of the non-availability of a sensitive universal detector. As a kind of lipid, phospholipids also faced the same problem. This situation was changed in mid-1980s when the basic technology of modern-day ELSDs was established. Using an ELSD by a single run using gradient elution is an easy and rapid method for quantitative analytical procedures [24]. The principle of evaporative light scattering detectors (ELSDs), which solves these problems, is extremely simple. The target substances separated in a column are, together with the mobile phase, converted to a fine spray by a nebulizer, and this spray is carried to a drift tube. In the drift tube,heat is applied so only the mobile phase is evaporated.The remaining target substances in the mobile phase are converted to minute solid particles and are carried to the detection unit. In the detection unit, the target substance particles cause the light emitted from a light source to be scattered. This scattered light is measured by a photomultiplier and the target substances are thereby detected. That makes ELSDs capable of analyzing all substances which have an evaporation temperature lower than that of the mobile phase in principle.
According to the principle of ELSD, the intensity of the signal detected can be represented by the following equation: (signal intensity)=A×(quantity of target substance)b. “A” and “b” here are constants that are determined by a variety of factors, such as the size of the particles, the concentration and type of the target substances, the gas flow rate, the mobile phase flow rate, and the temperature of the drift tube. The response signal of ELSD is only dependent on particle size, shape and quantity but independent of the functional groups and optical properties of the tested components. ELSDs are well-suited to the detection of components such as sugars, fats, surfactants, synthetic macromolecules and steroids. Because these components have low light absorbance, it is difficult for them to be detected with UV detectors.
The set temperature of the drift tube is one of the most important things that need to be carefully considered when performing high-sensitivity analysis with an ELSD. If the temperature is too high, semi-volatile substances may be partially or completely evaporated together with the mobile phase and the quantity of minute solid particles so that scatter light may decrease. This may lead to a reduction in detection sensitivity or make detection completely impossible. The low temperature ELSD (LT-ELSD) technology allows evaporating high boiling mobile phases at very low temperatures and makes high sensitivity analysis possible for nearly all compounds.
Based on the above facts and arguments, LT-ELSD was used instead of UV detector to improve peak shape. Figs. 6 and 7 show the standard EYPC chromatograms used LT-ELSD as detector (mobile phase:methanol; 90% methanol/10% acetonitrile). Figs. 8 and 9 show the sample EYPC chromatograms which used LT-ELSD as detector (mobile phase: methanol;90% methanol/10% acetonitrile).
According to the chromatograms above, it can be seen that using ELSD instead of UV detector can solve problems like asymmetric peak caused by phospholipids lack of characteristic UV absorption.Figs. 6 and 7 show great single peaks of standard EYPC, and Figs. 8 and 9 indicate great single peaks of EYPC in the sample solution. The only minor flaw in some of these chromatograms is that there are‘glitches’ on the crest of EYPC peak. This phenomenon

Figure 6 Chromatogram of the standard EYPC solution(Mobile phase, methanol; flow rate, 1.0 ml·min-1; column temperature, 30 °C; sample injection, 5 μl; detection, LT-ELSD;ELSD temperature, 40 °C; ELSD pressure, 0.35 MPa)
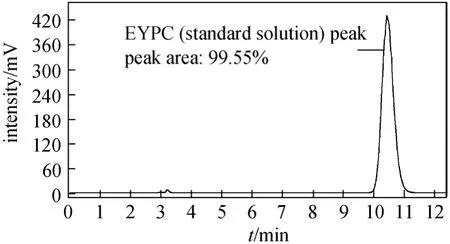
Figure 7 Chromatogram of the standard EYPC solution[Mobile phase, methanol/acetonitrile 90∶10 (volume ratio);flow rate, 1.0 ml·min-1; column temperature, 30 °C; sample injection, 5 μl; detection, LT-ELSD; ELSD temperature, 40 °C;ELSD pressure, 0.35 MPa]
Figure 8 Chromatogram of the sample EYPC solution(Mobile phase, methanol; flow rate, 1.0 ml·min-1; column temperature, 30 °C; sample injection, 10 μl; detection, LT-ELSD;ELSD temperature, 40 °C; ELSD pressure, 0.35 MPa)is due to the complex fatty acid residues of EYPC.

Figure 9 Chromatogram of the sample EYPC solution[Mobile phase, methanol/acetonitrile 90∶10 (volume ratio);flow rate, 1.0 ml·min-1; column temperature, 30 °C; sample injection, 10 μl; detection, LT-ELSD; ELSD temperature, 40 °C;ELSD pressure, 0.35 MPa]
Since the backup channel was used during HPLC-ELSD period, computer cannot record the signals automatically in which case we have to manually start the recording software and that makes the retention time had a certain deviation. Even with a certain deviation, there is little difference of retention time when using two different mobile phases and no difference in essence can be seen from these chromatograms.To simplify the mobile phase, consideration of using pure methanol as mobile phase is more appropriate.
3.3 Validation of the method conditions and standard curve
From the discussion above it is known that EYPC can be well separated when using a normal-phase silica gel column and methanol as the mobile phase. Although the chromatogram obtained using UV detector is not as ideal as using ELSD, both HPLC-UV and HPLC-ELSD can be used to detect the content of EYPC in crude phospholipids if the final results of method validation are positive.
3.3.1Accuracy
Two EYPC standard solutions (UV, 2.052 g EYPC/L; ELSD, 2.098 g EYPC/L) were used in the accuracy test respectively. Table 2 shows peak areas of six replicate injections of the EYPC standard solution and peak area relative standard deviation (RSD) in two precision tests (HPLC-UV and HPLC-ELSD).HPLC conditions were as follows: mobile phase,methanol; flow rate, 1.0 ml·min-1; column temperature, 30 °C; sample injection, 10 μl. UV detector and ELSD were used, respectively. Detection conditions:LT-ELSD, ELSD temperature 40 °C, ELSD pressure 0.35 MPa; UV detector, UV at 206 nm; the unit of peak area in this paper is arbitrary units (AU).

Table 2 Peak areas and their RSDs of precision test(HPLC-UV and HPLC-ELSD)
As shown in Table 2, RSD. of HPLC-UV is larger than but as acceptable as RSD of HPLC-ELSD. In fact, even concentrations of two EYPC standard solutions were similar; ELSD peak area is an order of magnitude higher than that of UV. This is most likely because EYPC is less sensitive when using UV detector.Thus, HPLC-ELSD is superior to HPLC-UV because of its smaller RSD and the smaller fluctuation range.
3.3.2Repeatability
Two crude sample solutions (UV, 2.7g crude phospholipids/L; ELSD, 2.422g crude phospholipids/L)were used in the repeatability test, respectively. Table 3 shows EYPC peak areas of six replicate sample injections and RSD in repeatability tests (HPLC-UV and HPLC-ELSD). HPLC conditions were the same as above.
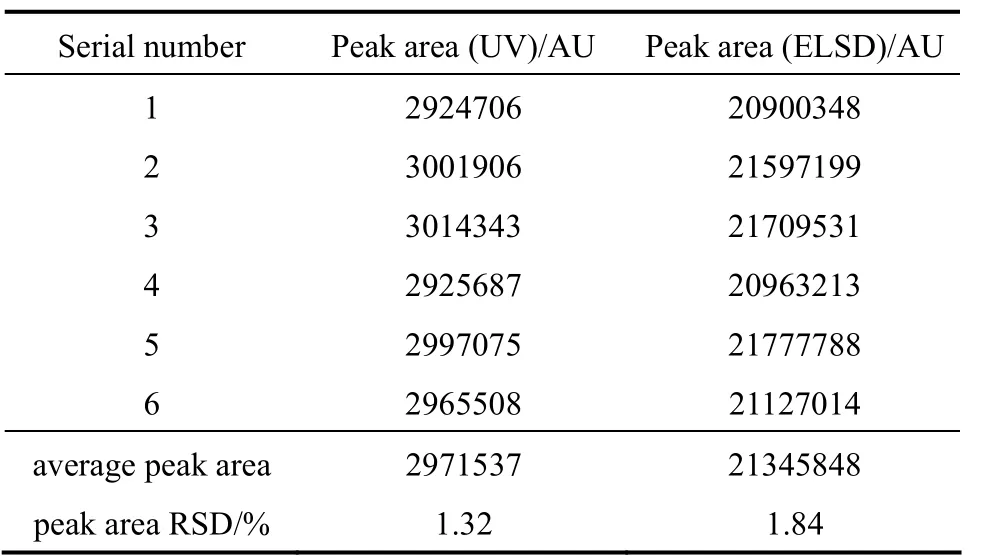
Table 3 Peak areas and their relative standard deviation of repeatability test (HPLC-UV and HPLC-ELSD)
As it can be seen in Table 3, both RSD of HPLC-UV and HPLC-ELSD of sample solutions are less than 2%,which means sample repeatability of these two methods are good enough.
3.3.3Stability
Two EYPC sample solutions were used in the stability test. They were determined every 2 hours within 12 hours, and were stored in a refrigerator (4 °C)in spare time to avoid solvent volatilizing. Table 4 shows the results of stability tests (HPLC-UV and HPLC-ELSD). HPLC conditions were the same as above.
As it can be seen in Table 4, RSD are less than 2% in 12 hours which means that these samples were stable in 12 hours (4 °C).
3.3.4Recovery
A standard EYPC solution and a crude EPYCsample solution were mixed together at an equal concentration to examine the accuracy of recovery. EYPC peak areas of standard and sample solutions were determined. The recoveries were determined by the following formula: recovery=(observed amount-original amount)/spiked amount×100%. Table 5 shows the results of recovery tests (HPLC-UV and HPLC-ELSD).HPLC conditions were the same as above.
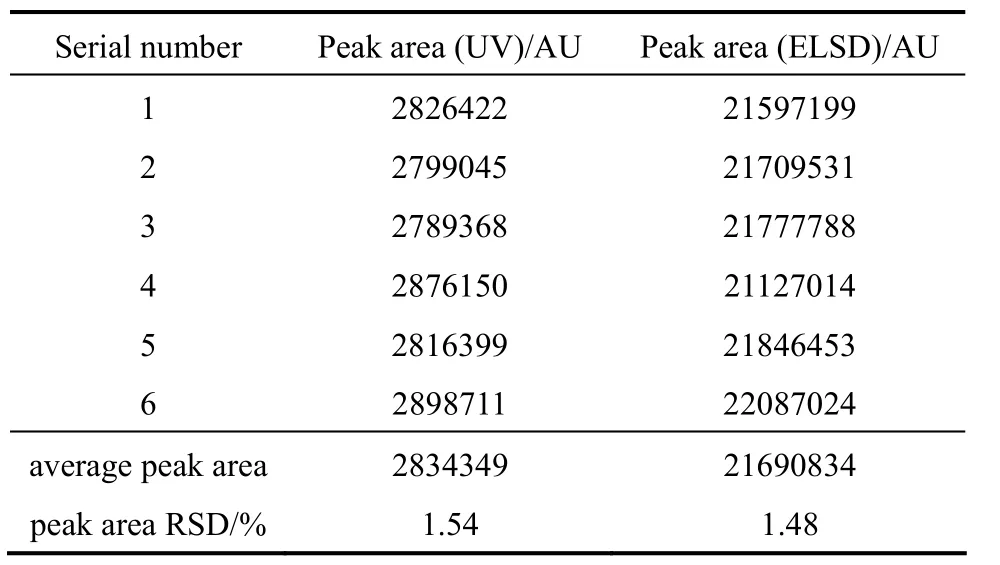
Table 4 Peak areas and their relative standard deviation of stability test (HPLC-UV and HPLC-ELSD)
As it can be seen in Table 5, all those recoveries are between 95% and 105%, and RSDs are less than 2%,indicating good accuracy of recovery of HPLC-UV and HPLC-ELSD methods.
3.3.5Standard curves for EYPC
From the discussion above, HPLC-ELSD is considered superior to HPLC-UV overall because of the better peak shape and its almost perfect precision and accuracy. Therefore, we determined to use HPLC-ELSD to analyze EYPC and draw a standard curve for future research. Although some authors have established that the ELSD response is linear for a broad range of concentrations, more other authors have reported that the response of the mass detector to increase amounts of solute injected is non-linear [16]. Although the ELSD response varies with the scattering domain in most cases, it is assumed that the measured peak area (A) can be related to the analyzed mass (M) by the logarithmic relation:aiandbiare coefficients depending on droplet size and nature of solute, gas pressure, evaporation temperature,flow rate, and so on.

Table 5 Peak areas and their relative standard deviation of recovery test (HPLC-UV and HPLC-ELSD)
The standard calibration curves were established using six volume levels of EYPC standard solution(from 5 to 17.5 μl). Value of each area was the average of three reproducible injections. These curves allow the determination of the parameters for EYPC and the standard calibration curve should be obtained under the conditions of lgA=α× l gM+β.
The final standard curves were shown in Figs. 10 and 11. Fig. 10 is the normal peak area-mass curve,while Fig. 11 shows the peak area related to mass by the logarithmic relation.
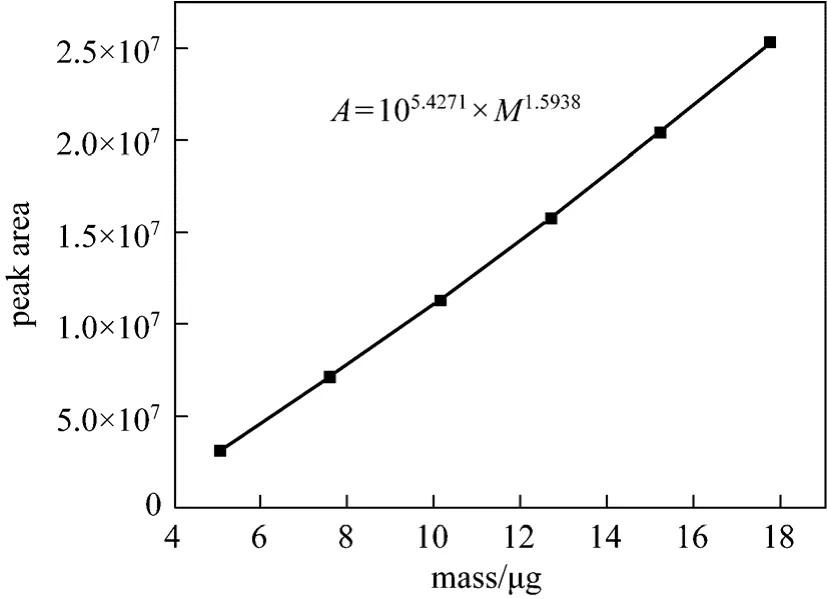
Figure 10 Peak area-mass standard curve of EYPC (HPLCELSD)
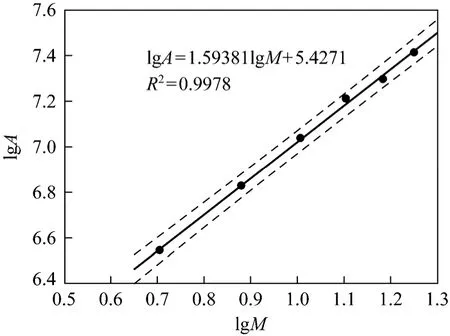
Figure 11 Peak area-mass standard curve of EYPC (HPLCELSD) under the logarithmic relation. Black line is the standard calibration curve; dot lines give a prediction interval when confidence degree is 95%
The final results are that peak area-mass standard curve of EYPC (HPLC-ELSD) under the logarithmic relation is lgA2=1.5938lgM+ 5 .4271 and correlation coefficient (R) is 0.9978. As it mentioned above, the HPLC-ELSD method proposed is sensitive and precise. Its simplicity, absence of baseline drift and short analysis time make it suitable for determination of EYPC purity in crude phospholipids.
4 CONCLUSIONS
HPLC-ELSD is undoubtedly an important element of the techniques which are being rapidly used and developed in phospholipids analysis. In this study,a simplified process was used which avoided using water within the mobile phase to analyze EYPC. The HPLC operating condition is using pure methanol as mobile phase, a silica gel column and a low temperature evaporative light scattering detector. The overall results of this work confirm that this HPLC-ELSD method yields a simple, sensitive, stable, and silica column-friendly quantification of EYPC in crude phospholipids.ACKNOWLEDGEMENTS
Our team would like to give special thanks to our colleagues of State Key Laboratory of Chemical Resource Engineering, Hao Liang, Yi Fan for their supports and contributions to this project. We would also like to express our gratitude to Han Wei Group for their donation of egg yolk powder that used in our research.
1 Shen, X.J., Lai, B.S., “Development and utilization of yolk phospholipid”,Chinese Journal of Pharmaceuticals, 25 (5), 231-233(1994).
2 Chi, Y.J., Lin, S.Y., “Research advance in the extraction and application of egg yolk lecithin”,Food and Fermentation Industries, 28 (5),50-53 (2002).
3 Hradec, J., Dufek, P., “Isolation and quantitation of phosphatidylcholine by reversed-phase liquid-liquid extraction”,J.Chromatogr.B, 703 (1-2), 259-262 (1997).
4 Cheng, W.L., Holmes-McNary, M.Q., Mar, M.H., Lien, E.L., Zeisel,S.H., “Bioavailability of choline and choline esters from milk in rat pups”,TheJournal of Nutritional Biochemistry, 7 (8), 457-464(1996).
5 Jiang, Y.Z., Noh, S.K., Koo, S.I., “Egg phosphatidylcholine decreases the lymphatic absorption of cholesterol in rats”,Journal of Nutrition, 131 (9), 2358-2363 (2001).
6 Palacios, L.E., Wang, T., “Egg yolk lipid fractionation and lecithin characterization”,Journal of the American Oil Chemists’ Society, 82(8), 571-578 (2005).
7 Carelli, A.A., Brevedan, M.I.V., Crapiste, G.H., “Quantitative determination of phospholipids in sunflower oil”,Journal of the American Oil Chemists’ Society, 74 (5), 511-514 (1997).
8 Balazs, P.E., Schimit, P.L., Szuhaj, B.F., “High performance liquid chromatographic separations of soy phospholipids”,Journal of the American Oil Chemists’ Society, 73 (2), 193-197 (1996).
9 Hax, W.M., van Kessel, W.S., “High-performance liquid chromatographic separation and photometric detection of phospholipids”,J.Chromatogr.A, 142 (11), 735-741 (1977).
10 Szücs, R., Verleysen, K., Duchateau, G.S., Sandra, P., Vandeginste,B.G.M., “Analysis of phospholipids in lecithins comparison between micellar electrokinetic chromatography and high-performance liquid chromatography”,J.Chromatogr.A, 738 (1), 25-29 (1996).
11 Sala Vila, A., Castellote-Bargalló, A.I., Rodríguez-Palmero-Seuma,M., López-Sabater, M.C., “High-performance liquid chromatography with evaporative light-scattering detection for the determination of phospholipid classes in human milk, infant formulas and phospholipid sources of long-chain polyunsaturated fatty acids”,J.Chromatogr.A, 1008 (1), 73-80 (2003).
12 Rombaut, R., Dewettinck, K., Camp, J.V., “Phospho-and sphingolipid content of selected dairy products as determined by HPLC coupled to an evaporative light scattering detector”,Journal of Food Composition and Analysis, 20 (3-4), 308-312 (2007).
13 Yoon, T.H., Kim, I.H., “Phosphatidylcholine isolation from egg yolk phospholipids by high-performance liquid chromatography”,J.Chromatogr.A, 949 (1-2), 209-216 (2002).
14 Teberikler, L., Koseoglu, S., Akgerman, A., “Selective extraction of phosphatidylcholine from lecithin by supercritical carbon dioxide/ethanol mixture”,Journal of the American Oil Chemists’ Society,78 (2), 115-119 (2001).
15 Huang, J.Z., Lin, S.Y., Gong, X.T., Li, D., Liu, J.B., “Study on optimization of extraction technology of egg yolk lecithin by uniform design method”,Chinese Journal of Food Science, 29 (10), 257-259(2008).
16 Patil Vilas, V., Galge Revanappa, V., Thorat Bhaskar, N., “Extraction and purification of phosphatidylcholine from soyabean lecithin”,Sep.Purif.Technol., 75 (2), 138-144 (2010).
17 Rombaut, R., Camp, J.V., Dewettinck, K., “Analysis of phosphoand sphingolipids in dairy products by a new HPLC method”,Journal of Dairy Science, 88 (2), 482-488 (2005).
18 Li, G.C., Wang, Y.H., Wu, R.A., WANG, S.C., “Analysis of phospholipids in egg yolk by offline HPLC-MALDI-TOF-MS”,Chinese Journal of Analysis Laboratory, 28 (4), 30-33 (2009).
19 Zhang, Y.Y., Yang, Y.W., Wu, C.J., Ren, Q.L., “Progress of phospholipids determination”,Chinese Journal of Pharmaceuticals, 37(1), 58-60 (2006).
20 Helmerich, G., Koehler, P., “Comparison of methods for the quantitative determination of phospholipids in lecithin and flour improvers”,Journal of Agricultural Food Chemistry, 51 (23), 6645-6651(2003).
21 Wang, Y., Wang, X.G., Hu, X.Y., “Methods for determination and analysis of phospholipids composition and content”,China Oils and Fats, 27 (4), 64-67 (2002).
22 Zhang, W.N., He, H.B., Feng, Y.Q., “Separation of phosphatidylcholine and phosphatidylethanolamine by using high performance displacement chromatography”,J.Chromatogr.A, 1036 (2), 145-154(2004).
23 Grizard, G., Sion, B., Bauchart, D., “Separation and quantification of cholesterol and major phospholipid classes in human semen by high-performance liquid chromatography and light-scattering detection”,J.Chromatogr.B, 740 (6), 101-107 (2000).
24 Zhu, J.L., Tang, Y.F., Li, J.H., “Analysis of sucrose esters with long acyl chain by coupling of HPLC-ELSD with ESI-MS system”,Chin.J.Chem.Eng., 17 (6), 1032-1037 (2009).
杂志排行

Chinese Journal of Chemical Engineering的其它文章
- Removal of Organic Matter and Ammonia Nitrogen inAzodicarbonamide Wastewater by a Combination of Power Ultrasound Radiation and Hydrogen Peroxide*
- A Geometric Approach to Support Vector Regression and Its Application to Fermentation Process Fast Modeling*
- Three Dimensional Numerical Simulation of Convection-Condensation of Vapor with High Concentration Air in Tube with Inserts*
- Nanoparticle Migration in a Fully Developed Turbulent Pipe Flow Considering the Particle Coagulation*
- Regeneration of Spent Activated Carbon by Yeast and Chemical Method*
- Optimization of Parameters for Melt Crystallization of p-Cresol*