Techno-economic Analysis of Distributed Hydrogen Production from Natural Gas
2012-02-14LUKHoTingLEIHoManNGWaiYeeJUYihanandLAMKoonFung
LUK Ho Ting, LEI Ho Man, NG Wai Yee, JU Yihan and LAM Koon Fung*
Department of Chemical and Biomolecular Engineering, the Hong Kong University of Science and Technology,Hong Kong, China
1 INTRODUCTION
Nowadays, there are about 1 billion vehicles [1]with energy supplied by our limiting energy source,petroleum, worldwide with an annual growth rate of 3.4% [2]. The depletion of crude oil and petroleum in 50 years [3] has raised public attention on the predicted energy crisis and an increase in gasoline price to$944.25 m-3at a rate of $0.81 per year and diesel price at $1027.7 m-3with an annual increase of $0.932 per year is observed [4]. Data has also shown that CO2emission from fossil fuels are 2358.6 kg·m-3gasoline and 2687.6 kg·m-3diesel [5] which leads to a significant concern on the environmental impact of the combustion process in car engines. A clean, economical and high energy efficient fuel for vehicles is urgently needed for sustainable development. In addition, hydrogen fuel cell is proposed as the most efficient energy supplier for vehicles with virtually no CO2emission when comparing with the traditional internal combustion engine (ICE). Recent development of fuel cells has also made hydrogen economy a promising potential energy system [6-9].
Hydrogen can be produced from fossil fuels including natural gas, coal and renewable energy sources such as biomass, solar energy and wind energy [10, 11]. In terms of hydrogen production capacity and economic competitiveness, natural gas has been considered as the best source of short-term hydrogen production when comparing with coal and all renewable sources [12, 13]. Conventionally, hydrogen can be produced directly from natural gas through three major reaction pathways, steam reforming (SR), catalytic partial oxidation (CPO), and auto-thermal steam reforming (ATR) [14]. Although centralized hydrogen production followed by liquefaction or compression of hydrogen for transportation is a suggestion with least extra expenditure [6, 15, 16], such post-processes consume huge amount of energy.
Instead of transporting the hydrogen gas to the refueling stations, transportation of liquefied natural gas through existing piping systems followed by on-site hydrogen production has been considered. Other routes are also suggested. For instance, liquid energy carrier such as, ammonia and methanol can be produced at a centralized facility, followed by low cost transportation.Both ammonia and methanol are considered as intermediates because they exist as liquid under modest conditions and possess a relatively high hydrogen density of 17.6% and 12.5% respectively. At the gas stations, hydrogen can be produced by thermal cracking of delivered ammonia [17, 18] while methanol can be converted into hydrogen by conventional steam reforming process [8, 19-21]. Hydrogen production through methanol micro-reformer installed to the vehicles is also an innovative consideration [22], but this requires an additional capital investment for the vehicle owners and the energy content stored is much less compared to storage of high purity hydrogen.
Nevertheless, construction of hydrogen refueling stations is undoubtedly vital to ensure a sustainable delivery of hydrogen for automotive industry in future.Indeed, until 2009, more than 70 hydrogen refueling stations have been built all around the world such as,US, Germany and Japan. Majority of these stations produce hydrogen by electrolysis of water from renewable energy like solar and wind power [23]. The renewable energy technologies face constraints such as low energy density per area and uneven distribution over the world. In this work, different pathways for hydrogen supply to gas stations from natural gas are evaluated based on a technological perspective,i.e. production yield, operating condition and energy efficiency. In economic aspect, the profitability, payback time (PB),return on investment (ROI) and internal rate of return(IRR) are determined with the aid of cumulative cash flow diagrams. Sensitivity analysis is also constructed to evaluate the impact of different variables on the economic analysis.
2 TECHNOLOGICAL ANALYSIS
From the development of the Internal Combustion Engines (ICE) for rocket in 13th century in China and the first patented automobile by Karl Benz on 29th January, 1886, gasoline and diesel-powered ICE for energy supply to vehicles has become a mature technology today. However, the maximum energy efficiency of gasoline-powered ICE can only reach about 60% even for Carnot Engine with inlet and outlet temperature of 2300 K and 925 K respectively [24]. In reality, only about 15% and 20% of the energy from gasoline and diesel is actually converted into kinetic energy for powering a car [25]. On the other hand,proton Exchange Membrane Fuel Cell (PEMFC) fuelled with hydrogen would be one of the considerably clean and efficient engines to replace ICE as chemical and electrical energy (PEMFC) can be transmitted more easily when comparing with mechanical energy and heat energy (ICE) because of the involvement of electronic Coulomb interaction [26]. Table 1 shows the comparison of the energy content and energy efficiency between different energy conversion methods using various fuels. Except Direct Methanol Fuel Cell(DMFC) which is still in early development, PEMFC can generally attain an output energy efficiency of 50%-60% while ICE of gasoline and diesel-powered vehicles can merely achieve an efficiency of 35%-50%.With respect to the overall energy efficiency, converting energy from hydrogen with PEMFC should have a much promising future than ICE.
Apart from energy efficiency, environmental problems due to high emission of carbon dioxide and volatile organic compounds (VOCs) from combustion of fossil fuels have also aroused public concerns. The carbon dioxide is believed to associate with global warming and climate change. PEMFC adopts the combination process of hydrogen and oxygen with only trace amount of nitrogen oxides formed when air is used as the oxidants. Concentration of secondary pollutants like ozone, aldehydes, PM10(particulate matter) and peroxyacetyl nitrate (PAN) can thus be greatly reduced when comparing with traditional combustion process of fossil fuels [34].
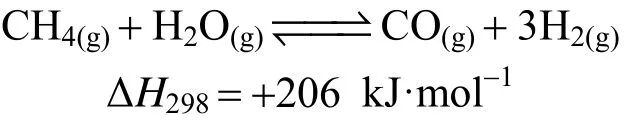
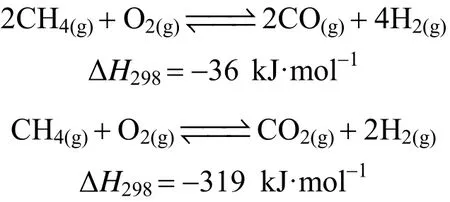
In consideration of the abovementioned benefits,PEMFC supported by hydrogen is regarded as a crucial alternative engine for the automotive industry.Production of hydrogen from renewable energy source is in turn to be an essential step for the sustainability of hydrogen economy as well. However, hydrogen production from renewable energy sources is still under investigation. Natural gas, which has the highest H/C ratio of 25% among all hydrocarbons [35], is prompted to be the short-term solution. Traditionally,steam methane reforming (SMR) can be operated in an economic way with a high production yield, and therefore, it is acknowledged as one of the most mature technology for large scale hydrogen production among the three chemical reaction pathways illustrated below:
Steam methane reforming (SMR)main reaction:
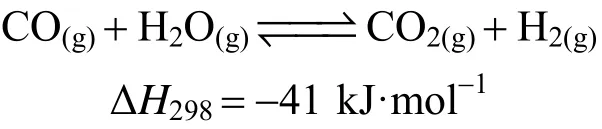
water gas shift reaction:
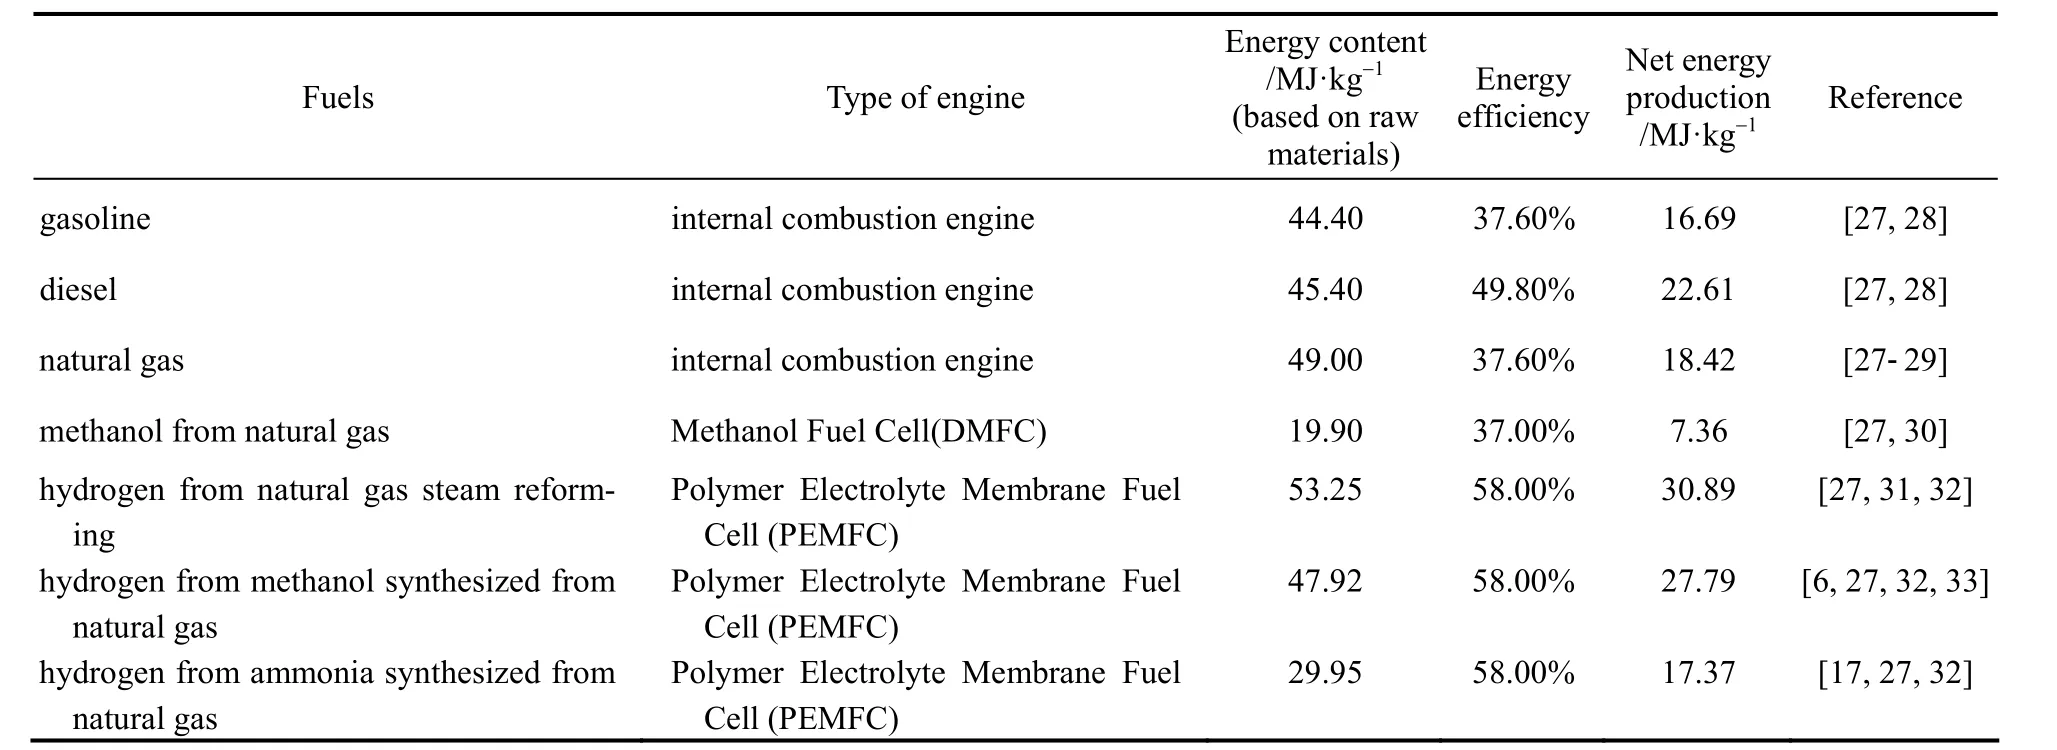
Table 1 Comparison of net energy generation of different fuels in various type of engines① Assumptions: The energy content of fuels are calculated in HHV (high heat value) basis.
Auto-thermal reforming (ATR)main reaction:
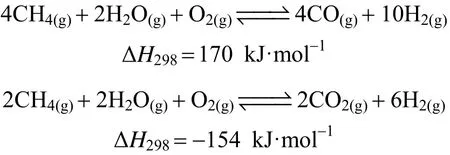
Catalytic partial oxidation (CPO)main reaction:
However, large scale production of hydrogen through SMR following with liquefied hydrogen or compressed hydrogen delivery may raise concern about safety, mass efficiency and hydrogen distribution [16]. Although huge amount of research have been conducted on hydrogen production from natural gas through reforming processes, limited studies have reported the whole supply-chain management from production of hydrogen from the raw materials to the delivery and storage of hydrogen at the gas stations.
Figure 1 summarizes the pathways have been proposed for distributed hydrogen production. Except the delivery of natural gas through existing pipeline system for on-site hydrogen production in Pathway b,all other pathways involves large scale hydrogen production. Currently, more than 90% of hydrogen production plants in U.S. adopt SR process [35], neither using auto-thermal reforming nor catalytic partial oxidation process. Although ATR and CPO processes have taken the advantages of exothermic nature which can shorten the reaction start-up time, they both provide lower efficiency and reformate quality (40%-50% on a dry basis) when comparing with SR process (70%-90%on a dry basis) [6]. Thus, SR process of high production yield (0.375 kg H2per kg natural gas as shown in Table 2) is still considered as the best large scale production method.
Since the concept of hydrogen economy is proposed, it is expected that hydrogen is to be delivered to the refueling stations by pipeline transportation of compressed hydrogen or as liquefied hydrogen transported by trucks. In reality, embrittlement of stainless steel caused by diffusion of hydrogen gas results in crack formation to the conventional pipelines unless using special materials for the infrastructure construction. The extreme operating conditions,i.e. high pressure (~13.79-20.69 MPa) and low boiling temperature(20 K), requires extra cost on safety. The additional expenditure can be dramatically high as liquefaction and storage typically cost US $5-$10 GJ-1[6], which is equivalent to 25%-40% of the energy contents of the stored hydrogen.
To address the issues of safety and cost effectiveness, an alternative strategy is to postpone the handling of hydrogen gas by on-site production. As natural gas possesses a much higher boiling point (111.6 K) than hydrogen (20.2 K) [26] and the pressure for compression of natural gas (1.38-10.34 MPa) [36] in pipeline system is also lower than that of hydrogen (≈17.93 MPa) [37], a significant reduction of the cost for liquefaction or compression of natural gas is expected.SR process adopting membrane reactor has also been suggested for on-site hydrogen production because of its lower reaction temperature (673-873 K) when comparing with conventional SR (≈1073K) and higher methane conversion (≈98%) [12, 38, 39]. Therefore, the distributed hydrogen production by SR in refueling stations is preferred, despite that it lost the advantage from economic of scale in centralized production facility.
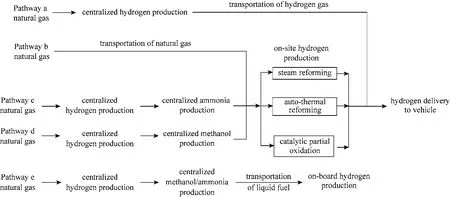
Figure 1 Possible production pathway of hydrogen from natural gas
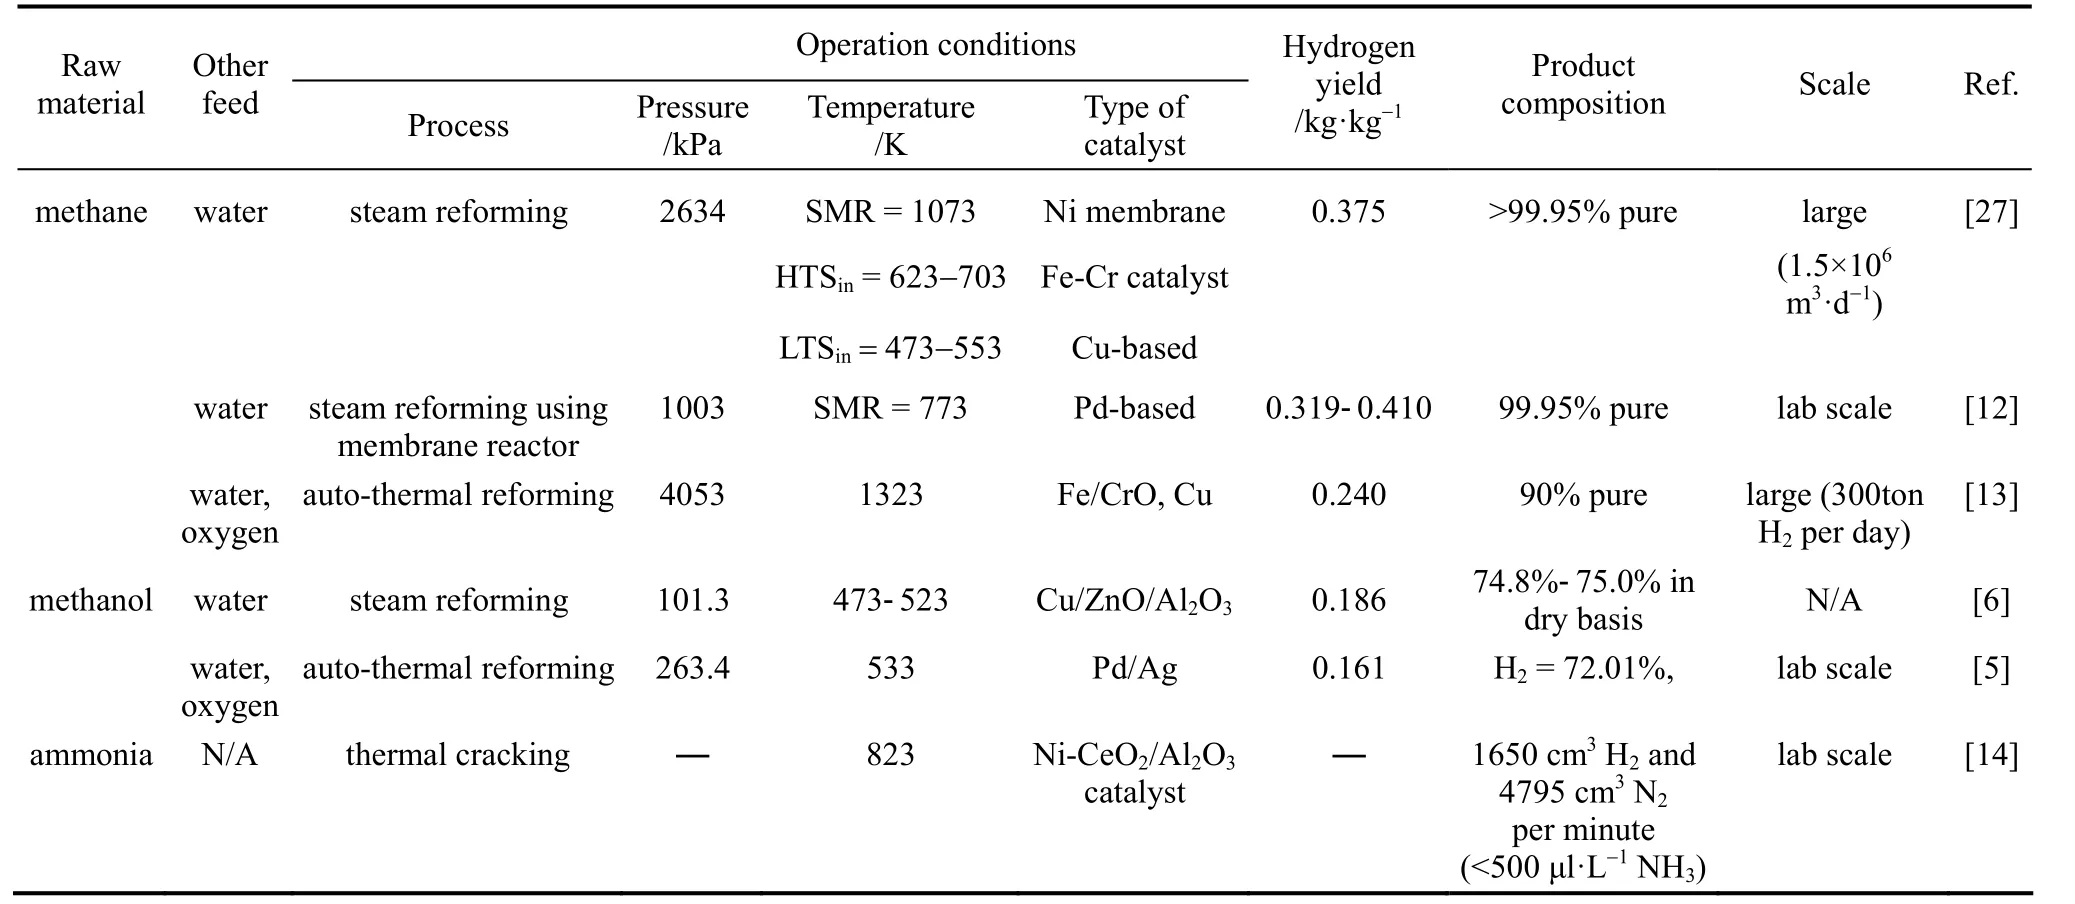
Table 2 Operating conditions for various hydrogen production methods
Although transportation of natural gas is technically more feasible than hydrogen, both of them are still less cost effective compared to the fuel in liquid state under ambient conditions such as petroleum.Therefore, Pathway c and d are also suggested as possible options,i.e. hydrogen produced from centralized facility is transformed to liquid energy carrier such as ammonia c and methanol d for transportation. At the refueling stations, the liquid fuel is then converted back to hydrogen.
For Pathway c, ammonia is considered as one of the intermediates because of its high stability and hydrogen density (17.6%) [15]. It can be transported and stored under modest pressure as a liquid inexpensively since the vapor pressure of ammonia at 313.15K is only 1.55 MPa. Unfortunately, the production of hydrogen from ammonia requires high temperature(723-773 K) to initiate the thermal cracking process[40]. The trace amount of unreacted ammonia is still far more than the tolerant limit of PEM fuel cell (<0.1 μl·L-1NH3) even at temperatures as high as 1273K [15]as ammonia is a poisoning agent to the fuel cell catalyst. The extremely high temperature and strict control on concentration of ammonia make it incompatible for hydrogen production. Recently, Li and Hurley [40] has suggested to generate hydrogen from the reaction of ammonia using magnesium hydride as the catalyst,but it is still at the early stage of research.
Alternatively, Pathway d appears to be another appropriate process in which methanol is produced.This liquid intermediate has vapor pressure of 36 kPa at temperature 313.15 K [41] and high hydrogen density (12.5%). Traditionally, hydrogen production from methanol can be achieved similarly as natural gas but with a much lower SR temperature of 473-523 K and a production yield of 0.185 kg H2per kg methanol(refer to Table 2). Because of the low operating temperature, energy consumption can be minimized. However, the heating up the reactants by radiation from furnace walls is slower than gas reactants and this results in a slower endothermic SR process (residence time on the order of seconds) [42]. Methanol steam micro-reformer with Cu/Zn/Al/Zr catalyst supported on metal foams emerged to cope with this difficulty [33].
Pathway e in Fig. 1 is similar to Pathway c and d.The idea is to store the liquid intermediate chemical on the vehicles before converting into hydrogen when needed. This greatly minimizes the transportation and operation cost of refueling stations for handling of hydrogen gas. However, two main problems are associated here. Firstly, vehicles are required to adopt reformers and this increases the fixed capital cost of vehicle significantly. Secondly, the hydrogen density of energy carriers such as ammonia, methanol and natural gas is much lower than pure hydrogen so that the quantity of energy stored in the fuel is much lower.
Before advancement in this field, hydrogen production from natural gas would be the most technically available way. Nevertheless, high energy consumption due to delivery of liquefied or compressed hydrogen from centralized SR plants makes Pathway a unfavorable. As the production of hydrogen from ammonia cracking using metal hydrides may not be achieved in near future, the Pathway c and d are more practical solutions for distributed hydrogen production.
3 ECONOMIC ANALYSIS
A low cost and environmentally friendly source of hydrogen is essential for facilitating the hydrogen economy. Nowadays, hydrogen production from natural gas and coal are the most mature technologies with low production cost at $2.48-3.17 per kg H2and $0.36-1.83 per kg H2respectively [43]. Coal is more economically favorable when comparing with natural gas for its lower feedstock cost [$1.26 per GJ LHV (lower heating value)], but high greenhouse gas emission from coal gasification makes it less favorable when compared with the lower carbon content natural gas [44]. In this work, economic analysis is taken into account by constructing cash flow diagrams from which payback time (PB), return of investment (ROI) and internal rate of return (IRR) are evaluated for the Pathways b and d.Sensitivity analysis is performed for appraising the impacts of different variables such as operating capacity, feedstock costs, hydrogen storage capacity,etc.
Considering the economic benefits of distributed hydrogen production, cash flow diagrams for Pathway b and d are constructed as shown in Fig 2. The hydrogen refueling stations using natural gas and methanol of design capacity 1500 kg H2per day and 85% capacity with 38.9% tax rate under an inflation rate of 1.9% annually are assumed [45]. Its operating life of the decentralized plant is assumed to be 20 years and the construction period is 6 months. The overall cash flow diagrams depend on variety of factors like, capital costs, fixed operating costs, feedstock costs and tax rate. In the model of methanol, the capital investment is assumed to be 79% of natural gas steam reforming plants [46]. Fixed operating cost of methanol is estimated regarding the standard enthalpy change of production reactions of natural gas and methanol per kg H2for order of magnitude analysis. Cash flow diagrams of the two processes are assumed to have the same working capital (excluding the raw materials) as the scale and infrastructure of them are similar. Table 3 lists the economic values for constructing the cumulative cash flow diagram.
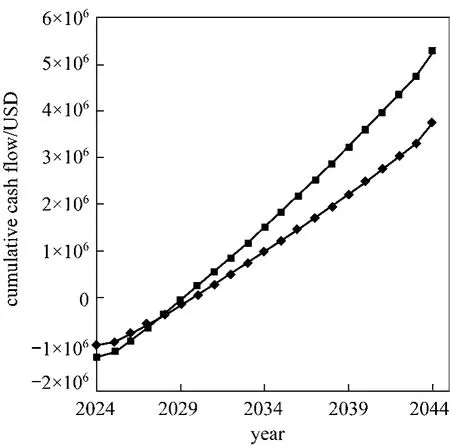
Figure 2 Cash flow diagram of distributed hydrogen production from natural gas (Pathway b) and methanol(Pathway d)■ natural gas; ◆ methanol
Payback time of Pathway b and d determined from the cash flow diagrams are 6 and 7 years respectively. Pathway b with a shorter PB, meaning that it takes less time to recover its capital investment because of the slightly lower capital cost, fixed O&M,feedstock costs. The milder operating conditions of hydrogen production from methanol SR leads to 79%and 40% reduction of capital investment and variable operating cost compared to Pathway b. However, the centralized methanol production process from natural gas with yield between 60%-70% [47] has raised the feedstock cost of methanol, which is about 50%higher than that of natural gas. This also contributes to the lengthened PB for Pathway d. Since payback time provides no indication on the profitability of the whole project, Return on Investment (ROI) is thus introduced to evaluate the efficiency of the investment of two pathways:

As ROI is a ratio of average annual profit (net cash inflow) divided by the initial investment, a negative value of ROI or there are other possibilities with higher ROI implies that the investment is unfavorable.Table 4 compares the ROI of the two pathways. Both Pathways b and d have a positive ROI. About 20%less capital investment is required by hydrogen production process using methanol than natural gas. However,the average annual profit of hydrogen production from natural gas is about 38% higher than methanol process due to a much lower feedstock costs as described above. As a result, return of investment (ROI) of hydrogen production from natural gas (21.63%) is higher than production from methanol (19.38%). Since distributed hydrogen production from natural gas has a higher ROI and shorter PB, it should be the best pathway from economic perspective. Despite that transportation of liquid methanol is cheaper thancompressed natural gas, hydrogen production from methanol is considered as a less economically feasible process in terms of ROI and PB based on above evaluation because of the high feedstock costs.
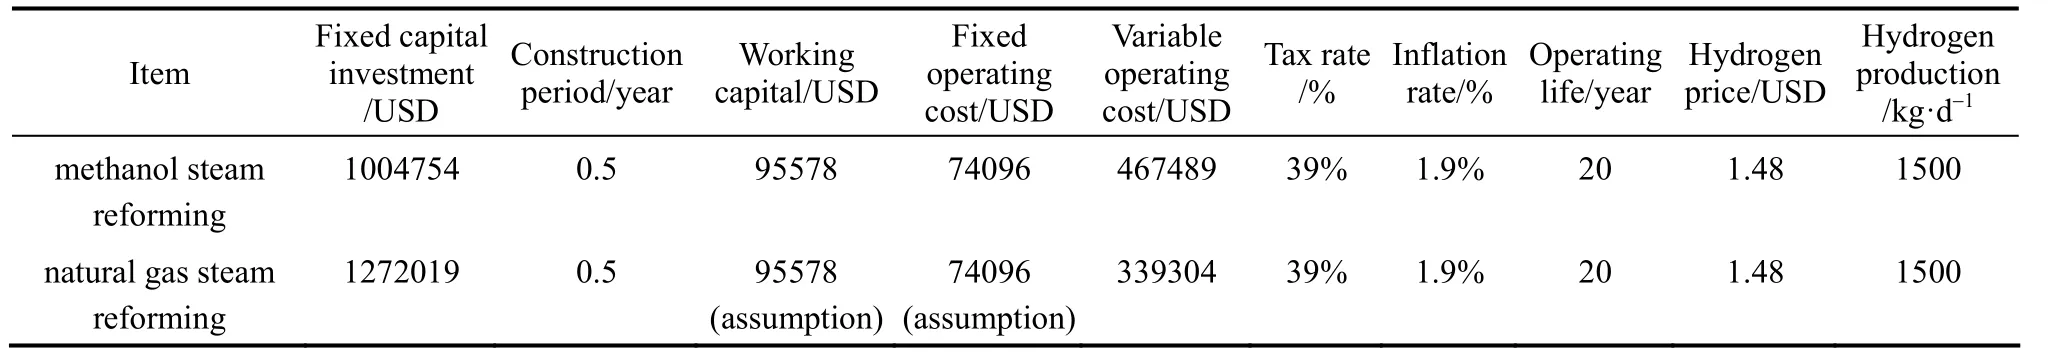
Table 3 Cash flow analysis of hydrogen production from methanol at a gas station
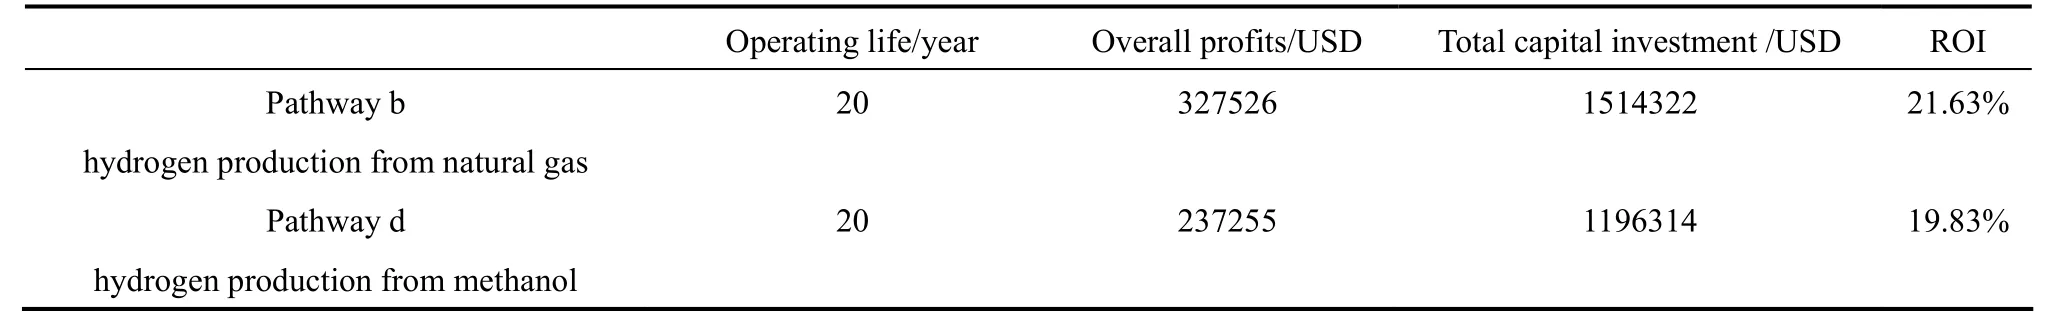
Table 4 Comparison of return of investment (ROI) of hydrogen production from natural gas and methanol
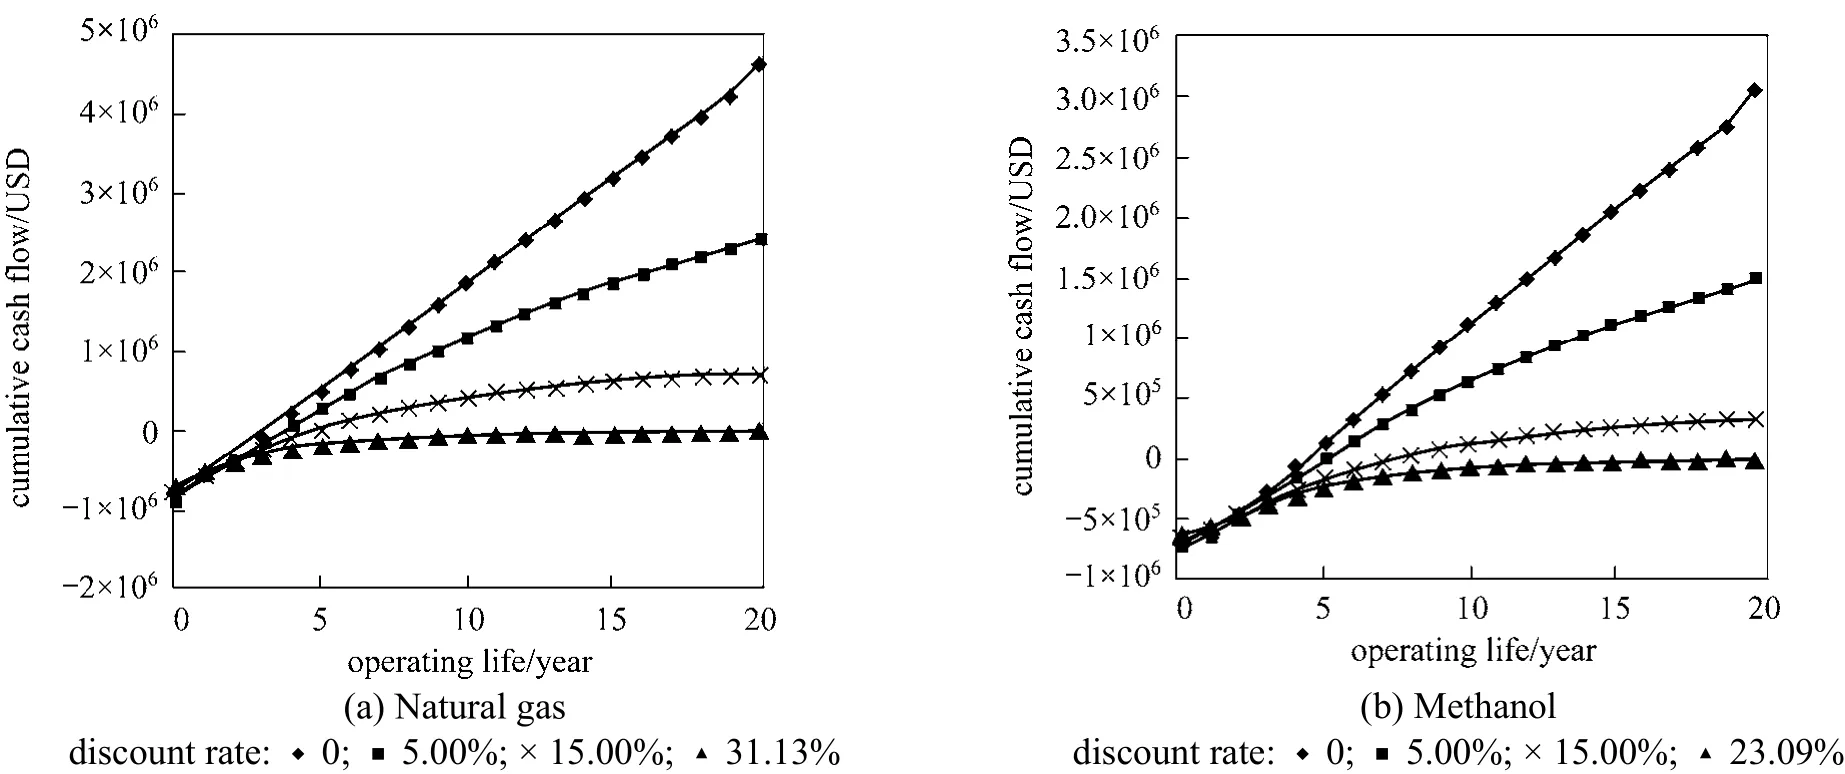
Figure 3 Cash flow diagram accounted for time effect of money for distributed hydrogen production using (a) natural gas and (b) methanol
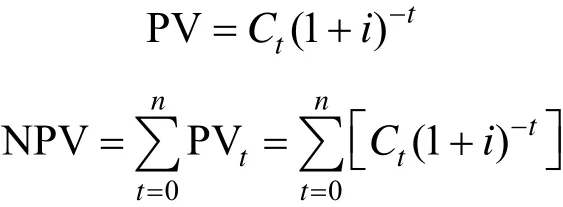
The effect of time on cash flow during a project is not considered in both PB and ROI analyzing methods. In reality, value of money is time dependent because of inflation and depreciation. This should be accounted in the cash flow diagram. Discount rate 0%,5% and 15% are applied to the calculation of net present values for the cash flow diagram and the results are shown in Fig. 3. Prediction based on net present values(NPV) depends on the total project lifetime and the discount rate and followed the equations as shown below:
From Fig. 3, both of projects have similar trend of net present values (NPV) which decreases when discount rate increases. Pathway d responds more rapidly and affected greatly by discount rate than Pathway b because of its higher feedstock costs. In Table 4, we showed that ROI is a good indicator of profitability of the two investigated pathways. Nevertheless, the discount rate affects the profitability of a project dramatically, which can be reflected by the use of Internal Rate of Return (IRR). Fig. 4 plotted the final cumulative cash flows of the two projects against discount rate. Pathway b is found to have a higher IRR value than Pathway d. The IRR values for Pathway b and Pathway d are 31.13 % and 23.09 % respectively.
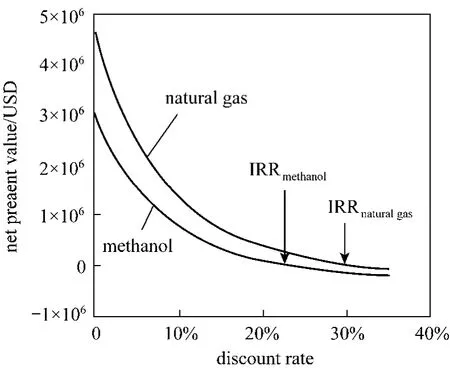
Figure 4 Determination of internal rate of return for distributed hydrogen production from natural gas and methanol
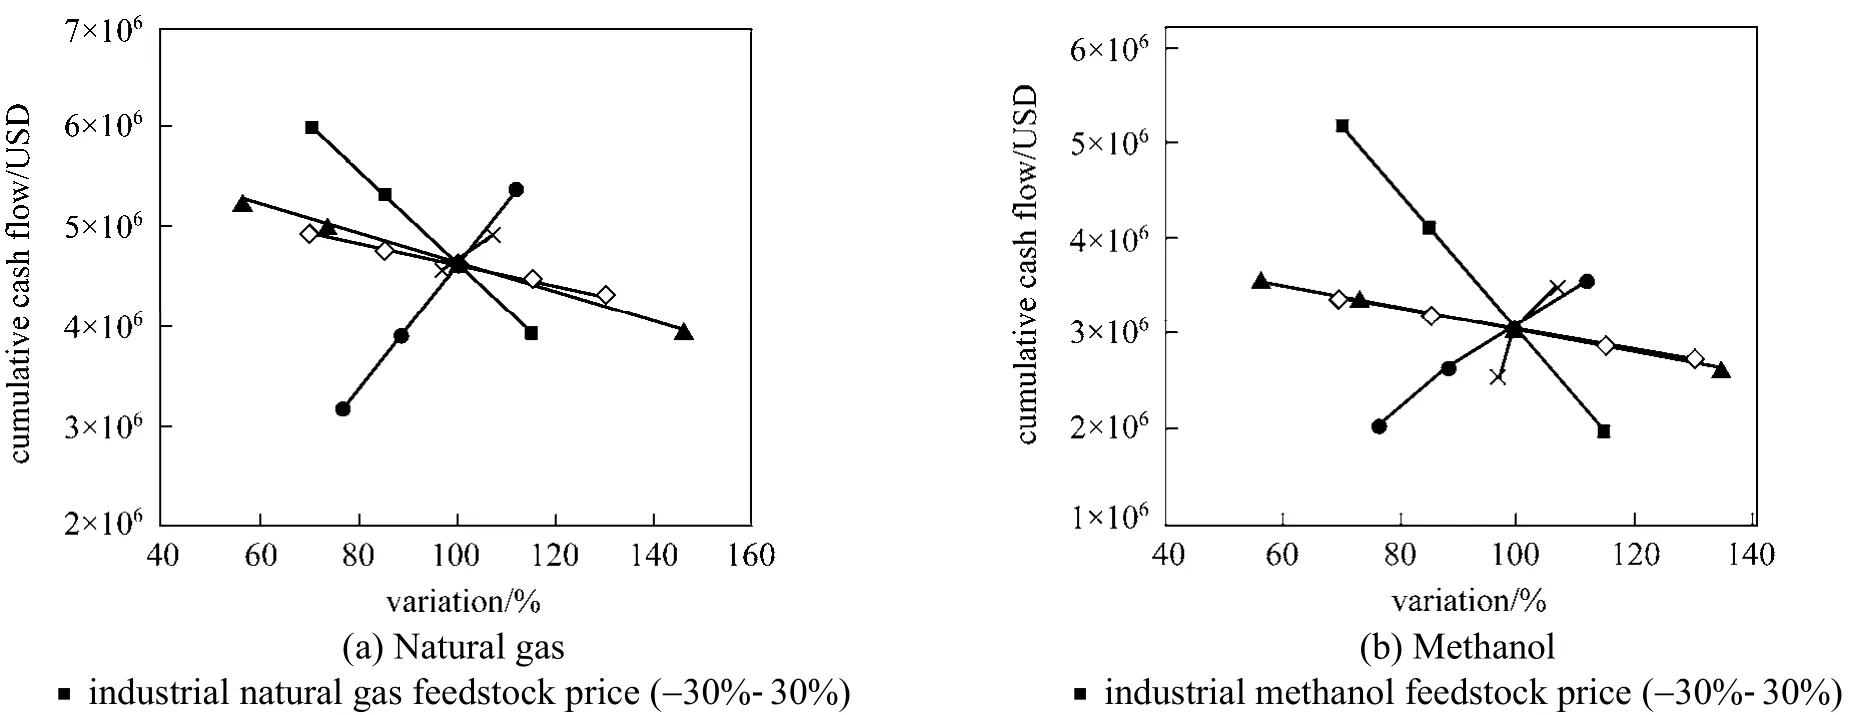
Figure 5 Sensitivity analysis of distributed hydrogen production from (a) natural gas and (b) methanol● operating capacity (65%-95%); ▲ capital cost (USD 5×10⁵-1.7×10⁶); × feedstock conversion efficiency (70%-80%); ◇ total fixed operating costs (-30%-30%)
Uncertainty always exist in reality due to the fluctuation of equipment and material prices, thus,sensitivity analysis for both projects are conducted to evaluate the impact of uncertainty on the profitability.The results are shown in Fig. 5. Both projects are not sensitive to capital investment cost and total fixed operating costs. This is due to independence of initial investment cost at year 0 and fixed cost has not brought a big difference in net present value as its amount is insignificant. However, both projects are highly sensitive to the operating capacity of plants because increasing capacity results in larger revenue [47]. Since the feedstock costs of reactants in Pathway d contributed to a larger portion in total production cost than its counterpart, project of methanol is more sensitive to feedstock price than natural gas.
4 CONCLUSIONS
With regard to the oil depletion and high greenhouse gas emission from combustion of fossil fuels,hydrogen is considered to be a cleaner and more efficient energy source to be used in the future. Lowering the production cost of hydrogen is crucial to make it an alternative fuel for vehicles. However, challenges on distribution of hydrogen to gas stations result in slow introduction of hydrogen infrastructure. Based on the current study, distributed hydrogen production using natural gas is the most technologically and economically feasible in near future. It will be used for hydrogen production until more efficient renewable energy supply is developed.
ACKNOWLEDGEMENTS
The authors would like to acknowledge the support from the Hong Kong University of Science and Technology via the Undergraduate Research Opportunity Program (UROP) and Lighten R&D Consultancy Ltd for providing advices.
REFERENECES
1 Plunkett Research Ltd., “Automobile Industry Introduction”,Plunkett Research, Ltd. (2011).
2 Dargay, J., Gately, D., Sommer, M., “Vehicle ownership and income growth”,Energy J., 28, 1960-2030 (2007)
3 Attarian, J., “The coming end of cheap oil—To Hubbert’s peak and beyond”,The Social Contract, 276-286 (2002)
4 The U.S. Energy Information Administration, “U.S. Gasoline and Diesel Retail Prices”, June 2011.
5 Office of Transportation and Air Quality, “Emission facts: Average carbon dioxide emissions resulting from gasoline and diesel fuel”,Environmental Protection Agency, USA, EPA420-F-05-001 (2005).
6 Faungnawakij, K., Kikuchi, R., Eguchi, K., “Thermodynamic evaluation of methanol steam reforming for hydrogen production”,J.Power Sources, 161, 87-94 (2006)
7 Matsumura, Y., Ishibe, H., “Effect of zirconium oxide added to Cu/ZnO catalyst for steam reforming of methanol to hydrogen”,J.Mol.Catal.A:Chem., 345, 44-53 (2011).
8 Agarwal, V., Patel, S., Pant, K.K., “H2production by steam reforming of methanol over Cu/ZnO/Al2O3catalysts: Transient deactivation kinetics modeling”,Appl.Catal.,A, 279, 155-164 (2005).
9 Christopher, B.J., Gulari, E., “Hydrogen production from methanol decomposition over Pt/Al2O3and ceria promoted Pt/Al2O3catalysts”,Catal.Comm., 5, 431-436 (2004).
10 Cortright, R.D., Davda, R.R., Dumesic J.A., “Hydrogen from catalytic reforming of biomass-derived hydrocarbons in liquid water”,Nature, 418, 964-967 (2002).
11 Chen, W.H., Syu, Y.J., “Thermal behavior and hydrogen production of methanol steam reforming and autothermal reforming with spiral preheating”,Int.J.Hydrogen Energy, 36, 3397-3408 (2011).
12 Bernardo, P., Barbieri, G., Drioli, E., “Evaluation of membrane reactor with hydrogen-selective membrane in methane steam reforming”,Chem.Eng.Sci., 65, 1159-1166 (2010).
13 De Castro, J., Rivera-Tinoco, R., Bouallou, C., “Hydrogen production from natural gas: Auto-thermal reforming and CO2 Capture”,Chem.Eng.Trans., 21, 163-168 (2010).
14 Appl, M., Gössling, H., “Production of synthesis gas after the steam reforming process”,Chemiker Zeitung, 96 (3), 135-153 (1972).
15 Tarun, C.B., Croiset, E., Douglas, P.L., Gupta, M., Chowdhury, M.H.M.,“Techno-economic study of CO2capture from natural gas based hydrogen plants”,Int.J.Greenhouse Gas Control, 1, 55- 61 (2007).
16 Li, Q.F., He, R.H., Jensen, J.O., Bjerrum, N.J., “Approaches and recent development of polymer”,Chem.Mater., 15, 4896-4915 (2003).
17 Wang, M., Li, J., Chen, L., Lu, Y., “Miniature NH3cracker based on microfibrous entrapped Ni-CeO2/Al2O3catalyst monolith for portable fuel cell power supplies”,Int.J.Hydrogen Energy, 34, 1710-1716(2009).
18 Thomas, G., Parks, G., “Potential Roles of Ammonia in a Hydrogen Economy. A Study of Issues Related to the Use Ammonia for On-Board Vehicular Hydrogen Storage”, U.S. Department of Energy Report, 2006[2012-4-22] http://www.hydrogen.energy.gov/pdfs/nh3_paper.pdf
19 Pérez-Hernández, R., Gutiérrez-Martínez, A., Palacios, J.,Vega-Hernández, M., Rodríguez-Lugo, V., “Hydrogen production by oxidative steam reforming of methanol over Ni/CeO2ZrO2catalysts”,Int. J. Hydrogen Energy, 36, 6601-6608 (2011).
20 Basile, A., Tereschenkob, G. F., Orekhova, N. V., Ermilova, M. M.,Galluccia, F. , Iulianellia, A., “An experimental investigation on methanol steam reforming with oxygen addition in a flat Pd-Ag membrane reactor”, Int. J. Hydrogen Energy, 31, 1615-1622 (2006).
21 Yang, M., Li, S., Chen, G., “High-temperature steam reforming of methanol over ZnO-Al2O3catalysts”, Appl. Catal., B, 101, 409-416(2011).
22 Yu, H., Chen, H., Pan, M., Tang, Y., Zeng, K., Peng, F., Wang, H.,“Effect of the metal foam materials on the performance of methanol steam micro-reformer for fuel cells”, Appl. Catal., A, 327, 106-113(2007).
23 Fuel Cells 2000, “World hydrogen fueling stations”, 2009 [2012-5-12],http://www.fuelcells.org/wp-content/uploads/2012/02/h2fuelingstati ons-worldl.pdf
24 Ogden, J. M., “Prospects for building a hydrogen energy infrastructure”, Annu. Rev. Energy Env., 24, 227-279 (1999).
25 Eidelman, F., “Efficiency of internal combustion engine” Economy &Energy 1998 [2012-4-22] http://ecen.com/content/eee7/motoref.htm
26 Schlapbach, L., Züttel, A., “Hydrogen-storage materials for mobile application”, Nature, 414, 353-358 (2001).
27 Wang, M.Q., Huang, H.S., “A full fuel-cycle analysis of energy and emissions impacts of transportation fuels produced from natural gas”,US Department of Energy, Center for Transportation Research, Argonne National Laboratory, ANL/ESD-40 1999 [2012-4-22],http://www.transportation.anl.gov/pdfs/TA/13.pdf
28 The National Renewable Energy Laboratory, “Advanced technology and alternative fuel vehicles”, U.S. Department of Energy,DOE/GO-102001-1142, FS143, 2011 [2012-4-22] http://www.nrel.gov/docs/fy01osti/27957.pdf
29 Szybist, J.P., Chakravathy, K., Stuart Daw, C., “Analysis of the impact of selected fuel thermochemical properties on internal combustion engine efficiency”, Energy Fuels, DOI: 10.1021/ef2019879 (2012).
30 Ren, X., Zelenay, P., Thomas, S., Davey, J., Gottesfeld, S., “Recent advances in direct methanol fuel cells at Los Alamos National Laboratory”, J. Power Sources, 86, 111-116 (2000).
31 Spath, P.L., Mann, M.K., “Life cycle assessment of hydrogen production via natural gas steam reforming”, US Department of Energy, National Renewable Energy Laboratory report, NREL/TP-570-27637, 2001[2012-4-22] http://www-pord.ucsd.edu/~sgille/mae124_s06/27637.pdf
32 Hart, D., Hydrogen power—The Commercial Future of the Ultimate Fuel, Financial Times Energy Publishing, UK (1997).
33 Yu, H., Chen, H.Q., Pan, M.Q., Tang, Y., Zeng, K., Peng, F., Wang,H., “Effect of the metal foam materials on the performance of methanol steam micro-reformer for fuel cells”, Appl. Catal., A, 327,106-113 (2007).
34 Qadrdan, M., Shayegan, J., “Economic assessment of hydrogen fueling station, a case study for Iran”, Renewable Energy, 33, 2525-2531(2008).
35 Haryanto, A., Fernando, S., Murali, N., Adhikari, S., “Current status of hydrogen production techniques by steam reforming of ethanol: A review”, Energy Fuels, 19, 2098-2106 (2005).
36 Natural Gas Organization, “Transportation of natural gas”, Natural Gas.org, 2011 [2012-4-22], http://www.naturalgas.org/naturalgas/transport.asp
37 Aceves, S.M., Berry, G., Weisberg, A., “V.D Storage, FY 2005 progress report of DOE hydrogen program”, 2005 [2012-5-16],http://www.hydrogen.energy.gov/pdfs/progress05/v_d_1_aceves.pdf 38 Kim, A.P., Stub Nielsen, C., Jùrgensen, S.L., “Membrane reforming for hydrogen”, Catal. Today, 46, 193-201 (1998).
39 Wang, G., Ogden, J.M., Nicholas, M.A., “Lifecycle impacts of natural gas to hydrogen pathways on urban air quality”, Int. J. Hydrogen Energy, 32, 2731-2742 (2007).
40 LI, L.X., Hurley, J. A., “Ammonia-based hydrogen source for fuel cell applications”, Int. J. Hydrogen Energy, 32, 6-10 (2007).
41 Perry, R.H., Green, D.W., Perry’s Chemical Engineers’ Handbook,7th edition, McGraw-Hill, New York (2007).
42 Stefanidis, G.D., Vlachos, D.G., “Methane steam reforming at microscales: Operation strategies for variable power output at millisecond contact times”, AIChE J., 55, 180-191 (2009).
43 Bartels, J.R., Pate, M.B., Olson, N.K., “An economic survey of hydrogen production from conventional and alternative energy sources”, Int. J. Hydrogen Energy, 35, 8371-8384 (2010).
44 Adamson, K.A., Pearson, P., “Hydrogen and methanol: A comparison of safety, economics, efficiencies and emissions”, J. Power Sources, 86, 548-555 (2000).
45 Steward, D., “H2A Production Model Updates”, US Department of Energy, National Renewable Energy Laboratory, 2011 [2012-4-22],http://www.hydrogen.energy.gov/pdfs/review11/pd089_steward_201 1_p.pdf
46 Stoll, R. E., von Linde, F., “Hydrogen—What are the costs?”, Hydrocarbon Process., Int. Ed., 79, 42-46 (2000).
47 Chen, Y., Wang, Y., Xu, H., Xiong, G. “Efficient production of hydrogen from natural gas steam reforming in palladium membrane reactor”, Appl. Catal., B, 81, 283-294 (2008).
杂志排行

Chinese Journal of Chemical Engineering的其它文章
- Experimental and Modelling Studies of Biomass Pyrolysis*
- Synergistic Multilayer Adsorption for Low Concentration Dyestuffs by Biomass
- Kinetics of Photocatalytic Degradation of Gaseous Organic Compounds on Modified TiO2/AC Composite Photocatalyst*
- 3D Numerical Study on Compound Heat Transfer Enhancement of Converging-diverging Tubes Equipped with Twin Twisted Tapes*
- Error Analysis of Adsorption Isotherm Models for Acid Dyes onto Bamboo Derived Activated Carbon
- Issues in Freeze Drying of Aqueous Solutions*