Error Analysis of Adsorption Isotherm Models for Acid Dyes onto Bamboo Derived Activated Carbon
2012-02-14ChanCheungAllenandMcKay
L.S. Chan, W.H. Cheung*, S.J. Allen and G. McKay
1 Department of Chemical and Biomolecular Engineering, the Hong Kong University of Science and Technology,Hong Kong, China
2 School of Chemistry and Chemical Engineering, Queen’s University Belfast, Belfast, Northern Ireland, UK
1 INTRODUCTION
Water pollution is one of many threats the world population is facing everyday that requires immediate attention. In order to reduce the problems caused by water pollution, many countries and environmental protection authorities impose increasingly tightening effluent standards. As a result, wastewaters contain toxic materials such as dyestuffs and metal ions from a wide range of industries including electroplating,microelectronics, metal forming, paper, textiles, and must be treated before they are discharged.
In the textile industry alone, 30% of dyes are lost in residual liquors through exhaustion and washing operations. Over 7×10⁵tonnes of dyestuff produced annually [1] but available effluent treatment processes are currently capable of removing about half of the dyes lost in residual liquors [2]. Hence, approximately 40000 tonnes of dyes are released into the environment [3]. Furthermore, most dyes are resistant to heat and light and are not biodegradable.
Adsorption is widely used as it is one of the most effective and relatively inexpensive methods in the treatment processes. Highly porous adsorbents with good selectivity such as activated carbon have shown excellent ability as an effective adsorbent for the removal of many aqueous contaminants, both organic and inorganic, such as dyestuffs and certain metal ions.The high adsorption capacity of activated carbon is a result of its high surface area, extensive porosity in the interior of the particles, and presence of many different types of surface functional groups. However, the production cost of activated carbon and its regeneration may be the limiting factors, especially in the developing countries. A challenge in the field of activated carbon production is to produce specific materials with given properties including surface area and porosity from low cost precursors and at low temperatures. Recently, low cost precursors have been the focus of researchers worldwide. Precursors from wastes and agricultural by-products such as rice-hull [4], fruit stones [5, 6], oil-palm shell [7, 8], bagasse [9, 10], waste tyres [11, 12] and sludge [13, 14] have shown potential.
Besides the water pollution, the disposal of solid waste materials is also a serious concern in the area of environmental protection and sustainability in Hong Kong. Over 50000 tonnes of bamboo scaffolding is being dumped as construction waste from Hong Kong’s building and construction projects each year [15].There is a growing concern regarding the reuse and/or recycling of this material as bamboo is a sustainable carbonaceous material. Waste bamboo scaffolding has the potential as a raw material for the production of a range of activated carbon and carbon char due to its high carbon content (44%).
In the present study, the equilibrium adsorption capacity of acid dyes, namely, Acid Blue 25 and Acid Yellow 117, onto the bamboo derived carbon. Equilibrium adsorption isotherms were measured for the single component system and the experimental data were analysed with commonly used models, namely,Langmuir, Freundlich, Redlich-Peterson and Sips isotherm equations. Five different error analysis methods were used to determine the isotherm parameters, including: sum of the squares of errors (ERRSQ); hybrid fractional error function (HYBRID); Marquardt’s percent standard deviation (MPSD); average relative error (ARE); and sum of the absolute errors (EABS).The normalisation method has been used on the error analysis data to determine the most suitable error equation for accurate description of the experimental equilibrium data, and subsequently, the most accurate prediction of the isotherm constants.
2 MATERIALS AND METHODS
2.1 Adsorbent
The received waste bamboo scaffolding from local Hong Kong construction sites was washed with water and reduced in size by hammer milling prior to experiment. A particle size range of 500—710 μm was used throughout the present study. The sieved bamboo was pre-treated by soaking and saturating with orthophosphoric acid, H3PO4(85%, by mass), at different acid to bamboo ratio (Xp). The mixture stirred thoroughly to ensure homogenous mixing of the bamboo and H3PO4. Then, the samples were transferred into alumina containers and subjected to a two-step heating process. Firstly, the mixtures were heated at 150 °C for 2 h and then heated to 600 °C in a furnace under flowing nitrogen for 4 h. After heating, samples were cooled, washed with deionised water until pH value of the filtrate become the same as deionised water,i.e.pH=5.6, and dried for further analysis and characterisation. The dried activated carbon was used without further sieving due to the powdery nature of the produced carbon.
Three activated carbons of high and low surface area were produced for the dye adsorption, namely,HSA1, HSA2 and LSA by varying the acid to bamboo ratio. A commercially available carbon, Calgon F400(Calgon Carbon Corp. USA), was used for comparing the performance of the produced carbon. The BET surface area, average pore radius and pore volumes are shown in Table 1 for all carbons. As can be seen from Table 1, both HSA1 and HSA2 have high surface areas while LSA and F400 are lower surface area carbons. All carbons except HSA2 are microporous.
2.2 Adsorbate
The acid dye adsorption test was used to determine the adsorption capacity of the products using two acid dyes, Acid Yellow 117 (AY117) and Acid Blue 25(AB25) from Ciba Special Chemical and Sigma-Aldrich,respectively. The molecular structures and properties are shown in Fig. 1 and Table 2.
2.3 Equilibrium adsorption study
A fixed mass of activated carbon, 20.0 mg was weighed into 75 ml glass bottles and brought into contact with 50 ml of dye solution with pre-determined initial dye concentrations. The flasks were sealed and agitated continuously at 200 r·min-1in the thermostatic shaker bath and maintained at a temperature of (25±1) °C until equilibrium was reached. At time 0t= and equilibrium, the dye concentrations of the solutions were measured by Varian Cary 1E UV-Vis Spectrophotometer. These data were used to calculate the adsorption capacity,qe, of the adsorbent. The adsorption capacities (qe) of the each activated carbon were determined by:

whereeqis the dye concentration on the adsorbent at equilibrium (mmol·g-1),C0is the initial dye concentration in the liquid phase (mmol·L-1),Ceis the liquid-phase dye concentration at equilibrium (mmol·L-1),Vis the total volume of dye-activated carbon mixture(L),mis mass of adsorbent used (g). Finally, the adsorption capacity,qe, was plotted against the equilibrium concentration,Ce.
3 THEORY
3.1 Single component isotherm
In order to optimise the design of a sorption system to remove the dyes, it is important to establish the most appropriate correlation for the equilibrium curves, namely the sorption isotherms. The experimental data of the amount of sorbate adsorbed on thesorbent are substituted into an equilibrium isotherm model to determine the best-fit model for the sorption system.

Table 1 Physical properties of the activated carbon produced from bamboo

Table 2 Physical and chemical properties of the dyes

Figure 1 Molecular structure of the acid dyes used in the present study
3.1.1Langmuir isotherm
Langmuir [16] proposed a theory to describe the adsorption of gas molecules onto metal surfaces. The Langmuir adsorption isotherm has found successful application to many real sorption processes of monolayer adsorption. The Langmuir equation is based on the assumption of a structurally homogeneous adsorbent where all sorption sites are identical and energetically equivalent. Theoretically, the sorbent has a finite capacity for the sorbate. Therefore, a saturation value is reached beyond which no further sorption can take place. The saturated or monolayer (asCt→∞)capacity can be represented by the expression:

whereKLis Langmuir isotherm constant (L·g-1),aLis Langmuir isotherm constant (L·mmol-1). The Langmuir equation degenerates to Henry’s Law at low concentration:qe=KLCe.
A linear expression of the Langmuir equation is:

Therefore, a plot ofCe/qeversusCegives a straight line of slopeaL/KLand intercept 1/KL, whereKL/aLgives the theoretical monolayer saturation capacity,Q0.
3.1.2Freundlich isotherm
The Freundlich [17] equation is an empirical equation employed to describe heterogeneous systems,in which it is characterised by the heterogeneity factor 1/n. Hence, the empirical equation can be written:

whereqeis solid phase sorbate concentration in equilibrium (mmol·g-1),Ceis liquid phase sorbate concentration in equilibrium (mmol·L-1),KFis Freundlich constant (L·mg1/n-1·g-1) and 1/n is the heterogeneity factor. When n=1, the Freundlich equation reduces to Henry’s Law. A linear form of the Freundlich expression can be obtained by taking logarithms of Eq. (4):

Therefore, a plot of lnqeversus lnCeenables the constant KFand exponent 1/n to be determined. This isotherm is another form of the Langmuir approach for adsorption on an “amorphous” surface.
3.1.3 Redlich-Peterson isotherm
Redlich and Peterson [18] incorporated three parameters into an empirical isotherm. The Redlich-Peterson isotherm model combines elements from both the Langmuir and Freundlich equation and the mechanism of adsorption is a hybrid one and does not follow ideal monolayer adsorption.
The Redlich-Peterson equation is widely used as a compromise between Langmuir and Freundlich systems:
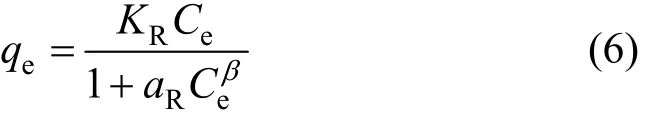
where qeis solid phase sorbate concentration in equilibrium (mmol·g-1), Ceis liquid phase sorbate concentration in equilibrium (mmol·L-1), KRis Redlich-Peterson isotherm constant (L·g-1), aRis Redlich-Peterson isotherm constant (L·mg1/β-1) and β is the exponent which lies between 1 and 0. Its limiting behaviour is summarised here:
When 1β=, it becomes a Langmuir equation:

Plotting the left-hand side of Eq. (10) against lnCeto obtain the isotherm constants is not applicable because of the three unknowns, aR, KRand β. Therefore, a minimisation procedure is adopted to solve Eq. (6) by maximising the correlation coefficient between qepredicted from Eq. (6) and experimental data.
3.1.4 Sips isotherm
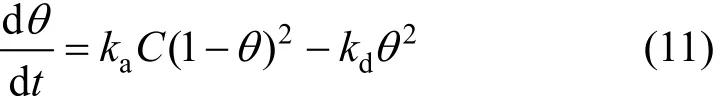
Sips isotherm [19] is also known as the Langmuir-Freundlich isotherm. Langmuir also considered the case of a molecule occupying two sites, e.g. for the dissociative sorption of hydrogen on platinum. In such cases, a derivative of the original Langmuir isotherm can be determined assuming that the rate of adsorption and desorption are proportional to (1-θ)2and θ2, respectively, where θ is the fractional surface coverage.Therefore, the rate equation becomes,
Generalising to m ( = 1 /n) sites and assuming equilibrium produces the Sips sorption isotherm:
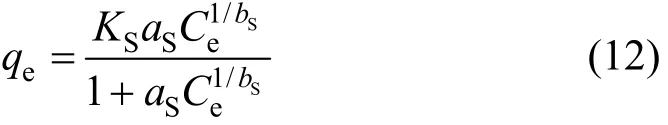
where qeis solid phase sorbate concentration in equilibrium (mmol·g-1), Ceis liquid phase sorbate concentration in equilibrium (mmol·L-1), KSis Sips isotherm constant (L·g-1), aSis Sips isotherm constant (L·mmol-1)band bSis the Sips isotherm constant, dimensionless. At low sorbate concentrations it effectively reduces to a Freundlich isotherm and thus does not follow Henry’s law. At high sorbate concentrations, it predicts a monolayer sorption capacity characteristic of the Langmuir isotherm.
3.2 Error functions
Due to the inherent bias resulting from linearisation, alternative isotherm parameter sets were determined by non-linear regression. This shows a mathematical method for determining isotherm parameters using the original form of the isotherm equation. In the single component isotherm studies, the optimisation procedure requires an error function to be defined in order to be able to evaluate the fit of the isotherm to the experimental equilibrium data. The choice of error function can affect the parameters derived-error functions based primarily on absolute deviation bias the fit towards high concentration data and this weighting increases when the square of deviation is used to penalise extreme errors. This bias can be offset partly by dividing the deviation by the measured value in order to emphasise the significance of fractional deviation.
In this study, five different error functions were examined and in each case the isotherm parameters were determined by minimising the respective error function across the concentration range studied using the Solver add-in with Microsoft Excel. The error functions studied were detailed in the following sections.
3.2.1 The Sum of the square of the errors (ERRSQ)
The sum of the squares of the errors method can be represented by the following equation:
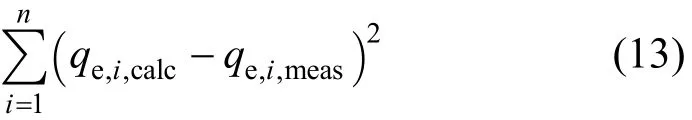
where qe,i,calcare the theoretical adsorbed solid phase concentrations of sorbate on sorbent, which have been calculated from one of the isotherm equations and qe,i,measare the experimentally determined adsorbed sorbate concentrations obtained from Eq. (1) using the experimentally measured equilibrium sorbate liquid phase concentrations, Ce.
Although this is the most common error function in use, it has one major drawback. Isotherm parameters derived using this error function will provide a better fit as the magnitude of the errors and thus the squares of the errors increase-biasing the fit towards the data obtained at the high end of the concentration range.
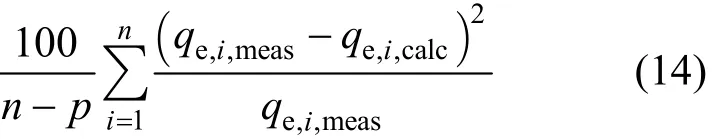
3.2.2 The hybrid fractional error function (HYBRID)
This error function was developed by Porter et al.[20] in an attempt to improve the fit of the sum of the squares of the errors at low concentrations by dividing it by the measured value. It also includes the number of degrees of freedom of the system-the number of data points, n, minus the number of parameters, p, of the isotherm equation-as a divisor.
3.2.3 Marquardt’s percent standard deviation (MPSD)
This error function [21] was used previously by a number of researchers in the field [22]. It is similar in some respects to a geometric mean error distribution modified according to the number of degrees of freedom of the system.

3.2.4 The average relative error (ARE)
This error function [23] attempts to minimise the fractional error distribution across the entire concentration range.

3.2.5 The sum of the absolute errors (EABS)
This approach is similar to the sum of the squares of the errors. Isotherm parameters determined using this error function would provide a better fit as the magnitude of the error increase, biasing the fit towards the high concentration data.

3.3 Optimisation of error functions
As each of the error criteria is likely to produce a different set of isotherm parameters, an overall optimum parameter set is difficult to be directly identified.Hence, in order to try to make a meaningful comparison between the parameter sets, a procedure of normalising and combining the error results was used to producing a so-called “sum of the normalised errors”for each parameter set for each isotherm was adopted by Ho et al [24]. The calculation process for the “sum of the normalised errors” was as follows:
(1) Select one isotherm and one error function and then by minimising that error function, the isotherm parameter set was determined for that error function;
(2) Determine the values for all the other error functions for that isotherm parameter set;
(3) Calculate all other parameter sets and all their associated error function values for that isotherm;
(4) Select each error measure in turn and ratio the value of that error measure for a given parameter set to the maximum value of that error from all the parameter sets for that isotherm;
(5) Sum all these normalised errors for each parameter set.
The parameter set providing the smallest normalised error can be selected as the optimum for that isotherm model providing that there is no bias in the data sampling and type of error methods selected.
4 RESULTS AND DISCUSSION
Figure 2 shows the plots of qeagainst Cefor AB25 on to the bamboo carbons, HSA1, HSA2, LSA and F400. The AB25 adsorption capacities for both HSA carbons are almost the same and are nearly three times higher than that of F400.
Figure 3 shows the plots of qeagainst Cefor another acid dye AY117 on to the three bamboo carbons,HSA1, HSA2, LSA and F400. The AY117 adsorption capacities for both HSA carbons and F400 are similar.On the other hand, the LSA carbon shows poor adsorption for both acid dyes. The removal of the acid dyes can be related to the carbons’ porosity characteristics, which determine the accessibility of the dye molecules. By comparing the physical properties of the produced carbon, both HSA carbons have both a very high surface area and total pore volume compared to the other two carbons. Thus, it would be expected to provide the higher capacity for both acid dye systems. The difference in adsorption between the two acid dyes can be attributed to the molecular size of dyes [25]. By comparing the molecular sizes of both acid dyes (Table 2), AB25 is much smaller than AY117. Hence, it is possible for the smaller dye to penetrate deeper into the interior of the activated carbon with little steric hindrance. On the other hand, for AY117, both HSA carbons and F400 show similar capacities, indicating that for the large AY117 molecule,surface area and porosity have little effect on its adsorption. Due to its large size and the negative charge on both ends, the dye molecule would be adsorbed flat on the carbon surface, hence blocking some available surface active sites and pores for the dye to penetrate further inward. Furthermore, as the average pore diameters of the carbons are either smaller or similar to the dye, it would be difficult for the approaching dye molecules to access the pores. Although LSA is also a microporous carbon and having similar surface area and pore volume as F400 but results in a very low adsorption capacity. Hence, in addition to porosity and surface area, other carbon properties such as surface functional groups and charges affect the adsorption of acid dyes [10, 26-29].
The experimental data of the dye systems adsorbed on the carbons are substituted into four equilibrium isotherm models namely Langmuir, Freundlich,Redlich-Peterson and Sips, respectively and the best-fit model for the sorption system has been determined.
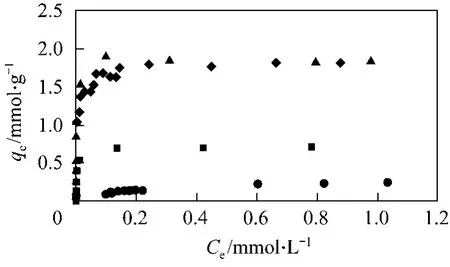
Figure 2 Plot of qe against Ce for the adsorption of AB25 onto bamboo produced carbons◆ HSA1; ▲ HSA2; ● LSA; ■ F400
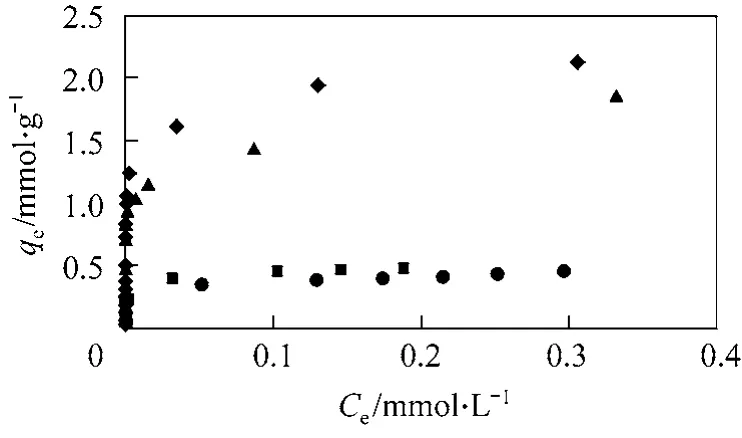
Figure 3 Plot of qe against Ce for the adsorption of AY117 onto bamboo produced carbons◆ HSA1; ▲ HSA2; ● LSA; ■ F400

Table 3 Langmuir sorption isotherm constant for different dye systems
4.1 Linear approach
4.1.1Langmuir isotherm
Langmuir’s model of adsorption depends on the assumption that intermolecular forces decrease rapidly with distance and consequently predicts the existence of monolayer coverage of the adsorbate at the outer surface of the adsorbent. The adsorption data were analysed according to the linear form of the Langmuir isotherm Eq. (2).
All the isotherms were found to be linear over the whole range of the concentration studied and their respective isotherm constants and the correlation coefficients,R2, are shown in the Table 3. The extremely highR2values reflect that the adsorption data follows the Langmuir model very closely. The Langmuir monolayer capacityQorepresents the saturation capacity of acid dyes in each of the systems and the values for the adsorption system studied are also shown in Table 3.
4.1.2Freundlich isotherm
The Freundlich equation predicts that the dye concentrations on the adsorbent will increase so long as there is an increase in the dye concentration in the liquid. However, the experimental data in the present systems indicate that there is a limiting value of the solid phase concentration. The figures exhibit deviation from linearity on the Freundlich linear plot for the whole concentration range. However, for the system of AB25 adsorbed onto F400, the linear Freundlich plots can be divided into regions,i.e. region 1 and region 2, and this interpretation results in better fits to the experimental data at the higher concentration region 2.The two may be characteristic of two different surfaces and indicative of a wide variation in the two binding site energies. In the initial stage of adsorption the dyes will find their strongest orientation for strong binding on the extensively available carbon surface.Eventually, the approach of the dye molecules from the bulk solution will become more restrictive due to the steric hindrance of adsorbed dye molecules already occupying much of the surface sites. It is possible that now only an “end-on” approach by the dye molecule might be feasible and only a weaker adsorption bond is possible. Table 4 shows the Freundlich sorption isotherm constants,bFandKF, and the correlationcoefficients,R2for all the dye-carbon adsorption systems while Table 5 shows the predicted isotherm parameters for the Freundlich multi-stage models for the AB25 with F400 and BR46 with HSA1 systems.

Table 4 Freundlich sorption isotherm constants for different dye systems

Table 5 Multi-stage Freundlich sorption isotherm constants for dye systems
4.2 Error analysis
The two parameter equilibrium isotherm models were fitted using the linearised approach in the previous section. Freundlich isotherm model appears to give a reasonable or poor correlation value, indicating a poor fit of the models to the single component system. One possible cause of this observation is that this isotherm requires the taking of logarithms, hence, introducing similar effects to the error structure.
Furthermore, due to the inherent bias resulting from the linear transformation of the two parameter equilibrium isotherms, it was decided that a nonlinear approach of the two and three parameter isotherm models using the five error functions detailed in Section 3.2 would be conducted. A trial and error procedure was used to determine the isotherm parameters by minimising the error values through the application of the Solver add-in from the spreadsheet software,Microsoft Excel. The calculated isotherm parameters with the error values and together with the sum of normalised sum of errors are presented in Appendices 1 and 2 (Documented as electronic supplement) for each dye. It was found that the HYBRID function provided the best overall results in 17 out of 32 systems (examining four isotherms for two dyes for each of four carbons).
After choosing the overall best error method for determining the isotherm models, the following sectionpresents the plots of different nonlinear isotherm models determined using HYBRID method with the experimental data.
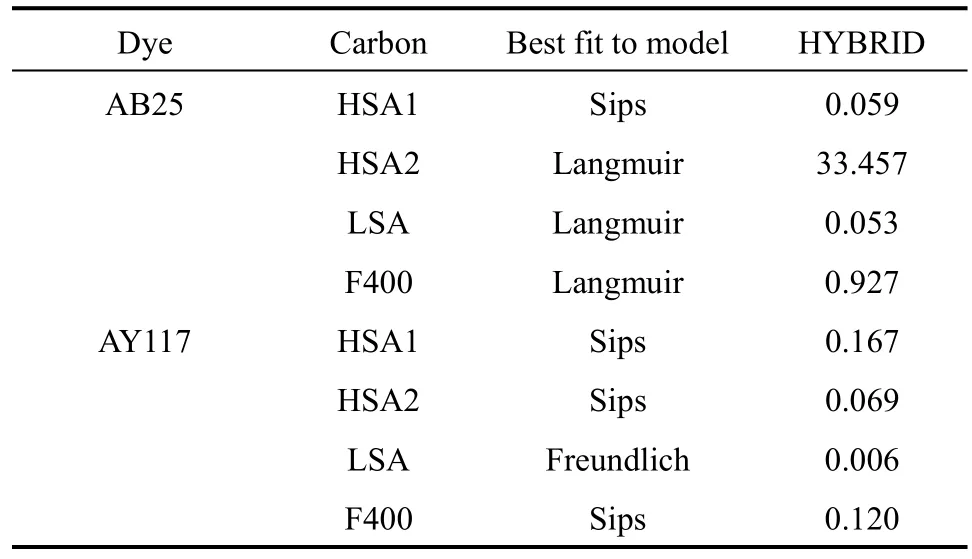
Table 6 Best fit model for different adsorption isotherms based on HYBRID error function
Table 6 lists the best fit model and the HYBRID values for different dye system on carbon adsorption.Among the 8 adsorption systems, Sips performs the best prediction as it is the best fit model for four systems including AB25 + HSA1, AY117 + HSA1,AY117 + HSA2 and AY117 + F400. Langmuir is the second best models; providing the best fit for three systems.
5 CONCLUSIONS
The preparation and investigation of high BET surface area activated carbons from waste bamboo scaffolding by low temperature chemical activation has been demonstrated in the present study. High surface area carbon up to 2500 m2·g-1can be obtained by varying the acid-bamboo ratio. The structure of the precursor has a strong effect in the physical properties,surface area and porosity, of the resulting carbon.
Adsorption studies of acid dyes were conducted.The high surface area carbon shows nearly three times higher adsorption capacities for both types of dyes than the commercial carbon, F400, except in the case of AY117.However, the low surface area carbon shows poor adsorption for all dyes. The surface area of the carbon plays an important role in the adsorption of the dyes while the porosity has little effect.
Error function analysis among the 8 adsorption systems found that HYBRID error function provided the best overall results. Sips performs the best prediction as it is the best fit model determined using HYBRID method with the experimental data.
ACKNOWLEDGEMENTS
The authors would like to acknowledge the support of the Research Grant Council of Hong Kong SAR, the Innovation and Technology Fund of Hong Kong SAR, the Hong Kong University of Science and Technology and Green Island International Ltd.
1 Robinson, T., McMullan, G., Marchant, R., Nigam, P., “Remediation of dyes in textile effluent: A critical review on current treatment technologies with a proposed alternative”, Bioresour. Technol., 77,247-255 (2001).
2 Kumar, M.N.V.R., Sridhari, T.R., Bhavani, K.D., Dutta, P.K.,“Trends in color removal from textile mill effluents”, Colourage, 45,25-34 (1998).
3 Marsh, H., Rodriguez-Reinoso, F., Activated Carbon, Elsevier, New York (2006).
4 Guo, Y.P., Rockstraw, D.A., “Activated carbons prepared from rice hull by one-step phosphoric acid activation”, Micropor. Mesopor.Mat., 100, 12-19 (2007).
5 Ugurlu, M., Guerses, A., Acikyildiz, M., “Comparison of textile dyeing effluent adsorption on commercial activated carbon and activated carbon prepared from olive stone by ZnCl2activation”, Micropor. Mesopor. Mat., 111, 228-235 (2008).
6 Gonzalez, M.T., RodriguezReinoso, F., Garcia, A.N., Marcilla, A.,“CO2activation of olive stones carbonized under different experimental conditions”, Carbon, 35, 159-162 (1997).
7 Tan, I.A.W., Hameed, B.H., Ahmad, A.L., “Equilibrium and kinetic studies on basic dye adsorption by oil palm fibre activated carbon”,Chem. Eng. J., 127, 111-119 (2007).
8 Ahmad, A.L., Loh, M.M., Aziz, J.A., “Preparation and characterization of activated carbon from oil palm wood and its evaluation on methylene blue adsorption”, Dyes Pigment, 75, 263-272 (2007).
9 Onal, Y., Akmil-Basar, C., Sarici-Ozdemir, C., Erdogan, S., “Textural development of sugar beet bagasse activated with ZnCl2”, J.Hazard. Mater., 142, 138-143 (2007).
10 Valix, M., Cheung, W.H., McKay, G., “Preparation of activated carbon using low temperature carbonisation and physical activation of high ash raw bagasse for acid dye adsorption”, Chemosphere, 56,493-501 (2004).
11 Hamadi, N.K., Swaminathan, S., Chen, X.D., “Adsorption of Paraquat dichloride from aqueous solution by activated carbon derived from used tires”, J. Hazard. Mater., 112, 133-141 (2004).
12 Teng, H.S., Lin, Y.C., Hsu, L.Y., “Production of activated carbons from pyrolysis of waste tires impregnated with potassium hydroxide”, J. Air Waste Manage. Assoc., 50, 1940-1946 (2000).
13 Martin, M.J., Artola, A., Balaguer, M.D., Rigola, M., “Activated carbons developed from surplus sewage sludge for the removal of dyes from dilute aqueous solutions”, Chem. Eng. J., 94, 231-239(2003).
14 Tay, J.H., Chen, X.G., Jeyaseelan, S., Graham, N., “A comparative study of anaerobically digested and undigested sewage sludges in preparation of activated carbons”, Chemosphere, 44, 53-57 (2001).
15 Choy, K.K.H., Barford, J.P., McKay, G., “Production of activated carbon from bamboo scaffolding waste-process design, evaluation and sensitivity analysis”, Chem. Eng. J., 109, 147-165 (2005).
16 Langmuir, I., “The adsorption of gases on plane surfaces of glass,mica and platinum”, J. Am. Chem. Soc., 40, 1361-1403 (1918).
17 Freundlich, H.M.F., “Over the adsorption in solution”, Z. Physik.Chem., 57, 385-471 (1906).
18 Redlich, O., Peterson, D.L., “A useful adsorption isotherm”, J. Phys.Chem., 63, 1024-1026 (1959).
19 Sips, R., “On the structure of a catalyst surface”, J. Chem. Phys., 16,490-495 (1948).
20 Porter, J.F., McKay, G., Choy, K.H., “The prediction of sorption from a binary mixture of acidic dyes using single- and mixed-isotherm variants of the ideal adsorbed solute theory”, Chem. Eng. Sci., 54,5863-5885 (1999).
21 Marquardt, D.W., “An algorithm for least-squares estimation of nonlinear parameters”, J. Soc. Ind. Appl. Math., 11, 431-441 (1963).22 Seidel, A., Gelbin, D., “On applying the ideal adsorbed solution theory to multicomponent adsorption equilibria of dissolved organiccomponents on activated carbon”, Chem. Eng. Sci., 43, 79-89 (1988).
23 Kapoor, A., Yang, R.T., “Correlation of equilibrium adsorption data of condensible vapours on porous adsorbents”, Gas Sep. Purif., 3,187-192 (1989).
24 Ho, Y.S., Porter, J.F., McKay, G., “Equilibrium isotherm studies for the sorption of divalent metal ions onto peat: Copper, nickel and lead single component systems”, Water Air Soil Pollut., 141, 1-33(2002).
25 Wong, Y.C., Szeto, Y.S., Cheung, W.H., McKay, G., “Equilibrium studies for acid dye adsorption onto chitosan”, Langmuir, 19,7888-7894 (2003).
26 Al-Degs, Y., Khraisheh, M.A.M., Allen, S.J., Ahmad, M.N., “Effect of carbon surface chemistry on the removal of reactive dyes from textile effluent”, Water Res., 34, 927-935 (2000).
27 Al-Degs, Y., Khraisheh, M.A.M., Allen, S.J., Ahmad, M.N.A., “Adsorption of remazol reactive black B on different types of activated carbon: Adsorption on H and L carbon”, Adv. Environ. Res., 3,125-138 (1999).
28 Pereira, M.F.R., Soares, S.F., Orfao, J.J.M., Figueiredo, J.L., “Adsorption of dyes on activated carbons: influence of surface chemical groups”, Carbon, 41, 811-821 (2003).
29 Valix, M., Cheung, W.H., McKay, G., “Roles of the textural and surface chemical properties of activated carbon in the adsorption of acid blue dye”, Langmuir, 22, 4574-4582 (2006).
杂志排行

Chinese Journal of Chemical Engineering的其它文章
- Experimental and Modelling Studies of Biomass Pyrolysis*
- Synergistic Multilayer Adsorption for Low Concentration Dyestuffs by Biomass
- Kinetics of Photocatalytic Degradation of Gaseous Organic Compounds on Modified TiO2/AC Composite Photocatalyst*
- 3D Numerical Study on Compound Heat Transfer Enhancement of Converging-diverging Tubes Equipped with Twin Twisted Tapes*
- Techno-economic Analysis of Distributed Hydrogen Production from Natural Gas
- Issues in Freeze Drying of Aqueous Solutions*