Collagen proportionate area of liver tissue determined by digital image analysis in patients with HBV-related decompensated cirrhosis
2011-07-03ShiBinXieChaoMaChaoShuangLinYingZhangJianYunZhuandWeiMinKe
Shi-Bin Xie, Chao Ma, Chao-Shuang Lin, Ying Zhang, Jian-Yun Zhu and Wei-Min Ke
Guangzhou, China
Original Article / Liver
Collagen proportionate area of liver tissue determined by digital image analysis in patients with HBV-related decompensated cirrhosis
Shi-Bin Xie, Chao Ma, Chao-Shuang Lin, Ying Zhang, Jian-Yun Zhu and Wei-Min Ke
Guangzhou, China
BACKGROUND:The accurate assessment of the degree of hepatic fibrosis plays a critical role in guiding the diagnosis, treatment and prognostic assessment of chronic liver diseases. Liver biopsy is currently the most reliable method to evaluate the severity of hepatic fibrosis. However, liver biopsy is an invasive procedure associated with morbidity and mortality, and has several limitations in patients with decompensated cirrhosis. There is no report on the collagen proportionate area (CPA) of liver tissue in the decompensated stage of cirrhosis. This study aimed to determine the CPA of resected liver tissue samples from patients with HBV-related decompensated cirrhosis using digital image analysis, and to analyze the relationship between the CPA and liver functional reserve.
METHODS:Fifty-three resected liver tissue samples from liver transplant patients with chronic hepatitis B-induced decompensated cirrhosis were stained with Masson's trichrome, and the CPA in these samples was quantitatively determined using digital image analysis. The values of relevant liver function just before liver transplantation, the CPA in liver tissue, and their correlation were analyzed.
RESULTS:The mean CPA at the decompensated stage of cirrhosis was 35.93±14.42% (11.24%-63.41%). The correlation coefficients of the CPA with a model for end-stage liver disease score, serum total bilirubin and international standard ratio of prothrombin B were 0.553, 0.519 and 0.533, respectively (P<0.001). With increasing CPA values, the three indices reflecting liver functional reserve also changed significantly.
CONCLUSIONS:The degree of fibrosis may be correlated with the functional reserve. With the advancement of fibrosis, the liver functional reserve is attenuated accordingly.
(Hepatobiliary Pancreat Dis Int 2011; 10: 497-501)
collagen proportionate area; digital image analysis; decompensated cirrhosis; chronic hepatitis B
Introduction
The continuous development of hepatic fibrosis is a common pathological characteristic of all chronic liver diseases. Hepatic fibrosis staging is still the most critical factor determining the prognosis. The accurate assessment of the degree of hepatic fibrosis plays a critical role in guiding the diagnosis, treatment and prognostic assessment of chronic liver diseases.[1,2]
Currently, liver biopsy is still the gold standard for evaluating hepatic fibrosis.[3]The traditional fibrosis staging scores (F0-F4) are mainly based on the distribution of the fibers, no matter whether hepatic lobules are changed or false lobules have been formed;[4-6]neither is fiber thickness or density considered, so it is difficult for the traditional fibrosis staging system to precisely assess the degree of hepatic fibrosis.[7,8]Some diagnostic standards include the thickness and density of fibers, such as Chevallier et al.[9]Computer-aided digital image analysis of histological sections provides objective and quantitative assessment of the extent of fibrosis in liver tissue,[10-12]and it is superior to the traditional methods, especially for assessing mild fibrosis.[13,14]However, as decompensated cirrhosis is often accompanied by complications such as ascites, prolonged clotting time and infections, the risk of liver biopsy is high. The collagen proportionate area (CPA) of liver tissue in decompensated cirrhosis and the correlation coefficient between CPA and liver functional reserve have not been reported.
In this study, a computer-aided image analysis system was used to quantitatively determine the CPA of liver tissue in chronic hepatitis B-related decompensated cirrhosis after liver transplantation. The relationship between the CPA and liver functional reserve was also assessed.
Methods
Resected liver tissue samples
Patients who had undergone liver transplant surgeries in the Third Affiliated Hospital of Sun Yat-Sen University from January 2004 to December 2008 were enrolled in this study. A total of 53 resected liver tissue samples met the inclusion criteria, which were: 1. HBsAgpositive and HBsAb-negative by Abbott/AxSYM testing kits; 2. clinical diagnosis of decompensated cirrhosis; and 3. diagnosis of nodular cirrhosis by pathological examination. The exclusion criteria were: 1. superinfection such as HAV, HCV or HEV; 2. hepatocellular carcinoma, hepatic cysts, hemangioma or other space-occupying lesions of the liver; 3. alcoholic liver disease or non-alcoholic fatty liver disease; 4. autoimmune-related liver disease; 5. drug-induced hepatitis; or 6. pathologically diagnosed severe hepatitis.
The diagnostic criteria for decompensated cirrhosis and severe hepatitis were based on a previous report.[15]All liver donors were deceased and consent from the donors or their relatives was acquired before liver transplantation.
Collection of clinical data
The relevant clinical data before liver transplantation were collected: alanine aminotransferase (ALT), aspartate aminotransferase (AST), total bilirubin (TBIL), serum albumin, ratio of serum albumin and globulin, international normalized ratio (INR) of prothrombin B, HBV-DNA level in serum, model for end-stage liver disease (MELD) scores[16]and Child-Turcotte Pugh (CTP) scores.
Pathological diagnosis from liver tissue
Surgically resected liver tissue samples were handled by standard methods: paraffin embedding, sectioning at 3 μm, hematoxylin-eosin (HE) staining, and Masson's trichrome staining. The pathological diagnoses were made by two experienced pathologists. The diagnostic criteria were based on a previous study.[4]
Determination of CPA
Masson's trichrome staining was performed as reported.[12]Masson staining kits were from Shanghai Yuanye Bio-technological Co., Ltd. Collagen stained blue (Fig. 1). The image acquisition system was composed of a Nikon Eclipse 80i upright microscope, a Nikon Digital Sight DS-U2 camera controller, and NIS Elements BR 2.30 microscope camera image processing software (Nikon Corp., Tokyo, Japan). Image-Pro plus 6.0 software (Media Cybernetics Co., Ltd., Massachusetts, USA) based on the Windows XP operating system was used in the image analysis system. The results were obtained by the same professional personnel under the same defined conditions: the objective magnification was 40×, the light intensity was adjusted to the same level, and three non-overlapping visual fields were chosen randomly. Subsequently, areas of red collagen fibers (Scollagen) and total area (Stotal) in each visual field were measured and recorded (Fig. 2). The images were saved as ".jpg" format files. Image size: 1280×960 pixels, CPA=Scollagen/∑Stotal(∑S: sum of three visual fields in the same sample).
Statistical analysis
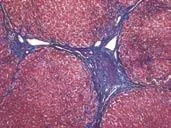
Fig. 1. Masson's trichrome staining, collagen stained blue.
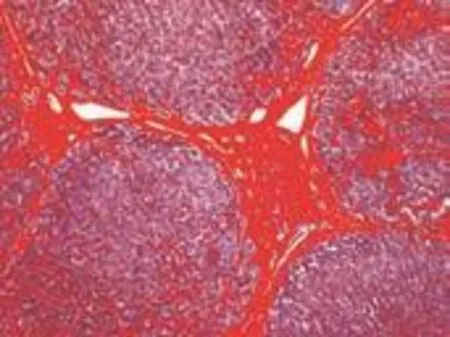
Fig. 2. Areas of red captured by computer-aided image analysis system.
All analyses were made using SPSS 11.5 software (SPSS Inc., Chicago, IL). The quantitative index mean was shown as mean±standard deviation. Student's t testwas used for comparisons between the means of the two groups. The natural logarithmic transformation was applied for variables with heterogeneity of variance or an abnormal distribution, the square-root inverse sine transformation was used for the percentage data, and the tests were conducted after homogeneity of variance. One-way analysis of variance (ANOVA) was used for comparisons among means, and LSD analysis was used for within-group comparisons. Pearson's product-moment correlation coefficient was used for the analysis of correlations and continuous variables, Spearman's rank-order correlation coefficient was used for the analysis of ranked data, Student's t test was used to determine correlation coefficients, and simple linear regression model analysis was used for the analysis of the relevant variables. P<0.05 was considered statistically significant.
Results
Basic condition of included cases
A total of 53 patients (45 male and 8 female) were enrolled in this study. Their ages ranged from 28 to 68 years, mean 50.0±10.1 years. All patients were diagnosed as having nodular cirrhosis. Fourteen patients were HBeAg-positive and 39 HBeAg-negative. The mean HBV-DNA level in serum was 5.06±1.59 log copies/mL (3.00-8.17 log copies/mL). Forty-one patients had ascites, 11 had a history of gastrointestinal tract bleeding, 3 had hepatic encephalopathy, and 11 had a history of splenectomy.
Determination of CPA
The CPA determined by digital imaging in 53 resected liver tissue samples from patients with chronic hepatitis B-related decompensated liver cirrhosis was 35.93±14.42% (11.24%-63.41%).
The CPA of 9 patients was less than 20% with a mean value of 14.85%. The mean INR was 1.66, mean MELD score 14.47, and mean TBIL 37.2 μmol/L (maximum 307.9 μmol/L). These patients had liver transplants due to massive ascites or gastrointestinal tract bleeding. One case underwent a combined liver and kidney transplantation due to renal failure, and one had complicating portal vein thrombosis and cavernous degeneration.
Liver function before liver transplantation and CPA
Liver function values before transplantation are listed in Table 1. In chronic hepatitis B decompensated liver cirrhosis, CPA was correlated with MELD score,serum TBIL and INR. The correlation coefficients (r) were 0.553, 0.519 and 0.533, respectively (P<0.001).
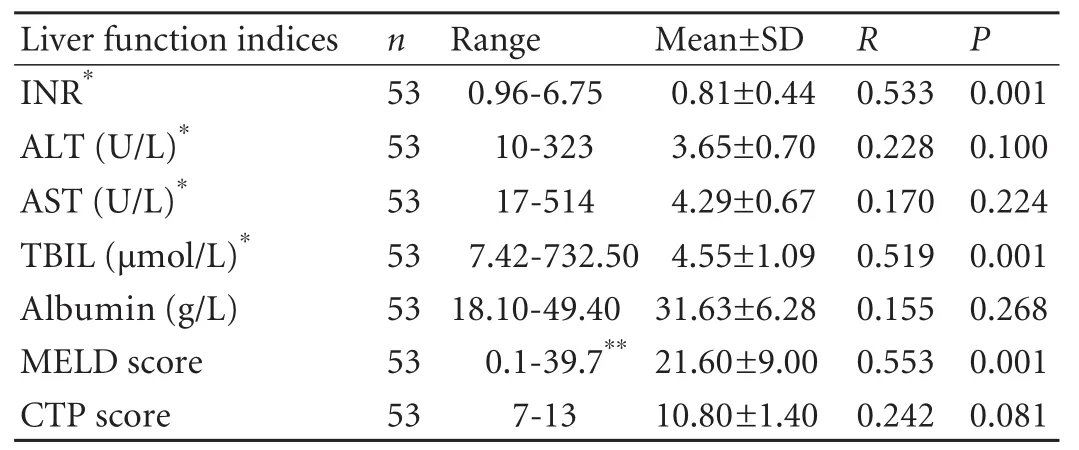
Table 1. Liver function indices before transplantation and correlation with CPA

Table 2. MELD, INR and TBIL values in the different CPA groups (mean±SD)
MELD, INR and TBIL in different CPA groups
The CPA values were classified into three groups as follows: <0.22, 0.22-0.48 and >0.48. The differences among these groups with respect to MELD, INR and TBIL were analyzed. The differences in MELD score, INR, and TBIL levels between the groups were statistically significant (Table 2).
Discussion
Computer-aided digital image analysis of histological sections has been wildly used to assess the extent of fibrosis in liver tissue.[10-12]Standish et al[17]studied patients with chronic hepatitis C whose Ishak scores in liver tissue were from 0 to 6, and found that their liver tissue CPAs were 1.9%, 3.0%, 3.6%, 6.5%, 13.7%, 24.3%and 27.8%, respectively. Calvaruso et al[18]reported that the CPAs in patients with hepatitis C cirrhosis reached 13%-45% when their Ishak score was 6.
As decompensated cirrhosis is often accompanied by complications such as ascites, prolonged clotting time and infections, liver biopsy has been limited. In this study, 53 resected liver tissue samples from patients with HBV-related decompensated liver cirrhosis after liver transplantation were used to quantitatively assess the fibrosis using a computer-aided image analysis system. The CPA was 11.24%-63.41% (35.93±14.42%). The CPA values were higher than those reported previously,[17,18]the highest reaching 63.41%. We[19,20]previously found that the CPA ranges from stages F0-F4 of decompensated cirrhosis in chronic hepatitis B patients were 8.3±2.4%, 8.3±2.9%, 11.4±2.4%, 15.0±5.9%, 20.7±4.4% and 35.93± 14.42%, respectively, indicating an increased hepatic fibrosis with progression of the disease.
In this study, the CPA of liver tissue was as low as 11.24% in some patients. The patients with lower CPAs had mainly macronodular cirrhosis, and liver transplants were performed mainly due to gastrointestinal bleeding. Pathologically, thin fibrous cords were noted in the liver tissue and obvious sinusoidal fibrosis. These patients often had compensated liver function, whereas their portal hypertension was evident, indicating that in addition to the degree of fibrosis, the degree of sinusoidal fibrosis, the size of the regenerative nodules and the thickness and density of fibers are also important factors that affect the degree of fibrosis and portal hypertension. The results indicate that some patients with a lower CPA in liver tissue may die of severe portal hypertension even though their liver functional reserve is still at the compensated stage.
Variables such as the MELD score, serum TBIL, prothrombin time and albumin often reflect the state of liver functional reserve. Since the liver is a parenchymatous organ, the number of hepatocytes decreases with increasing number of fibers and CPA value. The functional reserve is also diminished accordingly. In this study, MELD score, serum TBIL level and INR were closely correlated with CPA and showed significant differences among groups. With the advancement of fibrosis, the three indices also changed significantly, reflecting the reduced number of hepatocytes cells and the attenuation of functional reserve. Two types of scoring systems, the MELD and CTP scores, were used, but only the MELD score showed a correlation with the CPA. The reason may be that the CTP score is susceptible to therapeutic intervention, especially when assessed by albumin and ascites. Moreover, hierarchical discrimination is more subjective than the former, limiting the objective and accurate assessment of the pathogenic condition and weakening the correlation between the CTP score and CPA.
In this study, albumin, ALT and AST were not correlated with the CPA. In patients with decompensated cirrhosis, serum albumin levels are often affected by treatment, for instance, the infusion of albumin or diuretics, resulting in levels that do not reflect the true liver function. ALT and AST reflect liver cell impairment, and they are correlated with the degree of hepatic inflammation.
Funding:This study was supported by a grant from the Technology and Plan of Guangdong Province, China (2009B030801006).
Ethical approval:Not needed.
Contributors:XSB and KWM designed the study. XSB and MC wrote the draft and analyzed the data. All authors contributed to the design and interpretation of the study and to further drafts. XSB is the guarantor.
Competing interest:No benefits in any form have been received or will be received from a commercial party related directly or indirectly to the subject of this article.
1 Das K, Das K, Datta S, Pal S, Hembram JR, Dhali GK, et al. Course of disease and survival after onset of decompensation in hepatitis B virus-related cirrhosis. Liver Int 2010;30:1033-1042.
2 Chu CM, Liaw YF. Hepatitis B virus-related cirrhosis: natural history and treatment. Semin Liver Dis 2006;26:142-152.
3 Mani H, Kleiner DE. Liver biopsy findings in chronic hepatitis B. Hepatology 2009;49:S61-71.
4 Ishak K, Baptista A, Bianchi L, Callea F, De Groote J, Gudat F, et al. Histological grading and staging of chronic hepatitis. J Hepatol 1995;22:696-699.
5 Knodell RG, Ishak KG, Black WC, Chen TS, Craig R, Kaplowitz N, et al. Formulation and application of a numerical scoring system for assessing histological activity in asymptomatic chronic active hepatitis. Hepatology 1981;1: 431-435.
6 Scheuer PJ, Davies SE, Dhillon AP. Histopathological aspects of viral hepatitis. J Viral Hepat 1996;3:277-283.
7 Wright M, Thursz M, Pullen R, Thomas H, Goldin R. Quantitative versus morphological assessment of liver fibrosis: semi-quantitative scores are more robust than digital image fibrosis area estimation. Liver Int 2003;23:28-34.
8 Arima M, Terao H, Kashima K, Arita T, Nasu M, Nishizono A. Regression of liver fibrosis in cases of chronic liver disease type C: quantitative evaluation by using computed image analysis. Intern Med 2004;43:902-910.
9 Chevallier M, Guerret S, Chossegros P, Gerard F, Grimaud JA. A histological semiquantitative scoring system for evaluation of hepatic fibrosis in needle liver biopsy specimens: comparison with morphometric studies. Hepatology 1994;20: 349-355.
10 O'Brien MJ, Keating NM, Elderiny S, Cerda S, Keaveny AP, Afdhal NH, et al. An assessment of digital image analysis tomeasure fibrosis in liver biopsy specimens of patients with chronic hepatitis C. Am J Clin Pathol 2000;114:712-718.
11 Masseroli M, Caballero T, O'Valle F, Del Moral RM, Pérez-Milena A, Del Moral RG. Automatic quantification of liver fibrosis: design and validation of a new image analysis method: comparison with semi-quantitative indexes of fibrosis. J Hepatol 2000;32:453-464.
12 Dahab GM, Kheriza MM, El-Beltagi HM, Fouda AM, El-Din OA. Digital quantification of fibrosis in liver biopsy sections: description of a new method by Photoshop software. J Gastroenterol Hepatol 2004;19:78-85.
13 Caballero T, Pérez-Milena A, Masseroli M, O'Valle F, Salmerón FJ, Del Moral RM, et al. Liver fibrosis assessment with semiquantitative indexes and image analysis quantification in sustained-responder and non-responder interferon-treated patients with chronic hepatitis C. J Hepatol 2001;34:740-747.
14 Lazzarini AL, Levine RA, Ploutz-Snyder RJ, Sanderson SO. Advances in digital quantification technique enhance discrimination between mild and advanced liver fibrosis in chronic hepatitis C. Liver Int 2005;25:1142-1149.
15 Liaw YF, Leung N, Kao JH, Piratvisuth T, Gane E, Han KH, et al. Asian-Pacific consensus statement on the management of chronic hepatitis B: a 2008 update. Hepatol Int 2008;2:263-283.
16 Kamath PS, Wiesner RH, Malinchoc M, Kremers W, Therneau TM, Kosberg CL, et al. A model to predict survival in patients with end-stage liver disease. Hepatology 2001;33: 464-470.
17 Standish RA, Cholongitas E, Dhillon A, Burroughs AK, Dhillon AP. An appraisal of the histopathological assessment of liver fibrosis. Gut 2006;55:569-578.
18 Calvaruso V, Burroughs AK, Standish R, Manousou P, Grillo F, Leandro G, et al. Computer-assisted image analysis of liver collagen: relationship to Ishak scoring and hepatic venous pressure gradient. Hepatology 2009;49:1236-1244.
19 Xie SB, Yao JL, Zheng SS, Yao CL, Zheng RQ. The levels of serum fibrosis marks and morphometric quantitative measurement of hepatic fibrosis. Hepatobiliary Pancreat Dis Int 2002;1:202-206.
20 Ke WM, Xie SB, Yu LN, Liu T, Lai J, He DQ, et al. Decline of serum HBV DNA and no change apportioned by the same hepatic parenchyma cell volume from hepatic fibrosis stage 1 to stage 4 during the natural history of chronic hepatitis B. Intervirology 2008;51:235-240.
Received December 9, 2010
Accepted after revision July 19, 2011
Author Affiliations: Department of Infectious Disease, Third Affiliated Hospital, Sun Yat-Sen University, Guangzhou 510630, China (Xie SB, Ma C, Lin CS, Zhang Y, Zhu JY and Ke WM)
Shi-Bin Xie, MD, Department of Infectious Disease, Third Affiliated Hospital Sun Yat-Sen University, Guangzhou 510630, China (Tel: 86-20-85252183; Fax: 86-20-85252557; Email: xieshibin2002@yahoo. com.cn)
© 2011, Hepatobiliary Pancreat Dis Int. All rights reserved.
10.1016/S1499-3872(11)60084-2
杂志排行

Hepatobiliary & Pancreatic Diseases International的其它文章
- Corticosteroids or non-corticosteroids: a fresh perspective on alcoholic hepatitis treatment
- Protective effect of probiotics on intestinal barrier function in malnourished rats after liver transplantation
- Naproxen-induced liver injury
- Hepatobiliary & Pancreatic Diseases International (HBPD INT)
- Salvianolic acid B modulates the expression of drug-metabolizing enzymes in HepG2 cells
- Evaluation outcomes of donors in living donor liver transplantation: a single-center analysis of 132 donors