EFFECTIVE DETECTION DEPTH OF NEEDLE-LIKE OPTICAL PROBE
2010-10-08LiWeitaoQianZhiyuChenChunxiaoXiaoDi
Li Weitao,Qian Zhiyu,Chen Chunxiao,Xiao Di
(College of Automation Engineering,NUAA,29 Yudao Street,Nanjing,210016,P.R.China)
INTRODUCTION
The near infrared light is used in the measurement of optical parameters of the biological tiss uein recent research[1-2].To improve the sensitivity and the precision,many researchers pay more attention to the design of the optical probe.One direction is to design the complex arrangement of optical fibers[3-4],and the other is to design the needle-like optical probe[5-6].Since the needle-like probe is simple and small,it can be used on many mini-invasive surgeries.The distance of light that can travel into the tissue is so short that the discussion of effective penetration depth is important for the design of the optical fiber arrangement.
Ref.[7]developed optical probe with nine fibers arranged together.One fiber is connected to a light source and others are connected to detectors.The optical probe can get tissue optical properties.Ref.[7]did not discuss the effective penetration depth of the probe.
Ref.[8]designed a double fiber probe with diameters of 100 and 200μm.It studied the detection depth of the probe by the look-ahead distance.The Monte Carlo simulation in Ref.[8]is only used for two-dimensional space.The experiment can only test the simple double fiber probe and do not give the reference of the optical design.
Ref.[9]discussed the effective detection depth by the light distribution in the uniform tissue by the Monte Carlo method.The obvious disadvantage is that the depth only depends on the properties of light and light fibers.The position and the distribution of detectors are not concerned.So the method is limited in practice.
The needle-like optical probe is used in many areas,such as the monitoring of thermal coagulation,the brain trauma,and the guidance in neurosurgery[10-11].All of the work has proved that the needle-like probe can obtain the inner information of the biological tissue.But the most important problem is that they cannot identify the precise position in the brain where properties are changed.
In this paper,a sensitive matrix is used to study the effective detection depth of the need lelike optical probe.The sensitive matrix is related to the distribution of the source and detector optical fibers,and the optical properties of the tissue.So the sensitive matrix can give more in formation and is better than directly using light distribution.The simulation is done in a three-dimensional space.Every slice can be given from three directions.Results of this paper are valuable to design the arrangement of optical fibers.
1 DEFINITION OF SENSITIVE MATRIX
1.1 Diffusion equation
Many researchers have proved that the light transport in the highly scattering biological tissue,where_′s≫_a,obeying the diffusion equation[12].In this paper,the light sourceis a continuous wave and detectors collect the light intensity.So the diffusion equation can be reduced to
- ▽ ˙κ(r)▽O(r)+_a(r)O(r)=q(r)(1)where O(r)is the light fluence rate,κ(r)=[3(_′s+_a)]-1the diffusion coefficient,_a the absorption coefficient,_′s=_s(1-g)the reduced scattering coefficient,g the anisotropy factor,and q(r)the source term.To an isotropic point source[13]

Eq.(2)follows the Neuman boundary conditions.
1.2 Calculation of sensitive matrix
The change in the measurement can be expressed as the product of the sensitive matrix and the change in optical properties.

whereΔx is the matrix of nodal optical property sought;ΔY the matrix of changes in measurement;J the sensitivity matrix and λ~= λF max,where F max is themaximum main diagonal element value of the matrix JTJ;andλthe regularization parameter,which determines the accuracy of the match between the model and data.
The sensitivity matrix J means the highest probability paths of photons between a source and a detector in the diffuse media.The shape of the sensitivity matrix is a banana region.It is clear that the resolution of imaging depends on the width of banana-shaped region.In this paper,J is used to study the depth resolution of the needle-like optical probe.J is related to the position of source fibers and detectors,which can be defined as

where r s,n and r d,n are the source and detector positions for the i th measurement,respectively.
2 EXPERIMENTAL MODEL
A double-fiber model is used.The sketch is shown in Fig.1.The models aredivided into four groups.And the parameters are listed in Table 1.The aim of all the different models is to study the detection depth and the position according to the parameters of optical fibers.If not mentioned especially,_a is 0.1 cm-1and_′s is 10 cm-1.The first group is to study thediameter of source fiber from 50μm to 200μm.The core-to-core distance of the source and the detector is 500μm.The diameter of the detector is 200μm.The second group is to study the diameter of the detector fiber from 50μm to 200μm.The core-to-core distance of the sourceand the detector is 500μm.The diameter of the source fiber is 200μm.The third group is to study thecore-to-coredistanceof the source and detector fibers from 400μm to 1 500μm.Thediameters of the source and detector fibers are all 200μm.The detector with double fibers will be used as the mini-invasiveinstrument,so the fourth group studies the properties of the fiber when it is in the different depths of the tissues from 0 to 3 mm.The core-to-coredistance of thesource and thedetector is 150μm and the fibers are all 200μm.The fifth and sixth groups are to study_a and_′s of the tissues from 0.1 cm-1to 0.3 cm-1and from 10 cm-1to 20 cm-1, respectively. The diameters of the source and detector fibers are 200μm.The coreto-core distance of the source and detector fibers is 400μm.

Table 1 Parameters of simulated models

Fig.1 Sketch of needle-like probe
3 RESULTSAND DISCUSSION
The results are shown in Figs.2-7.The colorbar of all the figures is from-8×10⁻⁴to 0.The depth of the longitudinal axis is 0 cm to 0.6 cm from top to bottom.The transverse axis in Figs.2-7 is from-0.3 cm to 0.3 cm as position from left to right.
3.1 Different diameters of source and detector f iber
Figs.2,3 show the sensitivity matrices of the different diameters of source fiber and detector fiber, respectively. Group 1 is simulated in Fig.2.From Fig.2,it can befound that when the source diameter is smaller than the detector diameter,the exploration depth is deeper.The same rule to Group 2 is shown in Fig.3.

Fig.2 Sensitivity matrix according to different diameters of source fiber

Fig.3 Sensitivity matrix according to different diameters of detector fiber
3.2 Dif ferent core-to-core distances
If the diffusion equation can be used to approximately simulate the light transportation in tissue,the core-to-core distance must be more than 400μm.So Group 3 is simulated in Fig.4.From Fig.4,it is obvious that thedepth is deeper and deeper with the changes of core-to-core distance from 400μm to 1.5 mm.The effective region of the sensitivity matrix is also larger and larger.

Fig.4 Sensitivity matrix according to core-to-core distance of source and detector fibers
3.3 Dif ferent depths of fibers
When the optical fibers are used in reality,it will be punctured into the biological tissue.So it is important to study the influence on thedepth of optical fiber.Group 4 is simulated in Fig.5.From Fig.5,we can find that the detective depth is not influenced by the position of optical fiber.
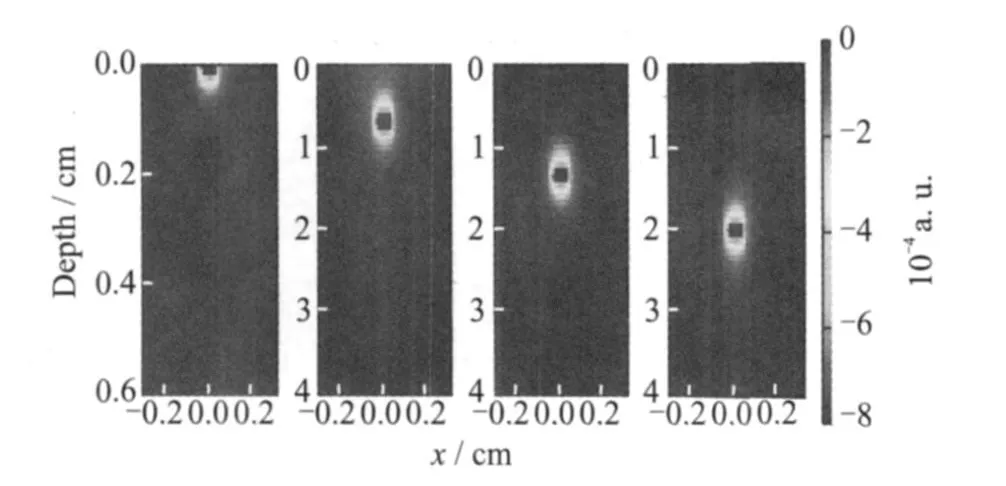
Fig.5 Sensitivity matrix according to different depths of fibers
3.4 Diff erent optical parameters
In the tissue with different optical parameters,the light transport in different depth.So it is necessary to study the influence of optical parameters.Groups 5,6 are simulated in Fig.6 and Fig.7,respectively.If the value of_a is larger,the depth of penetration is smaller.If thevalue of_s′is larger,the depth of the penetration is larger.

Fig.6 Sensitivity matrix according to different valuesof_a

Fig.7 Sensitivity matrix according to different valuesof_′s
4 CONCLUSION
In this paper,the parameters,which influence the depth of optical fiber,are discussed.The results are important for the design of optical fiber.If we want to make the depth of optical fiber larger,we can design a larger diameter of source and detector fibers and a larger core-tocore distance.
If the optical fiber is in thehomogeneous tissue,the depth of optical fibers is constant.If_aof the tissue is larger andof the tissue is smaller,the depth of the optical fiber will be smaller.
This paper only addresses the influence of the diameter of thesource and the detector optical fiber,the position of optical fibers inside the tissue,core-to-core distance,and theoptical parameters of the homogenous tissue.But in fact,the tissueis always inhomogenous,so the multi-layer model must be built in the simulation.The arrangement of the optical fiber is composed of one source and one detector.If we want to obtain more information about the tissue,the more optical fibers can be used.Therefore,the method can be used to study the spatial resolution and the depth of multi-fibers.
[1] Cao N,Nehorai A.Tumor localization using diffuse optical tomography and linearly constrained minimum variance beamforming[J].Optics Express,2007,15(3):896-909.
[2] Selb J,Dale A M,Boas D A.Linear 3D reconstruction of time-domain diffuse optical imaging differential data:improved depth localization and lateral resolution[J].Optics Express,2007,15(2):16400-16412.
[3] Zhao Qing,Ji Lijun,Jiang Tianzi.Improving depth resolution of diffuse optical tomography with a layerbased sigmoid adjustment method[J].Optics Express,2007,15(7):4018-4029.
[4] Boas D A,Chen K,Grebert D,et al.Improving the diffuse optical imaging spatial resolution of the cerebral hemodynamic response to brain activation in humans[J].Optics Letters,2004,29(13):1506-1508.
[5] Stepp H,Beck T,Beyer W,et al.Measurement of fluorophore concentration in scattering media by one single optical fiber[C]//Proc of SPIE,San Diego,California,USA: [s.n.].2006,6139:61390S1-5.
[6] Reif R,Amorosino M S,Calabro K W,et al.Analysis of changes in reflectance measurements on biological tissues subjected to different probe pressures[J]. Journal of Biomedical Optics,2008,13(1),010502-1-3.
[7] Zhang Wei,Gong Hui,Li Pengcheng,et al.Determination of tissue optical properties in a small source-detector separation[J].ACTA Laser Biology Sinica,2003,12(3):201-205.(in Chinese)
[8] Qian Zhiyu,Victor SS,Gu Yueqing,et al.Look-ahead distance of a fiber probe used to assist neurosurgery:phantom and Monte Carlo study[J].Optics Express,2003,11(16):1844-1855.
[9] Dai Lijuan.Research on real time,in vivo,minimal invasive measurement of brain tissues′parameters by near infrared spectroscopy and its application[D].Nanjing:Nanjing University of Aeronautics and Astronautics,2008.(in Chinese)
[10]Ozawa N,Muragaki Y,Shirakawa H,et al.Navigation system based on intraoperative diffusion weighted imaging using open MRI[J].International Congress Series,2005,1281:810-814.
[11]Archip N,Clatz O,Whalen S,et al.Non-rigid alignment of pre-operative M RI,f MRI,and DTMRI with intra-operative MRI for enhanced visualization and navigation in image-guided neurosurgery[J].Neuro Image.2007,35(2):609-624.
[12]Boas D A,Culver JP,Stott JJ,et al.Threedimensional Monte Carlo code for photon migration through complex heterogeneous media including the adult human head[J].Optics Express,2002,10(3):159-170.
[13]Boas D A,Dale A M,Franceschini M A.Diffuse optical imaging of brain activation approaches to optimizing image sensitivity,resolution,and accuracy[J].Neuro Image,2004,23(Suppl):275-288.
杂志排行

Transactions of Nanjing University of Aeronautics and Astronautics的其它文章
- FITTING CORRECTION METHOD OF RING ARTIFACTS FOR RECONSTRUCTING CONE-BEAM CT IMAGES
- IMAGING CHARACTERISTICSOF RAT MODELSOF PARKINSON DISEASE
- MOTOR CORTEX NETWORKSIN STROKE PATIENTS DURING RECOVERY WITH f MRI
- FLUORESCENCE SPECTRUM ANALYSISOF ETHER-WATER SOLUTION BASED ON GAUSSIAN DECOMPOSITION METHOD
- PREPARATION AND CHARACTERIZATION OF WATERSOLUBLE NEAR-INFRARED EMITTING PbSQUANTUM DOTS
- HYBRID MULTI-OBJECTIVE GRADIENT ALGORITHM FOR INVERSE PLANNING OF IMRT