IMAGING CHARACTERISTICSOF RAT MODELSOF PARKINSON DISEASE
2010-10-08HuGuangxiaQianZhiyuSunTaoYangTianmingWangWenhongXieJieru
Hu Guangxia,Qian Zhiyu,Sun Tao,Yang Tianming,Wang Wenhong,Xie Jieru
(1.College of Automation Engineering,NUAA,29 Yudao Street,Nanjing,210016,P.R.China;2.Zhongda Hospital,Southeast University,Nanjing,210009,P.R.China)
INTRODUCTION
Parkinson disease(PD)is a common neurodegenerative disease(the substantia nigra and substantia nigra-striatal pathway degeneration induced extrapyramidal disease),which is common and frequently-occurring among elderly people,and seriously endangers human health.Currently,the diagnosis of PD is mainly through symptoms and signs.However,it is subjectiveand can result in a certain degree of the misdiagnosis due to individual differences in patient clinical manifestations and clinician level of experience.Moreover,once patients have obvious signs and symptoms,thedisease tends to bemore severeactually and treatments show less efficacy.So,it is particularly urgent to find an early and objective diagnosis technology for PD[1]. In recent years,with the rapid development of new diagnosis technologies,particularly the progress of morphology and function imaging technologies such as magnetic resonance imaging(MRI)and computed tomography(CT),parameters,such as the regional brain morphology,cerebral blood flow(CBF),cerebral blood dissolved,and glucose metabolism can be obtained in non-invasive.A breakthrough is expected for the early diagnosis of PD[2-4].
Imaging technologies are utilized for the systematic study on the brain morphology and function changes of PD rat models.Firstly,rat models are established.Then,rat brains of the three groups are examined on MRIand magnetic resonahce angiography(MRA)to observe if there are morphology and anatomy changes.Finally,proton magnetic resonance spectroscopy(1H-MRS)and CT perfusion(CTP)are used to observe bilateral striatal energy metabolisms,biochemical changes,quantitative analysis of specific compounds,CBF,and cerebral blood volume(CBV)of three groups of rats,thus providing research bases for the diagnosis of PD[2-4].
1 METHOD
1.1 Establishment of PD rat models
Three-month-old 210—240 g sprague dawley(SD)rats[5]are selected and divided into three groups:the model group(n=40),the sham-operated group(n=20)and the normal group(n=20).Rats of the model group are singlepoint injected with 5 μL 5 μg/μL 6-hydroxydopamine(6-OHDA)containing 0.2% ascorbic acid salineon the right substantia nigra pars compacta(SNc)to be mold.Rats of thesham-operated group are injected with 5μL saline containing 0.2% ascorbic acid[6]. Intraperitoneal injection with apomorphine(APO)(0.5 mg/kg)is adopted to check the molding results of PD rat models.If the rat turns to the left side constantly and the rotating turns in 30 min are larger than 210 laps,it is regarded as a successful PD rat model[7].Then,male and female rats of the three groups are bred in different cages.After three months,the molding results are verified again with the same method.Subsequently,rats are examined with MRI,MRA,1H-MRS,CTP,light microscope,and electron microscope.
1.2 Imaging examinations
Firstly,after some rats from each of the three groups are anesthetized,7.0 T Biospec small animal M RIfrom Germany Bruker company is used to do coronal and sagittal T1WI,T2WI scans and MRA examinations of rat brains.Then,bilateral striatal1H-MRSexaminations are done to obtain spectral images,such as N-acetyl aspartate(NAA),choline compounds(Cho),and creatine(Cr)signals.After that,NAA/Cr and Cho/Cr ratios(compared with theintegration area)are calculated.Next,somatom sensation 64-slice CT from SIEM ENSis used to do bilateral striatal perfusion scans with iohexol (350 mg/m L)as th e contrast agent,which is injected at the same time with scanning.Finally,480consecutive axial images of rat brains are obtained and then dealt with to obtain the pseudo-color pictures and the specific quantitative values of CBFand CBV.
2 RESULTSAND ANALYSES
2.1 Results of MRI and MRA examinations
T2-weighted images of the model and shamoperated groups of rats show the striatum and other parts of the brain have no significant changes except that the puncture area leaves a low signal needle road and the skull of the puncture site appears circular high signal defect area(see Fig.1).The puncture road of the success PD rat model is exactly located in the substantia nigra.The low signal needle road is vertical to the rat brain in both sagittal and coronal planes.Moreover,the ending point of the needleis exactly located in SNc.The needle road of the failure PD rat model is deviated from SNc,skewing forward or backward in the sagittal plane and skewing inside or outside in the coronary plane(see Fig.2).MRA shows that the vascular structures of all rat brains are normal without the difference between left and right sides(see Fig.3).

Fig.1 MRI of striatum of model and sham-operated rats
2.2 Results of 1H-MRSand CTP examinations
1H-MRSand CTP are used to detect the bilateral striatum of three group rats.Fig.4 shows the1H-MRSspectra,where Fig.4(a)is the location map for the striatum;and Figs.4(b-e)show the spectra of the normal rat,the left and right sides of the sham-operated rat,the non-injected(left)side of the model rat,respectively.All of them reveal that the NAA peak is significantly higher than the Cr peak.Fig.4(f)shows the spectrum of the injected(right)side,revealing that NAA and Cr peaks are basically in the same level.Fig.5 shows the CTP pseudo-color pictures.Figs.5(a,b)show the CBF,CBV maps of the striatum of the model group rat,which indicate that the color of the injected side(arrow points)is darker than the non-injected side.It represents that the blood flow and the blood volume of the injected side are lower than those of the non-injected side.Figs.5(c-d)show the CBF and CBV maps of the striatum of sham-operated and normal rats with symmetry colors,respectively.It shows that thereis no blood flow abnormalities.

Fig.2 Results of M RIin coronal,sagittal and horizontal planes
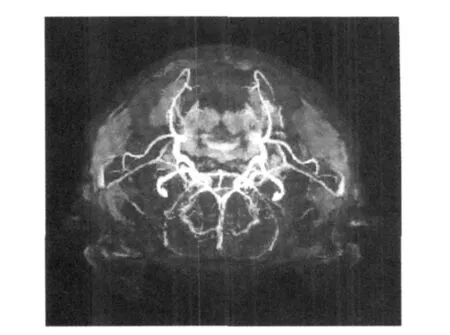
Fig.3 MRA of model,sham-operated and normal rats
Through the test,specific quantitative data of1H-MRS and CTP examinations accord with the normal distribution and the multi-group mean variance analysis are adopted,as shown in Table 1.The NAA/Cr ratio of injected(right)
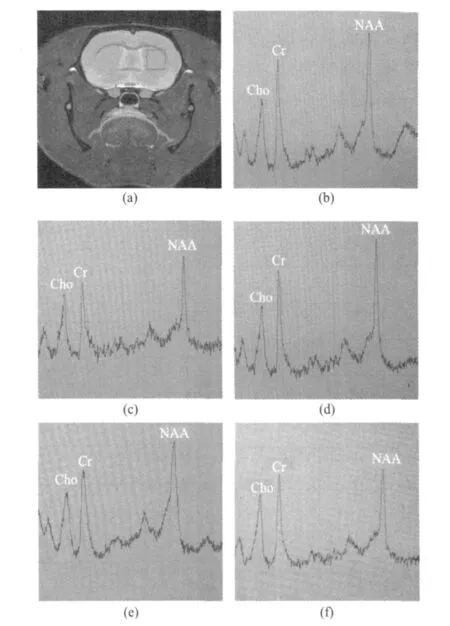
Fig.4 1 H-MRSspectra
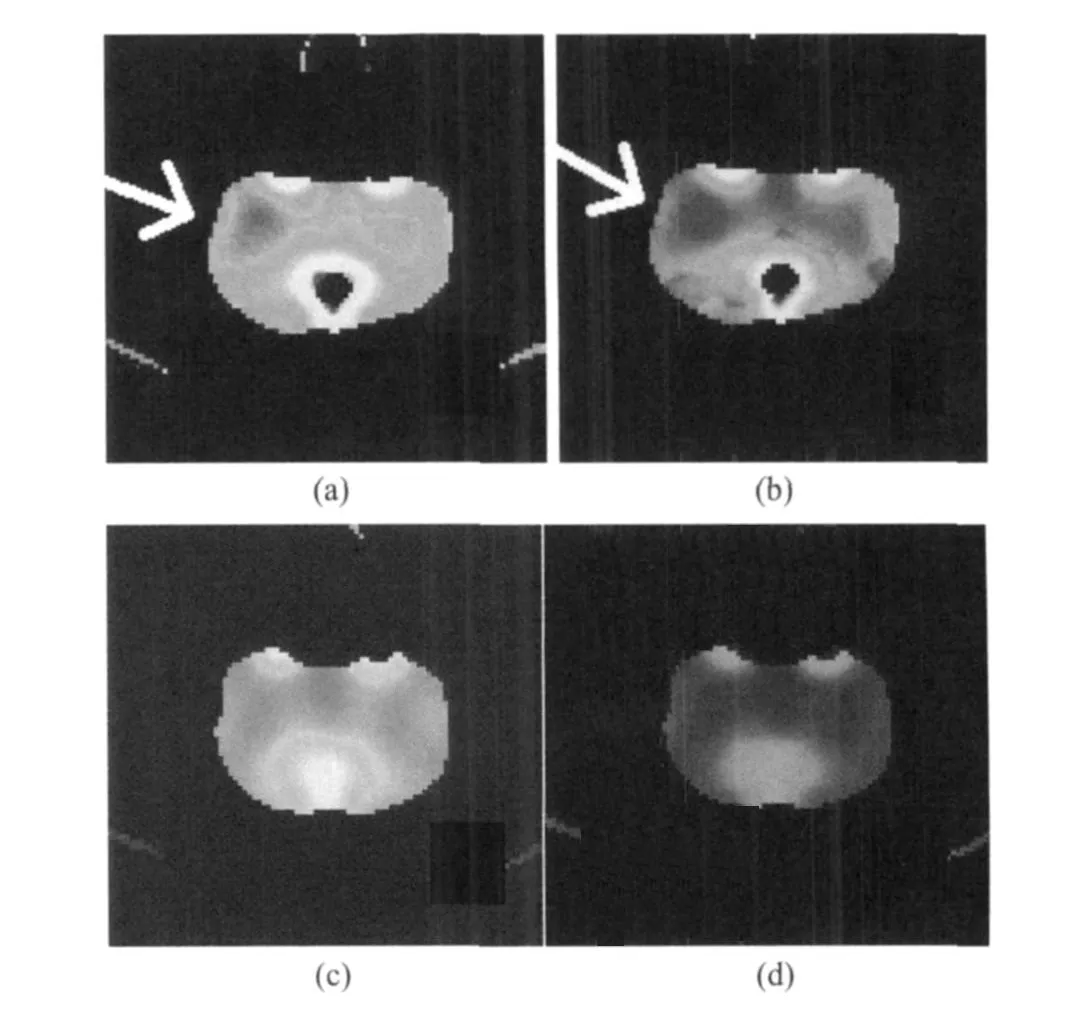
Fig.5 CTP pseudo-color pictures
side of the model rat is significantly lower than that of the left side,bilateral sides of sham-operated and normal rats(P<0.01).Thereis no significant statistical difference of the NAA/Cr ratio among the left side of the model rat,bilateral sides of sham-operated and normal rats(P>0.05).For the Cho/Cr ratio,there is also no significant statistical difference among three groups of rats(P>0.05).CBF and CBV of the injected(right)side of the model rat are considerably lower than those of the left side,bilateral sides of sham-operated and normal rats(P<0.05).No significant statistical difference exists among the left side of the model rat and the bilateral sides of sham-operated and normal rats(P>0.05).

Table 1 Statistical data of 1 H-MRSand CTPof model,sham-operated and normal rats
3 DISCUSSION
The 7.0 T small animal M RIused in this paper can clearly demonstrate the fine structure of the rat brain.MRI shows that there is no abnormal change for the structureof striatum and other tissues of the model and sham-operated rat brains.MRA shows that the structure of brain blood vessels is symmetrical and normal.All of these mean that the PD rat brain has no significant anatomy change compared with the normal rat,and lacks the characteristic performance in morphological imaging.MRI also clearly shows that the puncture needle road of the success PD rat model is perpendicular to the rat brain in both sagittal and coronal planes.And the end point of the puncture needle is exactly stopped at SNc,while the needle road of the failed rat model deviates from SNc.The rat brain is relatively small.Therefore,the slight offset can lead to an inaccurate puncture location and result in a failure mold.
The striatum is selected to carry out the1H-MRS examination.It is mainly because that the substantia nigra is narrow while the striatum is relatively large.As a result,it is easy to position and improve the test accuracy.Besides,SNc is selected as the injection location.It can avoid the damage of the striatum and insure the test accuracy.Results show that the NAA/Cr ratio of the injected(right)side of the PD rat model is significantly lower than the left side,bilateral sides of sham-operated and normal rats.As to the Cho/Cr ratio,there is no significant statistical difference among all of rats.NAA is recognized as a reflection of number and function of neurons[8].The NAA reduction reflects damage and loss of neurons or axonal as well as dysfunction to a certain extent[9].Although the loss of neurons is positively correlated with the age,rats in the test are bred under the same conditionin the same period,which can exclude the age factor that results in the NAA/Cr ratio reduction.It indicates that theinjected side of striatum of the model rat exists damage and loss of neurons and axonal,providing the diagnostic basis for the neuron dysfunction of PD[10-12]. The Cho/Cr ratio of the striatum of the PD rat model does not change,which may be due to none or little proliferation of glial cells,or else,the proliferation cell having tendency to balance for the long duration of rats.1H-M RSdirectly reflects the metabolism changes of nerve cells,and indirectly confirms the pathological changes of organizations, i.e., the changes of neurons,synapses and glial cells.
Currently,the study of CBF of PD patients is mainly carried out by positron emission tomography(PET)and single photon emission tomography(SPECT),but it is difficult to popularize because of its expense,technical complexity and other reasons.CT brings unprecedented opportunities to study PDwith the merits of convenience,economy,high time and space resolution,etc.The 64-slice spiral CT used in this paper can scan all brain tissues of rat and its spatial and temporal resolution are both meet the requirements of CTP.Results show that both regional CBF and regional CBV of the injected(right)side of the model rat are slightly lower than its left side,and its bilateral sides of sham-operated and normal rats.There is no significant statistical difference for theblood flow among the left side of the model rat,and the bilateral sides of sham-operated and normal rats.The results agree well with the reported CBFchanges of PD patients and animals on PET and SPECT[13-15].
4 CONCLUSION
Imaging technologies are utilized in this paper to study the imaging characteristics of PD rats.PD rats have no characteristic abnormalities in morphological imaging(MRI,MRA),but striatal regional CBF reduction and spectroscopy changes in functional imaging(CTP,1H-MRS).MRI,MRA,CTP,1H-MRSand other methods can give valuable information for the changes of morphology,metabolism and the pathology of PD rat brains and provide reliable imaging bases for the diagnosis of PD rats.
[1] Chen Shengdi,Le Weidong,Chen Xianwen,et al.Parkinson disease [M].Beijing: People′s Health Publishing House,2006.(in Chinese)
[2] Kumar R A,Khandelwal N,Sodhi K S,et al.Comparison between contrast-enhanced magnetic resonance imaging and technetium 99m glucohepatonic acid single photon emission computed tomography with histopathologic correlation in gliomas[J].J Comput Assist Tomogr,2006,30(5):723-733.
[3] Meng L,Sarah O,Glyn J,et al.Perfusion magnetic resonanceimaging predicts patient outcomeas an adjunct to histopathology:a second reference standard in the surgical and nonsurgical treatment of lowgrade gliomas[J].Neruosurgery,2006,58(6):1099-1107.
[4] Miles K A.Measurement of tissue perfusion by dynamic computed tomography[J].Br JRadial,1991,64(2):409-412.
[5] Bao Xinmin,Shu Siyun.The rat brain in stereotaxic coordinates[M].Beijing:People′s Health Publishing House,1991.(in Chinese)
[6] Betarbet R,Sherer T B,Greenamyre J T.Animal models of Parkinson′s disease[J].Bioessays,2002,24(4):308-318.
[7] Zhang Yaofen,Duan Deyi,Xu Qunyuan.Preparation and behavior of the 6-OHDA-lesioned rat model of Parkinson′s disease[J].Progress of Anatomical Sciences,2005,11(1):49-53.(in Chinese)
[8] Langston JW,Wuik M,Petzinger G,et al.Investigating levodopar induce dyskinesias in the Parkinsonian primate[J].Ann Neurol,2000,47(1):79-89.
[9] Podell M,Hadjiconstantinou M,Smith M A,et al.Proton magnetic resonace imaging and spectroscopy identify metabolic changes in the striatum in the M PTP feline model of Parkinsonism[J].Exp Neurol,2003,179(2):159-166.
[10]Zheng X N,Zhu X C,Ruan L X,et al.MRSstudy on lentiform nucleus inidiopathic Parkinson′s disease with unilateral symptoms[J].Zhejiang Univ Sci,2004,5(2):246-250.
[11]Rango M,Canesi M,Ghione I,et al.Parkinson′s disease,chronic hydrocarbon exposure and striatal neuronal damage:a1H-M RS study[J].Neurotoxicology,2006,27(2):164-168.
[12]Boska M D,Lewis T B,Destache C J,et al.Quantitative1H magnetic resonance spectroscopic imaging determines therapeutic immunization efficacy in an animal model of Parkinson′s disease[J].Neurosci,2005,25(7):1691-1700.
[13]Brownell A L,Canales K,Chen Y I,et al.Mapping of brain function after MPTPinduced neurotoxicity in a primate Parkinson′s disease model[J].Neuro Image,2003,20(2):1064-1075.
[14]Van Laere K,Santens P,Bosman T,et al.Statistical parametric mapping of(99m)Tc-ECD SPECT in idiopathic Parkinson′s disease and multiplesystem atrophy with predominant Parkinsonian features:correlation with clinical parameters[J].J Nucl M ed,2004,45(6):933-942.
[15]Cilia R,Marotta G,Landi A,et al.Cerebral activity modulation by extradural motor cortex stimulation in Parkinson′s disease:a perfusion SPECT study[J].Eur JNeurol,2008,15(1):22-28.
杂志排行

Transactions of Nanjing University of Aeronautics and Astronautics的其它文章
- FITTING CORRECTION METHOD OF RING ARTIFACTS FOR RECONSTRUCTING CONE-BEAM CT IMAGES
- MOTOR CORTEX NETWORKSIN STROKE PATIENTS DURING RECOVERY WITH f MRI
- FLUORESCENCE SPECTRUM ANALYSISOF ETHER-WATER SOLUTION BASED ON GAUSSIAN DECOMPOSITION METHOD
- EFFECTIVE DETECTION DEPTH OF NEEDLE-LIKE OPTICAL PROBE
- PREPARATION AND CHARACTERIZATION OF WATERSOLUBLE NEAR-INFRARED EMITTING PbSQUANTUM DOTS
- HYBRID MULTI-OBJECTIVE GRADIENT ALGORITHM FOR INVERSE PLANNING OF IMRT