MOTOR CORTEX NETWORKSIN STROKE PATIENTS DURING RECOVERY WITH f MRI
2010-10-08HaoDongmeiQinWenYuChunshuiDongHuiqingLiuNan
Hao Dongmei,Qin Wen,Yu Chunshui,Dong Huiqing,Liu Nan
(1.College of Life Science and Bioengineering,Beijing University of Technology,Beijing,100124,P.R.China;2.Xuan Wu Hospital,Capital Medical University,Beijing,100053,P.R.China)
INTRODUCTION
Stroke is theleading causeof motor disability and handicap in adults.Following the stroke,the disturbed motor control results in subsequent movement disorders[1].Despite of the function loss after the stroke,most patients demonstrate partial functional recovery over time,which is associated with anatomical and physiological alternations of neuronal networks in the brain[2].The adult brain can reorganize to accommodate internal and external environmental modifications and to compensate for the lost function,i.e.,a process known as the plasticity[3-4].To understand the recovery after stroke in humans,a great number of functional imaging studies are conducted using the positron emission tomography(PET)and the functional magnetic resonance imaging(f MRI).The brain consists of the networks of highly interconnected regions,which coordinates the major aspects of behavior.fMRIis successfully used to investigate the integration by analyzing networks of the voxel-cluster exhibition correlated behavior.In neuro-imaging,the functional connectivity is defined as the temporal correlation between remote neurophysiological events[5-6].In general,a greater activation of the motor-related brain regions is reported during stroke-affected(hemiparetic)upper extremity motor tasks,compared with healthy subjects.Also,an increased recruitment of the non-motor areas is consistently shown.A task-related recruitment is often reported in both ipsilesional and contralesional hemispheres.However,studies using theindividual analysis of the topography of recruited brain areas yield rather inconsistent results[7].Theimportance of the recruitment of additional(nonmotor)brain areas on performance of motor tasks remains unclear.A better understanding of the neurobiological processes during the recovery is important for improving the rehabilitative therapy.
Some computational approaches,such as covariance structural equation modeling(SEM),aim at inferring causal relations between brain areas from their pattern of covariance,by extracting the networks of the effective connectivity[8].Dynamic causal modeling(DCM)characterizes the dynamics of interactions among the states of brain regions with the bilinear approximations of intrinsic coupling among neuronal states and the influence of external inputs[9].Granger causality mapping(GCM)extends the vector autoregressive(VAR)technique to capture interactions among brain regions,assuming a causal and dynamic system of linear interactions driven by stochastic innovations[10]. A graphical approach linking the notions of graphical models and the Granger causality is used to describe dynamic dependencies in neural systems[11].Several principled approaches,such as the non-metric multidimensional scaling,the hierarchical analysis and the cluster analysis areused to derive the numerical descriptions of the organization of the network from neuroanatomical connection data.Using basic and general concepts from theinformation theory,entropy and mutual information,a theoretical measure is developed,which captures the interplay of the functional segregation and theintegration in a given system[12].A close look at the anatomical and functional organization of the cerebral cortex provides important clues for formulating a potential general mechanism of the neural integration[13-14].
In this paper,the activation of motor-related regions is investigated during left and right handgrip tasks in the second,fourth,eighth,and sixteenth weeks after stroke.A method is proposed to extract the motor cortex networks(MCNs)revealed by functional magnetic resonance imaging(f MRI).Then,the networks are analyzed in the context of the current understanding of complex networks to find their variation rule during the recovery.
1 MATERIALSAND METHODS
1.1 Patients
Five patients(two males and th ree females)aged 39—62 years are recruited from the Department of Neurology in Xuan Wu Hospital,Capital Medical University.All of them have impairment on their left hemisphere.The informed written consent is obtained.All patients are right-handed based on the handedness classification criterion for Chinese.And none of them is reported for a history of any neurological or psychiatric diseases.
1.2 Experimental design
Previous studies use finger tapping as their motor task to exclude patients who have not recovered finger movements.However,theisometric dynamic handgrip is well suitable to study previously paretic patients,and thosewith the recovery less than completeones,because the ability to perform handgrip returns relatively early compared with finger movements.Thus,using the handgrip,patients with poor recovery are able to perform the task.The neural correlations of the handgrip are studied in detail using f MRI.It is hypothesized that by using the task,a large number of motor-related regions can be activated,thus being possible to examinedifferent effects on recovery[5].
The block design of f MRI is obtained with 20 s handgrip and 20 s rest,alternately.Theeach movement and rest repeat five times.Handgrip task is self-paced and firstly performed with the contralesional hand and then repeated by the ipsilesional hand.The motor performance is evaluated by the motion function Fugl-Meyer assessment and the National Institutes of Health Stroke Scale(NIHSS)prior to the magnetic resonance imaging(MRI)scan.MRI scans are carried out on five patients in the second,fourth,eigh th,and sixteenth weeks after the stroke.
1.3 Recording procedure
Data are acquired using a 3 T Siemens scanner.Changes in the cortical activity of the brain are determined by the measurement of changes in the local blood oxygenation(BOLD effect)using echo planar imaging(EPI)collected with the echo time TE=30 ms,the repetition time TR=2 000 ms,the flip angle FA=90°,the field of view FOV=24 cm× 24 cm,and the matrix 64×64.Thirty axial 4 mm thick slices provid the coverage of the entire brain volume(thevoxel size is 3.75 mm× 3.75 mm× 7.5 mm).Prior to the functional imaging,high resolution three-dimensional(3-D)spoiled gradient-recalled anatomic images at steady-state are collected with TE=2.13 ms,TR=1 600 ms,FA=9°,the matrix 256×224,and the slice thickness 1 mm.These images serve as a high resolution underlay on which the functional information is super-imposed.
1.4 Data processing
f MRIdata are analyzed using SPM5 from the Welcome Department of Cognitive Neurology,London,UK and Matlab 7.0 for each patient.EPIs are realigned to the first functional image of each time series to remove the residual head movement.The functional images of each subject are coregistered with the mean functional image from the realignment,normalized to Montreal Neurological Institute(MNI)standard space and spatially smoothed using a Gaussian filter of 6 mm full width at half maximum(FWHM).The first level analysis of each individual is conducted;one-tailed student′s t-tests are used to identify the most responsive brain regions for the handgrip.To correct multiple comparisons across the brain volume,an extension threshold is introduced at the cluster level(p<0.05,20 extent threshold voxels).For the anatomical localization of regions with the significant hemodynamic activation,fMRI maps are super-imposed on the surface-rendered and transverse sections of structural MR image templates averaged across 152 subjects provided by statistical parametric mapping(SPM).The maximum intensity projection of the statistical map and coordinates in the MNI space for each maximum are obtained on the smoothed and normalized functional images.
1.5 Motor cortex network
1.5.1 Motor cortex network extraction
The maximum intensity voxels in activation areas are defined as the vertexes of one MCN.The activity of voxel x at time t is denoted as V(x,t)after the f MRIpre-processing.The linear correlation coefficient between any pair of voxels x 1 and x 2 is calculated by

where〈◦ 〉 represents the temporal averages.The correlation coefficient is used as the connection strength or the weight between two nodes.Therefore,MCN is constructed with motor activation regions as vertexes and their correlation coefficients as linking weights.
1.5.2 Characteristics of motor cortex network
Structural characteristics are captured using concepts and measures provided by the graph theory.All structural analyses are performed on the connection matrix of networks,which provids a complete description of all connections and pathways between the network individual units.Functional connectivity,which is the temporal correlation between remote neurophysiological events,can be reflected by theinformation theory[12].
(1)Density
The density is defined as the sum of ties divided by the number of possible ties,i.e.,theratio of all tie strength actually presented to the number of possibleties.The density of a network can help physicians gain an insight into the speed of information diffusion among nodes,and the extent to which nodes have high levels of communicating capital and/or communicating constraint.
(2)Graph diameter
集团企业规模化扩张、所管控业务领域复杂化、地域广泛化、层次多极化等,均导致内部审计工作的执行力成为当前急需解决的问题,并将内部审计提上日程。就内部审计而言,其主要是指审计部门组织专业人员对企业内部控制制度的健全性、合规性、有效性、效益性等予以审查和监督,并予以工作评价。为提高内部审计工作的执行力,本文分析并阐述了企业内部审计制度的内容及评价原则,并提出了创新企业内部控制中内部审计的方法。
The global maximum of the shortest path linking two vertices is called the diameter of the graph D.It is equivalent to the maximum number of steps needed from one vertex to another.
(3)Characteristic path length
The characteristic path length L is theglobal mean of the lengths of the shortest path linking any pairs of nodes.And it can be used to describe the connectivity of a network.
(4)System entropy
The cerebral cortex networks areimplemented as a dynamical system.The neural activities can be described as a Gaussian multi-dimensional stationary stochastic process.The network units interact with each other and deviate from the statistical independence through connections. The system entropy H(X)measures the overall degree of the independence of a system.Assuming the stationarity,the entropy of a system X composed of n units is computed by

where|◦|indicates the matrix determinant.COV is the covariance matrix of the system analytically obtained from theconnection matrix.
(5)Integration

(6)Complexity
Thecomplexity C(X)expresses theextent to which a system X is both functionally segregated(small subsets of the system tend to behave independently)and functionally integrated(large subsets tend to behave coherently).It expresses a portion of the system entropy that is accounted for by the interactions among its elements.The measureis computed as

where H(xi|X-xi)is the conditional entropy of each element when given the entropy of the rest of the system.
2 TEST RESULTS
MRI scans are carried out on five patients in the second,fourth,eighth,and sixteenth weeks after the stroke.Fig.1 shows the activations of ipsilesional and contralesional hemispheres during left and right handgrip tests along four measurement sessions for patient No.1.

Fig.1 Ipsilesional and contralesional hemisphere activations of patient No.1
With Talairach Client 2.4 from the Research Imaging Center,University of Texas Health Science Center at San Antonio,the locational description of active areas for the same patient is obtained,as shown in Table 1.It is obvious that the handgrip task activates the contralateral primary motor area(M1,BA4),the supplementary motor area(SMA,BA6)as well as the ipsilateral cerebellum anterior,and posterior lobe and the primary motor area(M 1,BA4).
The structural(density,graph diameter,and characteristic path length)and functional(entropy,integration,and complexity)characteristic parameters of MCN are calculated for patient No.1 during left and right handgrip tests in the second,fourth,eighth,and sixteenth weeks after the stroke and all parameters are displayed in Fig.2.It indicates that for the left handgrip,the density decreases from the second to the eighth week and increases in the sixteenth week,whereas the graph diameter and the characteristic path length contrarily vary.The entropy,the integration and the complexity increase from the second to sixteenth week.For the right handgrip,the density has a high value in the fourth week and a low value in the eighth week,but the graph diameter and the characteristic path length are on the contrary.The entropy and theintegration increase from the fourth week to the sixteenth week.
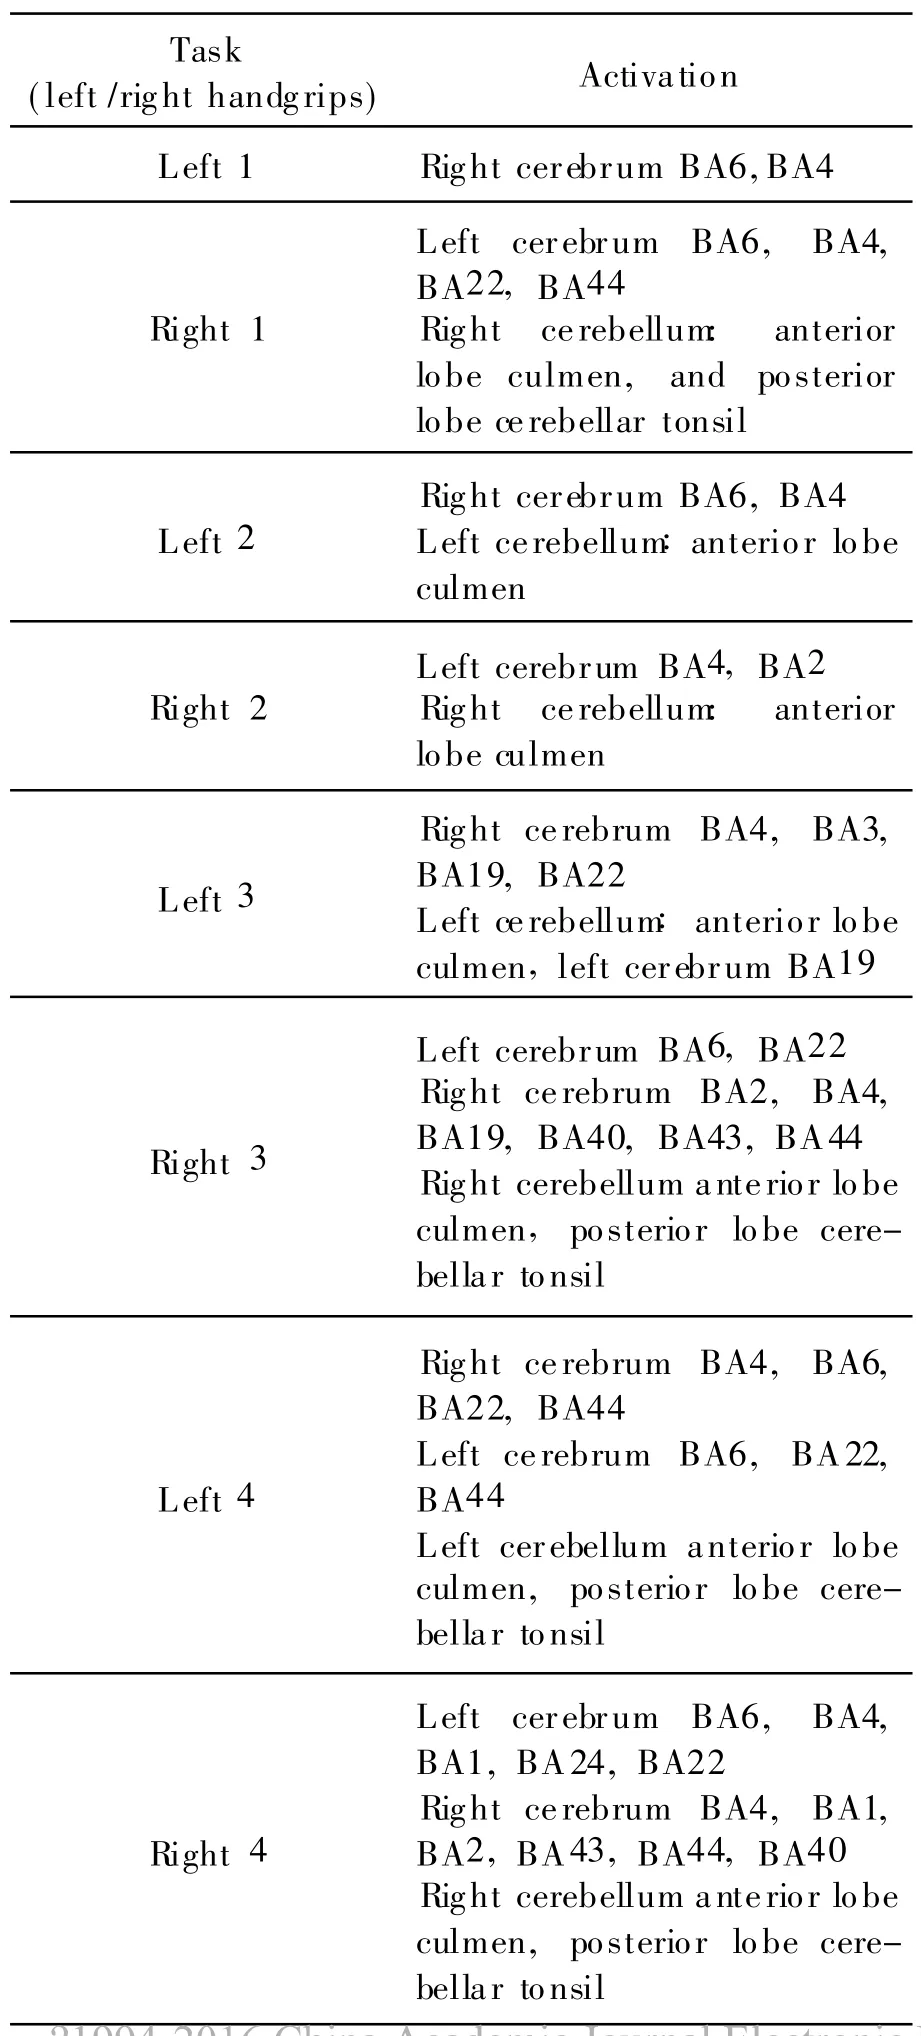
Table 1 Activations during left and right handgrip tests of patient No.1
3 CONCLUSION
In this paper,the handgrip task activates both contralateral and ipsilateral cortices. The primary motor area M1 and the supplementary motor area areinvolved in the task,as well as the somatosensory,cognition areas,and the cerebellum anterior/posterior lobe.It seems that the amount of activation areas is not directly related to thetime period of recovery.There aremore active areas with less active extent during right handgrip task due to the left hemisphere pathological changes.The left hemisphere needs to recruit other cortex besides the motor-related cortex to compensate the function of lesion regions in order to execute the right hand movement.It is observed that in the period from the second to the sixteenth week after the stroke,the activation of brain shifts from the ipsilesional hemisphere to the contralesional hemisphere.It is noticed that the structural parameters,i.e.,density,diameter and characteristic path length of MCN vary differently during the recovery of the brain among the five patients,whereas the functional characteristics trend to increase for three patients of them from the second to the sixteenth week after the stroke.The entropy,the integration and the complexity of MCN gradually become larger,which indicates that MCN has a higher overall degree of statistical independence and at the same time has more statistical dependencies among motor regions.These findings can reflect a recovery process.But the recovery degree varies and depends on the location and the stroke size.

Fig.2 Characteristics of MCN after stroke
Moreappropriate patients in the hospital will be recruited to obtain statistically significant results.In any case,it is attempted to understand the features of MCNs with some statistical measures,which may be associated with the movement generation and theinformation transfer.Results help physicians study the motor skill disruption and rehabilitation.
[1] Puh U,Vovk A,Sˇevsek F,et al.Increased cognitive load during simpleand complex motor tasks in acute stage after stroke[J].International Journal of Psychophysiology,2007,63(2):173-180.
[2] van der Zijden JP,Wu O,van der Toorn A,et al.Changes in neuronal connectivity af ter stroke in rats as studied by serial manganese-enhanced M RI[J].Neuro Image,2007,34(4):1650-1657.
[3] Stevens M C.The developmental cognitive neuroscience of functional connectivity[J].Brain and Cognition,2009,70(1):1-12.
[4] Fingelkurts A A,Fingelkurts A A,Kähkönen S.Functional connectivity in the brain—is it an elusive concept? [J].Neuroscience and Biobehavioral Reviews,2005,28(8):827-836.
[5] Ward N S,Frackowiak R SJ.The functional anatomy of cerebral reorganization af ter focal brain injury[J].Journal of Physiology,2006,99(4-6):425-436.
[6] Cramer S C,Nelles G,Schaechter J D,et al.A functional M RI study of three motor tasks in the evaluation of stroke recovery[J].Neurorehabil Neural Repair,2001,15(1):1-8.
[7] Calautti C,Naccarato M,Jones PS,et al.Therelationship between motor deficit and hemisphere activation balance after stroke:a 3 T f MRI study[J].Neuro Image,2007,34(1):322-331.
[8] Zhuang JC,LaConte S,Peltier S,et al.Connectivity exploration with structural equation modeling:an f MRI study of bimanual motor coordination[J].Neuro Image,2005,25(2):462-470.
[9] Friston K J.Dynamic causal modeling[J].Neuro Image,2003,19(4):1273-1302.
[10]Harrison L,Penny W D,Friston K J.Multivariate autoregressive modelling of fM RI time series[J].Neuro Image,2003,19(4):1477-1491.
[11]Eichler M E.A graphical approach for evaluating effective connectivity in neural systems[J]. Philos Trans R Soc B,2005,360(1457):953-967.
[12]Tononi SC,Edelman G M.Theoretical neuroanatomy:relating anatomical and functional connectivity in graph s and cortical connection matrices[J].Cerebral Cortex,2000,10(2):127-141.
[13]Riecker A,Wildgruber D,Mathiak K,et al.Parametric analysis of rate-dependent hemodynamic response functions of cortical and subcortical brain structures during auditorily cued finger tapping: a f MRI study[J].Neuro Image,2003,18(3):731-739.
[14]Wu T,Wang L,Chen Y,et al.Changes of functional connectivity of the motor network in the resting state in Parkinson′s disease[J].Neuroscience Letters,2009,460(1):6-10.
猜你喜欢
杂志排行

Transactions of Nanjing University of Aeronautics and Astronautics的其它文章
- FITTING CORRECTION METHOD OF RING ARTIFACTS FOR RECONSTRUCTING CONE-BEAM CT IMAGES
- IMAGING CHARACTERISTICSOF RAT MODELSOF PARKINSON DISEASE
- FLUORESCENCE SPECTRUM ANALYSISOF ETHER-WATER SOLUTION BASED ON GAUSSIAN DECOMPOSITION METHOD
- EFFECTIVE DETECTION DEPTH OF NEEDLE-LIKE OPTICAL PROBE
- PREPARATION AND CHARACTERIZATION OF WATERSOLUBLE NEAR-INFRARED EMITTING PbSQUANTUM DOTS
- HYBRID MULTI-OBJECTIVE GRADIENT ALGORITHM FOR INVERSE PLANNING OF IMRT