FLUORESCENCE SPECTRUM ANALYSISOF ETHER-WATER SOLUTION BASED ON GAUSSIAN DECOMPOSITION METHOD
2010-10-08HanCaiqinSongChunyuanWuBinLiuYingLuoXiaosenNiXiaowu
Han Caiqin,Song Chunyuan,Wu Bin,Liu Ying,Luo Xiaosen,Ni Xiaowu
(1.School of Physics&Electronic Engineering,Xuzhou Normal University,Xuzhou,221116,P.R.China;2.School of Science,Nanjing University of Science&Technology,Nanjing,210094,P.R.China;3.Advanced Photonics Center,Southeast University,Nanjing,210096,P.R.China)
INTRODUCTION
As a common organic solvent and extractant,the ether is extensively used for researching the characteristics of organic molecules[1-3].For example,Ref.[2]purified the InCl3 solution with the high Sb content by using ethyl ether extraction.Ref.[3]used the ether to determine the benzene carbonic acid concentration of the sauce through the efficient liquid chromatogram[3].The influences of the ether on other solutes,the analysis and the measurement of ether residue,and the effect of the ether in chemical reaction,etc.are investigated[4-6].Ref.[5]studied the effect of the diethyl ether on the preparation of the submicron-sized magnesium hydroxide[5]. Ref.[6]studied the synthesis of the high silica MOR zeolite in amine-free and fluoride-free ether-containing reactant system[6].As a kind of volatile anesthetic,theether has an anesthetic effect.Ref.[7]used the ether and the ethanol in the study of the anesthetic drosophila[7].Ref.[8]used ether anesthesia to research living survival time under the waterless condition by the ether anesthesia[8].Ether is widely applied to fields of chemical industry,material,agriculture,food,biology,and medicine,etc.The research shows that the ether is harmful when interacting with some biological tissues.Consequently,the molecular structures of the ether-water solution and the interactions with other materials become hot research subjects[9-11].
In the researches of the molecular structure,the spectrofluorimetry is extensively used due to its higher sensitivity[12-14].By studying molecular fluorescence spectra,therelationship between the fluorescence intensity and the chemical structures can be easily determined.Ref.[15-16]analyzed the emission mechanism and the spectral characteristics of the ether solution fluorescence spectra.In this paper,the fluorescence spectrum of the ether solution is made with Gaussian decomposition and fitted by using the second derivative fluorimetry method.The fluorescence spectra of seven types of luminescent association molecules are obtained.The center wavelengths,the peak intensities and the half peak bandwidth of each Gaussian spectral line are determined.The relationships of these parameters and different molecule associations are analyzed.It will contribute to the study of ether-water associations and their physicochemical properties.
1 EXPERIMENTAL INSTRUMENT AND METHODS
1.1 Instrument
The lifetime and steady state fluorimeter 900(FLS900)made in Edinburgh Instruments Ltd.of UK are used in the experiment.The light source in the steady-state spectrum is Xe 900—450 W with the continuous spectral distribution from 200 nm to 900 nm.
1.2 Materials and methods
The samples are triple-distilled water and analytically pure ethyl ether made by Sinopharm Chemical Reagent Co.,Ltd.(purity>99.9%).A 7%sampleis prepared for the measurement.In this experiment,the emission spectrum scanning step is 1 nm,and at each wavelength the scanning dwell time is 0.1 s.
A non-fluorescence quartz colorimetric utensil is used in the experiment.The aqueous solution of the ether-water mixture is prepared with the total volume of acetic acid-water staying fixed at 3 mL.The emission spectrum for each sample is measured three times.The measured spectra are stable as the whole.All the experiments are performed at the room temperature.
2 PRINCIPLE OF GAUSSIAN DECOMPOSITION
Supposing that all the points(xi,yi)of the curve y=f(x)are known.The curve is decomposed into the sum of n functions y≈F(xi)=f 1(xi)+ f 2(xi)+…+ f n(xi),and the function f i(x)meets Gaussian distribution
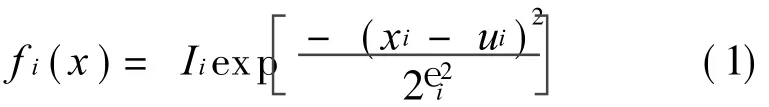
where 1≤ i≤ n.Iiis the peak value;uithe location of peak;and Withe half peak bandwidth of the Gaussian curve.
Eq.(1)can be changed into a linear equation by using the natural logarithm on both sides as follows[17]
If ln fi=zi,and
Then Eq.(1)can be changed into the quadratic polynomial fitting function
Considering all the data,the following equation can be obtained based on the least square principle[18].

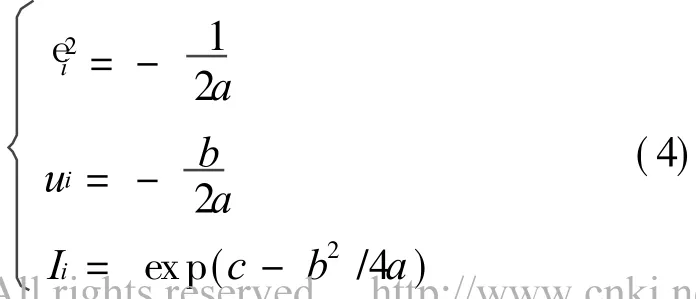
According to Eq.(3),the fitting constants a,b,c can be obtained.Gaussian parameters in Eq.(1)can be presented as
3 RESULT AND DISCUSSION
According to Ref.[15],the fluorescence spectrum of the ether-water solution has an obvious peak near 306 nm,excited by the optimal excitation wavelength of 245 nm,as shown in Fig.1.We can only observe approximate locations and quantities of emission peaks.The experimental fluorescence spectrum is the result of the superposition of several energy level transitions,so its maximum value cannot express that of the energy released by the stimulated transition.It is probably the maximum value of the energy released by different energy level transitions.
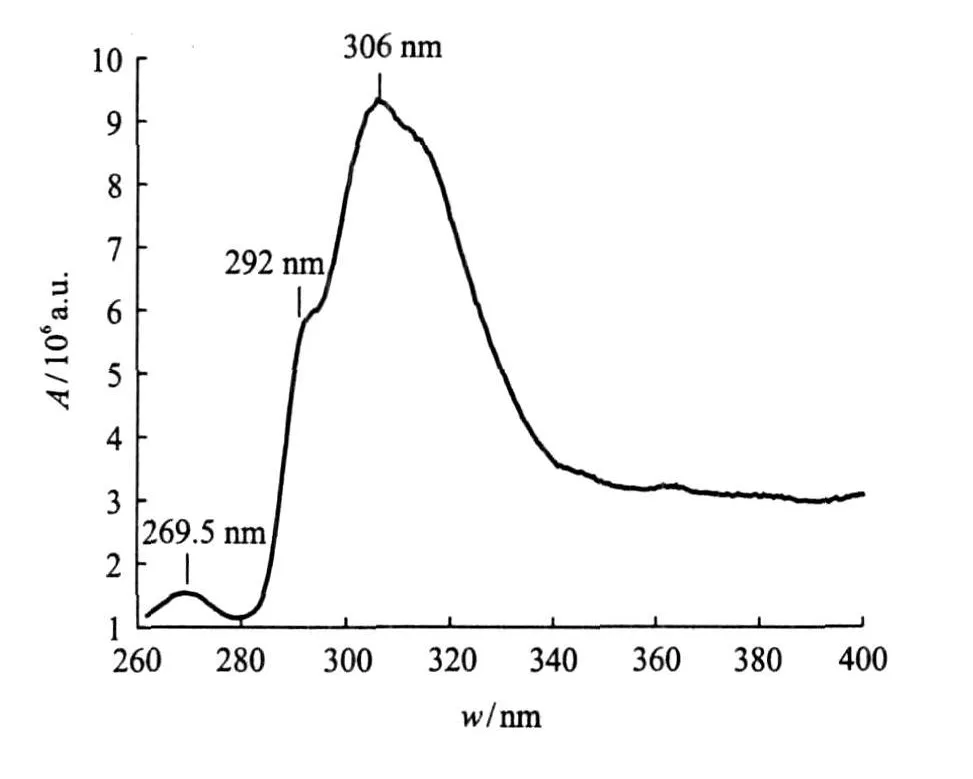
Fig.1 Fluorescence spectrum of ether-water solution excited by UV-light of 245 nm
3.1 Second derivative fluorescence spectrum of ether-water solution
The fluorescence spectrum shown in Fig.1 is filtered by FFT low-pass filter so as to remove the noise influence on the numerical analysis.Five point smoothing and the second derivative are made for the spectral line,then the second derivative spectrogram shown in Fig.2 is obtained,where the abscissa and the ordinate express the emission wavelength and the second derivative value, respectively. As shown in Fig.2,thereare several minimum values and only periodic change after the wavelength of 330 nm in the spectral line caused by normal oscillation of the curve by the analysis.Therefore,only seven minimum values which are found at around 265,276,291,304,317,330 and 364 nm are fluorescence spectral peak values of the ether-water solution.After the second derivative of the fluorescence spectrum,the spectral band becomes narrow and the superposition with others is lessened.The fluorescence spectrum is divided into several peaks,so that different association molecules can be distinguished and thehigher sensitivity is manifested in the quantitative measurement.
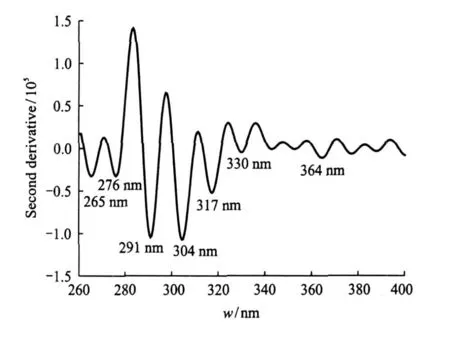
Fig.2 Second derivative fluorescence spectrum of ether-water solution
3.2 Gaussian decomposition and fitting of ether-water solution

Fig.3 Gaussian fitting curves of ether-water solution
Taking seven wavelength values as a center,the Gaussian decomposition method is applied to the ether-water solution spectral line with smoothing and normalization,then multi-peak Gaussian fitting is made for the filtering spectrum.As shown in Fig.3,where the solid line expresses the emission spectrum,the dashed line expresses the sum of seven peaks by using Gaus-sian fitting,while the seven Gaussian curves express the fluorescence spectra of seven types of the luminescent structure,respectively. It is found that the Gaussian function curve through the regression is basically consistent with the spectral line in the experiment,it demonstrates that the fitting precision of Gaussian decomposition is higher and the lost information induced by decomposition is less.Therefore,all groups of fluorescence spectra can bedistinctly presented by using Gaussian decomposition so that all details of various associations of the solution which absorb exciting light and emit the fluorescence are observed.
Each Gaussian lineis shown as the composition of the lots of sharp spectral lines which correspond to thestimulated transition.Theenergies of the stimulated transition vary within the group of the molecular structures.All the Gaussian parameters,the center wavelengths(x c),the peak intensities(A),and the half peak bandwidths(w)are shown in Fig.3.
The ether and the water mixture can absorb UV-light and emit different spectral peaks.The reason is that different molecular structures are formed when the ether and the water are associated.The fluorescence emission is caused by absorbtion exciting light with different wavelengths.From Table 1,wecan seethat the Gaussian peak value with the wavelength of 304 nm is maximum,which means that the association with the peak wavelength of 304 nm has an optimal excitation wavelength located at(245±3)nm.If the wavelength of the exciting light is changed,the emission fluorescence at 304 nm will be reduced and the stronger fluorescence emission peaks will appear at other locations.The fluorescence peaks of other associations are lower and show that their optimal exciting light wavelengths are not at 245 nm,but they can absorb the light of 245 nm to different degrees.It is obvious that the relativeintensity comparison of all peaks after using the Gaussian decomposition shows the optimal absorption wavelength of the association and even the energy level interval of the luminescent structures,thus can provide an experimental foundation for further deducing the energy level structures.
According to Table 1,we can also find that the half peak bandwidth of all Gaussian spectral lines is different,and the difference of thehighest and the lowest energy levels in ground state varies.On the basis of the expressionΔE=Δλof energy level difference,whereλis the center wavelength andΔλ the half peak bandwidth.We can calculate that the energy difference of the highest and the lowest oscillation energy level in ground state corresponding to the spectra.Their center wavelengths are located at 265,276,291,304 and 317 nm are 0.12,0.07,0.11,0.20 and 0.13 eV,respectively,where the energy level differencecorresponding to the wavelength of 304 nmis themaximum.Due to thediscrepancy of the average lifetime of excitation state atoms in moleculeassociation,the self-absorption phenomenon caused by the same types of ground state atoms is diverse and the spectral width is different.However,in view of the vary of interatomic relative location,the diverse interactional chemical bonds and the interaction forces in association,the half peak bandwidth of all Gaussian spectral lines is disparate.Each location and the spectral width of Gaussian spectral lines influence the broadening of the fluorescence spectrum.

Table 1Gaussian f itting parameters
4 CONCLUSIONS
The fluorescence spectrum of ether-water solution induced by the exciting light with the wavelength of 245 nm is experimentally obtained.Using the location and the minimum numbers of the second derivative spectrum,the Gaussian decomposition and the fitting for the fluorescence spectrum are made.The conclusion can be drawn as follows:
(1)With the exciting light of 245 nm,there are seven types of luminescent association molecules formed by ether and water molecules in different configurations.The peak wavelengths of each fluorescence spectrum are 265,276,291,304,317,330 and 364 nm,respectively.
(2)Ether-water mixture radiates fluorescence becauseof theexciting light absorbtion with different wavelengths.The association molecule whose peak wavelength is 304 nm with an optimal excitation wavelength located at(245±3)nm.
(3)Thereare different interatomic and intermolecular chemical bonds among association molecules so that the half peak bandwidths of the Gaussian spectral lines are different.The center wavelength and the half peak bandwidth of each Gaussian spectral line influence the broadening of the fluorescence spectrum.
[1] Eladio P F,Jhoany A E,Lauro N P,et al.Solubility of cefotaximesodium salt in seven solvents used in the pharmaceutical industry[J].JChem Eng Data,1998,43:49-50.
[2] Zhou Zhihua.Purification of InCl3solution with high Sb content by ethyl ether extraction[J].Nonferrous Metals,2006,58(2):53-59.(in Chinese)
[3] Meng Yajun.Ether extraction and lyeseparation-detection of benzenecarbonic acid of sauce through efficient liquid chromatogram[J].Chinese Sanitation Test Journal,1999,9(4):309.(in Chinese)
[4] Naruse Y,Ito Y,Inagaki S.Ethylation by ethyl ethers in the presenceof organometallic bases:reactions of hydrocycloalk[b]indoles[J].JOrg Chem,1999,64:639-640.
[5] Wu Xiangfeng,Hu Guosheng,Yang Yunfeng,et al.Effect of diethyl ether on preparation of submicronsized magnesium hydroxide[J].Chemical Industry and Engineering Progress,2008,27(1):131-134.(in Chinese)
[6] Wang Jing,Cheng Xiaowei,Yang Xiaowei,et al.Synthesis of high silica MOR zeolite in amine-free and fluoride-free ether-containing reactant system[J].Acta Chimica Sinica,2008,66(7):769-774.(in Chinese)
[7] Hao Dacui,Yao Mingjing,Liu Yan.Study of anesthetic drosophila with ether and ethanol[J].Biological Bulletin,2007,42(8):52-54.(in Chinese)
[8] Zhang Heng,Zhu Wei,Li Dong,et al.Living fish maintained in waterless by ether anesthesia[J].Food Science and Technology, 2007,12:202-205. (in Chinese)
[9] Franks N P,Lieb W R.Molecular and cellular mechanisms of general anesthesia[J].Nature,1994,367:607-614.
[10]Chen Shaoying.Application of ether in postpartum bleeding caused by in tractableinertia uteri[J].Clinical Medicine,2006,26(11):74-75.(in Chinese)
[11]Wang Yan,Zhang Shudong,Zhu Xiangjun,et al.Mass spectrum of laser ionized diethyl ether clusters studied with ab initio calculation[J].Acta Physica Sinica,2007,56(8):4492-4496.(in Chinese)
[12]Ji Qianru,Liu Xiao,He Junfang,et al.Steady-state fluorescence spectrum analysis of thylakoid membranes of etiolated maize seedlings[J].Acta Photonica Sinica,2008,37(12):2486-2492.(in Chinese)
[13]Shi Aimin,Zhu Tuo,Gu Endong,et al.Study on fluorescent spectra of amaranth and ponceau 4R[J].Acta Optica Sinica,2008,28(11):2237-2242.(in Chinese)
[14]Chen Xiaojing, Zhu Tuo. Quantum analysis of methanol fluorescent spectra[J].Acta Photonica Sinica,2008,37(7):1433-1435.(in Chinese)
[15]Song Chunyuan,Li Rongqing, Ge Lixin,et al.Study on the fluorescence characteristic and mechanism of ether-water solution[J].Spectroscopy and Spectral Analysis, 2007,27(3): 534-538. (in Chinese)
[16]Chen Guoqing,Wu Yamin,Zhu Tuo,et al.Fluorescence spectra of ethyl ether and its characteristic[J]. Journal of Atomic and Molecular Physics,2007,24(1):101-105.(in Chinese)
[17]Zhang Tieli,Fang Dawei,Zhang Zaixuan.Research of stimulated Raman scattering spectrum of fiber based on L-M arithmetic[J].Optoelectronic Tech&Info,2004,17(5):46-48.(in Chinese)
[18]Zhu Guifeng,Jin Shiqun,Bian Ming.Study on extracting method for centric line of cross structuredlight stripe[J].Metrology Test Technology&Verification,2006,l6(3):12-14.(in Chinese)
杂志排行

Transactions of Nanjing University of Aeronautics and Astronautics的其它文章
- FITTING CORRECTION METHOD OF RING ARTIFACTS FOR RECONSTRUCTING CONE-BEAM CT IMAGES
- IMAGING CHARACTERISTICSOF RAT MODELSOF PARKINSON DISEASE
- MOTOR CORTEX NETWORKSIN STROKE PATIENTS DURING RECOVERY WITH f MRI
- EFFECTIVE DETECTION DEPTH OF NEEDLE-LIKE OPTICAL PROBE
- PREPARATION AND CHARACTERIZATION OF WATERSOLUBLE NEAR-INFRARED EMITTING PbSQUANTUM DOTS
- HYBRID MULTI-OBJECTIVE GRADIENT ALGORITHM FOR INVERSE PLANNING OF IMRT