Effect of bubble morphology and behavior on power consumption in non-Newtonian fluids’ aeration process
2024-04-22XieminLiuJingWanJinnanSunLinZhangFengZhangZhibingZhangXinyaoLiZhengZhou
Xiemin Liu ,Jing Wan ,Jinnan Sun ,Lin Zhang ,Feng Zhang ,* ,Zhibing Zhang ,* ,Xinyao Li ,Zheng Zhou
1 Key Laboratory of Mesoscopic Chemistry of Ministry of Education (MOE),School of Chemistry and Chemical Engineering,Nanjing University,Nanjing 210023,China
2 Dalian Research Institute of Petroleum and Petrochemicals,SINOPEC,Dalian 116045,China
Keywords: Non-Newtonian fluids aeration process Power consumption Volumetric mass transfer rate Bubble size
ABSTRACT Due to a prolonged operation time and low mass transfer efficiency,the primary challenge in the aeration process of non-Newtonian fluids is the high energy consumption,which is closely related to the form and rate of impeller,ventilation,rheological properties and bubble morphology in the reactor.In this perspective,through optimal computational fluid dynamics models and experiments,the relationship between power consumption,volumetric mass transfer rate (kLa) and initial bubble size (d0) was constructed to establish an efficient operation mode for the aeration process of non-Newtonian fluids.It was found that reducing the d0 could significantly increase the oxygen mass transfer rate,resulting in an obvious decrease in the ventilation volume and impeller speed.When d0 was regulated within 2-5 mm,an optimal kLa could be achieved,and 21% of power consumption could be saved,compared to the case of bubbles with a diameter of 10 mm.
1.Introduction
Gas dispersion in non-Newtonian fluids is encountered in various industrial fields,including antibiotics,polysaccharide production,fungal fermentation,cell culture,wastewater treatment,etc.[1-5].Practically,due to the complicated rheological properties,aeration of non-Newtonian fluids faces many challenges.Firstly,since the viscosity of non-Newtonian fluids varies with the local shear rate,there usually exists a poor mixing area.In addition,in non-Newtonian fluids,bubbles are prone to coalesce into larger size,thus the gas-liquid interfacial area declines,and the bubble residence time decreases.Both of these factors cause low oxygen mass transfer efficiency.To construct an efficient aeration process of non-Newtonian fluids,high power consumption is often required to maintain the required oxygen transfer rate,accounting for about 50%-60% of the total operating costs [6,7].
Therefore,efficient gas-liquid mass transfer is crucial in the aeration processes,which can be affected by the gas sparger type,agitator type,impeller speed,ventilation,rheological properties and the like [8].As for the effect of sparger type on mixing performance and mass transfer characteristics,García-Ochoa and Gómez[9]believed that the sparger type did not significantly affect the mass transfer rate.However,more studies[10]have shown that the micropore sparger could raise the mass transfer rate in non-Newtonian fluids,compared to the traditional millimeter-scale hole sparger.This is mainly due to the fact that the micropore sparger could reduce the initial bubble size (d0) and thereby improve the mass transfer rate.Accordingly,reducing the d0appears to be an effective way to obtain high mass transfer rate in non-Newtonian fluids.Adding a small amount of surfactants can reduce the bubble size but introduces new contamination into the system[11].In aerated reactors,stirring impellers are usually used to break up bubbles to obtain small bubbles.Jegatheeswaran et al.[12] shed light on how anchor impeller type,impeller speed and solidity ratio affect aeration efficiency in non-Newtonian fluids with both numerical and experimental works.Arjunwadkar et al.[13,14] demonstrated that the combination of axial and radial impellers presents a high gas-liquid mass transfer rate.Gabelle et al.[15] discussed the effect of tank size on the volumetric mass transfer rate(kLa)and mixing time in aerated stirred reactors with non-Newtonian fluids,finding that the traditional viscositycontribution method failed to predict the change of kLa during the scale-up of reactor.
So far,it is difficult to establish a systematic evaluation on the relationship between initial bubble size,mass transfer rate and power consumption for aeration processes in non-Newtonian aeration mixing systems.Empirical correlations reported in the literature just focused on the effect of operating conditions on kLa,whereas the whole energy cost including gas compression power consumption and stirring power consumption is not concerned.An empirical correlation was built to estimate the bubble Sauter diameter (d32),gas holdup and kLa in a mechanically stirred tank with xanthan gum solutions [16].It had a high prediction accuracy but was not applicable to different d0.García-Ochoa et al.[17] proposed different correlations considering the effect of operating conditions and fluid viscosity.Jamshidzadeh et al.[18] proposed novel dimensional and dimensionless correlations,which concerned the impeller configuration and corotation mode for coaxial mixers.It was found that considering apparent viscosity and speed ratio could greatly improve the prediction accuracy.The empirical correlation proposed by Gabelle et al.[15] discussed the effects of reactor size and impeller configurations to explain the huge differences in design.However,due to a lack of local information and understanding of the interfacial mass transfer mechanism,the prediction error was quite large for the case of non-Newtonian fluids.Hence,systematic works are urgently needed to clarify the characteristics and their influencing factors for aeration processes in non-Newtonian fluids.
In the present work,the mechanism of bubble generation,coalescence and breakup in non-Newtonian fluids was clarified through systematic experiments and computational fluid dynamics (CFD) study.Eight kinds of coalescence and breakup combination models were incorporated into CFD studies.The bubble size distribution (BSD) and kLa were evaluated across a range of concentration,impeller speed,ventilation rate and speller type.The relative experiments were performed with aqueous solutions of carboxymethyl cellulose (CMC) in a 5-L aeration reactor.Besides,the relationship between the kLa and the process conditions was established.An energy consumption evaluation model was also established according to the energy dissipation theory of bubbles.Under the specified volumetric mass transfer rate requirement,the optimal combination of impeller speed and bubble diameter can be selected to realize the high efficiency and low energy consumption for aeration processes in non-Newtonian fluids.
2.Experimental
2.1.Materials
CMC (purity >99.0%) was purchased from Acmec Biochemical Co.,Ltd.(Shanghai,China),and nitrogen (purity >99.99%) was provided by Tianze gas Co.Ltd.,China.
2.2.Experimental equipment
The experiments were performed in a 5-L bench top-aerated bioreactor (T&J Bio-engineering Co.,Ltd.,China) with a diameter of 0.15 m and a height of 0.3 m.The reactor was equipped with three Rushton impellers.The experiments were conducted at 25°C and atmospheric pressure,with the concentration of CMC solutions ranging from 0.1%to 0.5%.Gas was supplied using three types of gas sparger,at three flow rates of 0.2,0.6 and 1 vvm (air volume/culture volume/min).The experimental equipment is depicted in Fig.1.
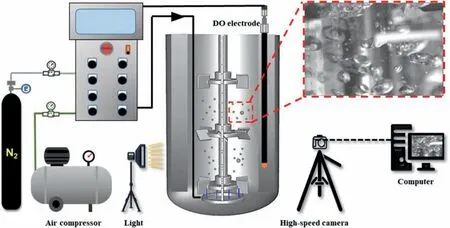
Fig.1.Bioreactor experimental setup.
2.3.Bubble size db measurement
A high-speed camera (Phantom v2640,Vision Research,USA)was used to capture bubble images at 1000 frames per second for a duration of 30 s.The two-dimensional images of the bubbles(over 80 bubbles for each condition) were treated with the Album software to obtain the bubble size.Each bubble size is calculated with Eq.(1):
where Eiand eiare the long and short axes of the bubble,respectively.The Sauter mean diameter of the bubbles d32is calculated with Eq.(2) [19]:
2.4.Global volumetric mass transfer coefficient kLa
Pure water was introduced into the bioreactor.After calibration of the dissolved oxygen electrode,the stirring was turned on (the rotation speed could be adjusted as 200,300 and 400 r∙min-1).kLa of oxygen was measured with the dynamic gassing-out method [20],and kLa is calculated according to Dunn [21]:
where CSis the saturated dissolved oxygen concentration.CI0and CIare the initial and real-time dissolved oxygen concentrations,respectively.τpstands for the dissolved oxygen(DO)electrode time constant.When τR=1/kLa is much larger than τp,Eq.(3) can be simplified as [22]:
The kLa measurements under each condition were repeated three times and were averaged to reduce experimental errors.
3.Numerical Methods
3.1.Governing equations
The continuity and momentum equations are as follows:
where α,uandFare the volume fraction,velocity and momentum exchange terms,respectively.
3.2.Population balance model
3.2.1.Bubble coalescence model
The bubble coalescence rate is calculated with Eq.(7):
The frequency of collisionwijTis defined as follows [23]:
The probability that the collision results in coalescence Pc(di,dj)can be calculated by the Luo model [24]:
Yang's group [25] combined the description of the mesoscale energy of the gas-liquid system with the population balance model(PBM) model.In the stable state of the gas-liquid system,the mesoscale energy tends to be the smallest,and the bubbles between different diameters are broken and aggregated.Since it is in dynamic equilibrium,a correction method for the coalescence model is proposed.The corresponding correction factor relation of Luo [24]coalescence model is
The detailed information of the coalescence models investigated in the work is listed in Table 1.

Table 1 Detailed information of the coalescence model investigated in the work
3.2.2.Bubble breakup model
The rate of bubble with volume V0breakage into fvand(1-fv)V0is
where λ and fvare sizes of the eddies and breakup volume fraction,respectively.
The breakage frequency developed by Luo and Svendsen[26]is defined as follows:
The breakage frequency between bubbles and small eddies(λ≤d0),and large eddies (λ>d0) is calculated with the model proposed by Han et al.[27,28]:
where C0is the dimensionless oscillation ratio.
The breakage frequency considering viscous shear is expressed as [29,30] follows:
The proposed breakage model concerning the mean turbulent velocity of eddies,under the influence of bubble-induced turbulence (BIT) and the characteristic wavenumber/length scale that corresponds to BIT [31],is given as follows:
The breakage probability is written as follows:
where χcstands for critical dimensionless energy for breakup.and ecr(λ) represent the mean kinetic energy of an eddy and the critical eddy kinetic energy required for breakup,respectively.The detailed information of the breakup models is listed in Table 2.

Table 2 The detailed information of the breakup models investigated in the work
3.3.Viscosity model
To simulate different non-Newtonian fluids,a viscosity model is necessary for the CFD code to capture the viscosity-shear rate dependence.The viscosity data of CMC solution were calculated as follows:
where υ,υ0,and γ represent apparent viscosity,zero-shear viscosity,and shear rate,respectively.K and m are constants.The relevant parameters of the CMC solutions used in this study are listed in Table 3 [32].

Table 3 Properties of carboxymethyl cellulose solutions used in the study
3.4.Expressions for volumetric mass transfer coefficient kLa
To obtain the local kLa,kL(liquid side mass transfer coefficient)and a(specific interfacial area)have to be calculated separately.a is calculated with following equation:
kLis calculated using the Penetration model [33],which is applicable to a wider range of operating conditions than is the eddy cell models.
where DLis the oxygen molecular diffusivity,with the value of 2.01 × 10⁻⁵cm2∙s-1;vlrepresents the liquid dynamic viscosity.
3.5.Simulation details
Steady-state and transient simulations were performed with open-source CFD software.The information of the discrete method (class method) in PBM is 15 Bins and 1.5 vol grow rate.Due to the advantages of computational stability and good convergence,the standard k-ε turbulence model was chosen as the turbulence model.The multiple reference frame method was used to model the impeller motion.The sparger and liquid level were set as velocity inlet and degassing,respectively.A phase-coupled SIMPLE method was applied for coupling between pressure,velocity and volume fraction.The first-order upwind scheme and the QUICK scheme are used for the gasphase bin equations and volume fraction equations,respectively.The second-order upwind scheme is used for other equations.The time step was set to 0.02 s,and the simulation results were averaged within 20.0 s after the conservation of inlet and outlet flow.
During the mesh generation process,local mesh refinement was used for the rotating domain and the impeller.Three grids,with 225317,423350,and 653309 grid elements,were used to assess grid independence (Fig.2).

Fig.2.Effects of mesh number on simulated (a) d32 and (b) kLa.
According to Fig.2,the simulated d32with different grids are similar,whereas the simulated kLa with a grid of 225317 is lower than those obtained with grids of 423350 and 653309.Since the d32and kLa obtained with grids of 423350 are nearly identical to the results obtained with the 653309 grid,the grid of 423350 was chosen in the following work.
4.Results and Discussion
4.1.Effect of operating conditions
4.1.1.Impeller speed
Both experimental investigations and computational simulations were conducted to assess the predictive accuracy of eight combination models for bubble coalescence and breakup,under varying impeller speeds.The experimentally measured initial bubble size,obtained directly from the sparger,was used as the initial value for PBM model in the CFD simulations.Considering the importance of bubble size (db) and volumetric mass transfer coefficient in the design and operation of aeration reactors,a comparison was conducted between the experimental and CFD-PBM simulation results for dband kLa.
As illustrated in Fig.3(a)-(d),the B3 bubble breakup model demonstrates a superior accuracy in predicting the BSD.Moreover,with the escalation of impeller speed,the BSD becomes narrower and shifts toward smaller diameters,consistent with the experimental observations.Conversely,the B1,B2,and B4 models tend to underestimate the frequency of bubble breakup,resulting in an overestimation of the bubble size in the predictions.The trends in the predicted kLa values from the combined models exhibit consistency with the experimental results,albeit with slightly lower predicted values.Notably,introducing large-scale eddies BIT does not improve the prediction of bubble breakup frequency.However,the model B3,accounting for the bubble breakup frequency caused by viscous shear,significantly enhances the accuracy of predictions due to the high shear rate in the aerated bioreactor and the sensitivity of non-Newtonian fluids to turbulent shear.Moreover,the correction factor for coalescence model based on energy minimization multi-scale (EMMS) theory has little effect on simulation results.This is because the volume of the lab-scale bioreactor is quite small,thus the superficial gas velocity is low and a correction factor close to 1(specifically,0.9422).It is worth noting that in industrial bioreactors,where superficial gas velocity is typically high,the EMMS correction factor must be duly considered for accurate predictions in the aeration process.

Fig.3.Comparisons between the experimental data and computational fluid dynamics predictions under the conditions of 1 m3∙m-3∙min-1 and 0.1%(mass),using sparger A:(a)global bubble size distribution(BSD)at 200 r∙min-1,(b)global BSD at 300 r∙min-1,(c)global BSD at 400 r∙min-1,(d)Sauter mean diameter,(e)volumetric mass transfer coefficient.
Measuring local viscosity using experimental methods is challenging.CFD simulations can vividly illustrate the distribution of viscosity,a crucial factor for bioreactor design and optimization.Fig.4 displays the simulated local viscosity distribution by the C2-B3 model under varying impeller speeds as this model exhibits enhanced predictive accuracy.It is evident that the overall viscosity decreases with rising impeller speed,and the viscosity distribution is non-uniform.The viscosity near the impeller is lower due to stronger shear force.Furthermore,it has been observed that the combination of different bubble coalescence and breakup models exerts minimal influence on viscosity simulation.This is attributed to the fact that viscosity is primarily influenced by shear forces,whereas the impact of bubble size is marginal.

Fig.4.Contour maps of liquid viscosity on a vertical plane at different impeller speeds: (a) 200 r∙min-1,(b) 300 r∙min-1,(c) 400 r∙min-1.
4.1.2.Ventilation volume
The C2-B3 combined model still exhibits the highest predictive accuracy under different ventilation volumes.The deviation between the simulation and experimental results is smaller at a low ventilation volume.Fig.5(a)-(c) shows that the experimental and simulated BSDs are both bimodally distributed at a low ventilation volume.It is noteworthy that the distance between the two peaks in the BSD simulated with the B3 breakup model is adjacent,which is more consistent with the experimental results.In contrast,the other breakup models show a larger distance between the two peaks in the BSD.Fig.5(d)shows that the C2-B3 combined model exhibits the smallest deviation from experimental values in predicting kLa,but as the ventilation volume increases,the deviation between the predicted kLa by the C2-B3 model and the experimental values gradually increases.This indicates that further validation is needed when using this model under conditions exceeding 1 m3∙m-3∙min-1.
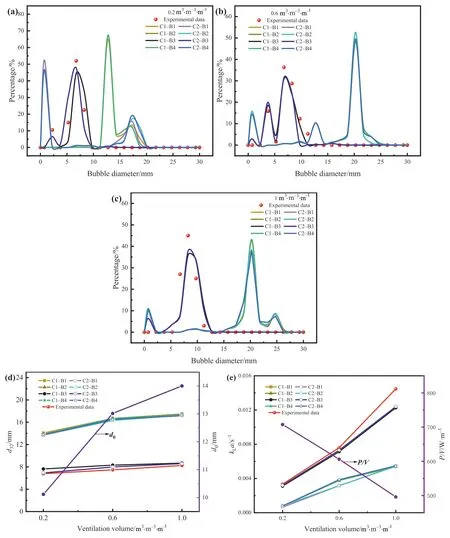
Fig.5.Comparisons between the experimental data and computational fluid dynamics predictions under the conditions of 300 r∙min-1 and 0.1%(mass),using sparger A:(a)global bubble size distribution(BSD)at 0.2m3∙m-3∙min-1,(b)global BSD at 0.6m3∙m-3∙min-1,(c)global BSD at 1m3∙m-3∙min-1,(d)Sauter mean diameter,(e)volumetric mass transfer coefficient.
4.2.Effect of rheological properties and gas sparger types
4.2.1.CMC concentration
The predicted d32and kLa trends of all combined models agree with the experimental results.The error between simulation and experimental results is smaller at a higher viscosity.Obviously,the C2-B3 model had the highest performance,similar to that of the operating conditions.Moreover,the C2-B3 model also predicted the BSD well at different CMC concentrations (Fig.6(a)-(c)).The simulation results show that the BSD had a bimodal distribution,which was not experimentally observed.This indicates that there is an error in predicting small bubble sizes by the bubble coalescence and breakup model.The higher CMC concentration caused the distribution curve to move toward the larger bubbles,while the BSD became narrower.

Fig.6.Comparisons between the experimental data and computational fluid dynamics predictions under the conditions of 300 r∙min-1 and 1 m3∙m-3∙min-1,using sparger A:(a)global bubble size distribution(BSD)at 0.1%(mass),(b)global BSD at 0.3%(mass),(c)global BSD at 0.5%(mass),(d)Sauter mean diameter,(e)volumetric mass transfer coefficient.
The simulated local viscosity distribution using the C2-B3 model at different CMC concentrations is depicted in Fig.7.CMC solutions with higher concentrations exhibit elevated viscosities at the same impeller speed.A region of elevated viscosity is observed between the two impellers.The non-uniformity of viscosity distribution becomes more pronounced with higher concentration CMC solutions,impeding the fermentation process.Based on the simulation results,an optimization strategy can be formulated to enhance shear uniformity by altering the impeller type.

Fig.7.Contour maps of liquid viscosity on a vertical plane at different carboxymethyl cellulose concentrations: (a) 0.1% (mass),(b) 0.3% (mass),(c) 0.5% (mass).
4.2.2.Gas sparger type
As mentioned earlier,kLa can be significantly improved by increasing impeller speed and ventilation volume.However,high impeller speed and ventilation volume requires more energy consumption.Therefore,it is necessary to find ways to increase kLa more efficiently.Previous studies have proved that reducing the bubble size can distinctly increase kLa.Small bubbles can be generated with micron-scale sparger.As shown in Fig.8,Sparger A has traditional millimeter-scale pores,and sparger B and sparger C are the metal-titanium sparger,whose pore sizes are 5 and 0.2 μm,respectively.
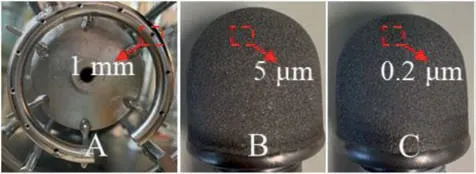
Fig.8.Sparger types.
According to Fig.9,the initial bubble sizes generated by three spargers are 14.0,4.1 and 3.1 mm,respectively.The prediction with the model C2-B3 is close to the experimental data.d32drops with a decrease in d0.Noticeably,when d0is large,d32is less than d0,indicating the breakup of big bubbles;when d0is low,d32is greater than d0,indicating the coalescence of small bubbles.Moreover,the smaller pore size of sparger leads to smaller d0(d32) and thus lower kLa.It should be noted that as kLa increases by 60.9%,unit volume power (P/V) rise just by 5.6%.The BSD shows that sparger B and sparger C metal can not only generate smaller bubbles but also narrow the BSD.
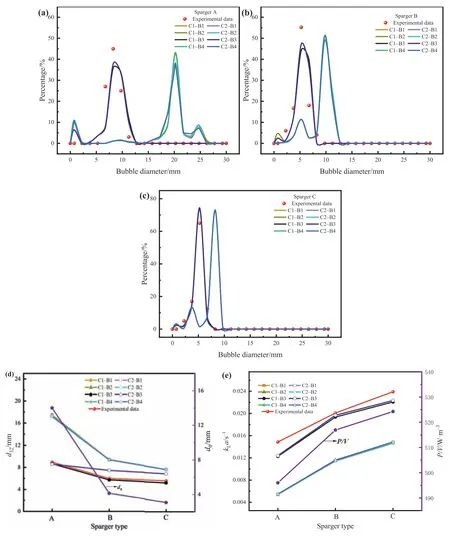
Fig.9.Comparisons between the experimental data and computational fluid dynamics predictions under the conditions of 300 r∙min-1,1 m3∙m-3∙min-1 and 0.1% (mass): (a)global bubble size distribution (BSD) at sparger A,(b) global BSD at sparger B,(c) global BSD at sparger C,(d) Sauter mean diameter,(e) volumetric mass transfer coefficient.
4.3.Power consumption optimization model
Based on the previous simulation and experimental results,we have demonstrated that the C2-B3 combined model has the best performance in predicting d32and kLa under different operating conditions.In order to construct a power consumption optimization model,we first established an empirical relationship for kLa under a wide operating range as follows:
This empirical relationship not only takes into account the influences of traditional parameters such as unit volume power,ventilation volume,and rheological characteristics but also considers the important factor of initial bubble size as demonstrated in previous studies.Therefore,the results show that this empirical relationship has a high level of accuracy with a standard deviation of 14.19% (See Fig.10).
In addition,an optimization model and power analysis were developed for the aeration process in non-Newtonian fluids,with a focus on the energy consumed by sparger aeration and agitation.Specifically,the energy loss due to pressure drop can be expressed as the integral of ΔpdQ,where Δp represents the pressure drop and Q denotes the gas volume flow rate.The power consumption of the sparger is comprised of the aeration power(Ea)and micropore wall resistance power(Ew):
The aeration power is utilized to disperse air bubbles into the liquid,and its magnitude is dependent on the energy dissipation rate in the liquid.Our previous study[34,35]has suggested that the energy dissipation rate (εe) can be assumed to be proportional to the bubble size:
The power consumption caused by micropore wall resistance can be calculated according to typical Darcy's law [36] and nonlinear Forchheimer equation [37] as follows:
The final expression of the pressure drop can be written as follows:
The model shows the mechanism of pressure drop from the perspective of macroscopic flow and microscopic bubbles.The pressure at the input of the sparger has to surmount hydrostatic load,pressure loss and surface tension of liquid.The power required for air compression is [38,39] given as per the following equations:
Fig.11 illustrates the calculated kLa and power consumption based on the power consumption optimization model for different P/V and d0.It is observed that the kLa significantly rises with a reduction of initial bubble size and an increase in power per unit volume.However,when the bubble size is reduced to a certain point,the power consumption required for bubble generation increases.In this study,power consumption optimization was conducted by minimizing the sum of bubble generation power and agitation power.Using kLa of 0.015 s-1as a reference,the corresponding P/V and d0values were marked with a red line in Fig.11(a),and the corresponding power consumption was calculated and marked with a red line in Fig.11(b).
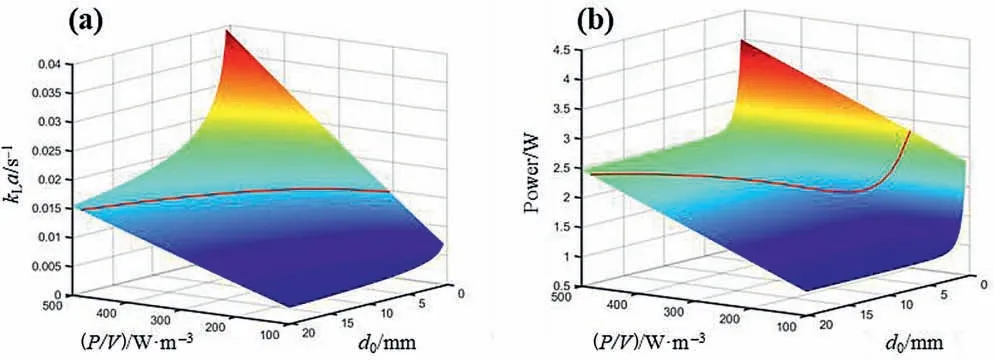
Fig.11.The effects of d0 and P/V on (a) kLa and (b) power.
For better illustration,the two red lines from Fig.11 are visually displayed in Fig.12.It is observed that as d0increases from 0.1 to 20 mm,the matched P/V rises from 199 to 484 W∙m-3.It is noted that an optimal kLa can be achieved with moderate power consumption when d0is regulated within 2-5 mm,resulting in a 21% reduction in power consumption compared to bubbles with a diameter of 10 mm.

Fig.12.The corresponding P/V and d0 values at kLa of 0.015 s-1.
5.Conclusions
In this study,the power consumption of an aeration process in non-Newtonian fluids was calculated in terms of gas compression and agitation.Furthermore,by means of an optimal CFD model and experimental analyses,the relationship between power consumption,kLa and d0was constructed to develop an efficient operational approach for the aeration process of non-Newtonian fluids.The conclusions are as follows.
(1) The C2-B3 model,which considers the EMMS bubble coalesce correction factor and the breakage frequency caused by viscous shear,demonstrates the highest accuracy in predicting kLa and BSD in the aeration process of non-Newtonian fluids,with the least deviation from the experimental data.
(2) The kLa and power consumption are closely related to the form and rate of impeller,ventilation,rheological properties and bubble morphology in the reactor.The empirical relationship between these factors proposed in the paper exhibits high accuracy,with a standard deviation of 14.19%.
(3) Reducing the d0can significantly enhance the oxygen mass transfer rate,leading to a noticeable reduction in ventilation volume and impeller speed.An optimal kLa can be achieved with moderate power consumption when d0is regulated within 2-5 mm,resulting in a 21% reduction in power consumption compared to bubbles with a diameter of 10 mm.
CRediT Authorship Contribution Statement
Xiemin Liu:Conceptualization,Methodology,Software,Formal analysis,Writing-Original Draft,Investigation.Jing Wan:Data curation,Software.Jinnan Sun:Investigation.Lin Zhang:Resources.Feng Zhang:Conceptualization,Supervision,Writing-review and editing,Resources.Zhibing Zhang:Supervision.Xinyao Li:Supervision.Zheng Zhou:Supervision.
Declaration of Interest
The authors declare that they have no known competing financial interests or personal relationships that could have appeared to influence the work reported in this paper.
Data Availability
Data will be made available on request.
Acknowledgements
The authors are grateful for the financial support of the National Natural Science Foundation of China (21776122).
Nomenclature
a gas-liquid interfacial area,m2∙m-3
C oxygen concentration,mol∙m-3
DLoxygen molecular diffusivity,m2∙s-1
d bubble diameter,m
Eaaeration power,W
Ewmicropore wall resistance power,W
e(λ) mean eddy kinetic energy
ecr(λ) critical eddy kinetic energy
Fmomentum exchange term
fvbreakup volume fraction
g gravity,m∙s-2
kLliquid-side mass transfer coefficient,m∙s-1
P power,W
p pressure,Pa
Q gas volumetric flow rate,m3∙s-1
Uggas superficial velocity,m∙s-1
uvelocity,m∙s-1
V liquid volume,m3
WecWeber numbers
w frequency of collision
χccritical dimensionless energy for breakup
α gas holdup
γ shear strain rate,s-1
ε turbulent energy dissipation rate,m2/s3
λ size of the eddies,m
ν dynamic viscosity,Pa∙s
ρ density,kg∙m-3
σ surface tension,N∙m-1
杂志排行
Chinese Journal of Chemical Engineering的其它文章
- Preparation of PrFexCo1-xO3/Mt catalyst and study on degradation of 2-hydroxybenzoic acid wastewater by catalytic wet peroxide oxidation
- Rational surface charge engineering of haloalkane dehalogenase for boosting the enzymatic performance in organic solvent solutions
- Active MoS2-based electrode for green ammonia synthesis
- Long-term operation optimization of circulating cooling water systems under fouling conditions
- Preparation and properties of high-energy-density aluminum/boroncontaining gelled fuels
- Highly selective extraction of aromatics from aliphatics by using metal chloride-based ionic liquids
