Study of the reaction mechanism for preparing powdered activated coke with SO2 adsorption capability via one-step rapid activation method under flue gas atmosphere
2024-04-22BinxuanZhouJingcaiChangJunLiJinglanHongTaoWangLiqiangZhangPingZhouChunyuanMa
Binxuan Zhou ,Jingcai Chang ,3,* ,Jun Li ,* ,Jinglan Hong ,* ,Tao Wang ,Liqiang Zhang ,Ping Zhou ,Chunyuan Ma
1 School of Environmental Science and Engineering,Shandong University,Qingdao 266237,China
2 School of Energy and Power Engineering,Shandong University,Jinan 250061,China
3 Weihai Research Institute of Industrial Technology of Shandong University,Weihai 264209,China
Keywords: Reaction mechanism Powdered activated coke preparation SO2 adsorption One-step rapid activation Flue gas atmosphere
ABSTRACT In this study,the impact of different reaction times on the preparation of powdered activated carbon(PAC) using a one-step rapid activation method under flue gas atmosphere is investigated,and the underlying reaction mechanism is summarized.Results indicate that the reaction process of this method can be divided into three stages:stage I is the rapid release of volatiles and the rapid consumption of O2,primarily occurring within a reaction time range of 0-0.5 s;stage II is mainly the continuous release and diffusion of volatiles,which is the carbonization and activation coupling reaction stage,and the carbonization process is the main in this stage.This stage mainly occurs at the reaction time range of 0.5-2.0 s when SL-coal is used as material,and that is 0.5-3.0 s when JJ-coal is used as material;stage III is mainly the activation stage,during which activated components diffuse to both the surface and interior of particles.This stage mainly involves the reaction stage of CO2 and H2O (g) activation,and it mainly occurs at the reaction time range of 2.0-4.0 s when SL-coal is used as material,and that is 3.0-4.0 s when JJ-coal is used as material.Besides,the main function of the first two stages is to provide more diffusion channels and contact surfaces/activation sites for the diffusion and activation of the activated components in the third stage.Mastering the reaction mechanism would serve as a crucial reference and foundation for designing the structure,size of the reactor,and optimal positioning of the activator nozzle in PAC preparation.
1.Introduction
The combustion of S-containing fuel results in the emission of SO2,which poses a serious threat to both the environment and health[1-3].At present,the wet flue gas desulfurization(WFGD)is the most popular method for SO2removal,while this technology is facing challenges due to many problems in its running process,such as high consumption of Ca-based absorbents and water,high operating costs,resulting CO2leakage and secondary pollution[4-6].Alternatively,the use of carbon-based adsorbents [7-13]for SO2adsorption technology has been considered a promising updating technology due to its advantages in sulfur recovery,water conservation and multi-pollutant removal.The aforementioned technology has been employed in Europe and Japan for the purpose of flue gas purification,specifically targeting emissions resulting from the combustion of coal and waste[14].
For the AC-FGD technology,the primary obstacle to its industrial implementation is the exorbitant cost of preparation for the AC adsorbent.In general,there are two methods for the preparation of AC,namely physical and chemical methods.The utilization of the latter is restricted owing to the application of chemical reagents[15,16],while the former is extensively utilized due to its relative environmental friendliness and ease of industrial application[17,18].
Physical activation method generally consists of two steps:carbonization process and activation process.Generally,the carbonization process followed by activation process,and there is an AC forming process between the two processes [19].At present,the prevailing method for SO2adsorption involves the use of columnar AC (CAC) with a size of 6 mm × 9 mm,which is typically prepared in this manner.Specific,the materials are initially carbonized in an inert atmosphere at a temperature below 800°C,followed by cooling,screening and forming.Finally,they are activated in an activating atmosphere at a temperature of approximately 700-1000°C.This method is a complex process and its operation cost is high,which leads to the high price of CAC;besides,the activation process is after molding,which is bound to lead to internal and external activation is not uniform,and when the CAC are used for adsorption,the utilization rate of its inner surface is also low.In addition,the CAC products necessitate high levels of hardness to prevent wear and tear.
The activators commonly used in the physical activation method are CO2,H2O (g),O2or their mixtures,and different activation components have different activation effects.Among them,CO2can promote the formation of micropores[20,21];H2O(g)can promote the expansion of micropores,thus increasing the proportion of mesoporous [20,22];and the mixture of the two has a mutually promoting effect [23,24].In addition,it was found that the activation effect was better when CO2or H2O (g) was used as activator and then mixed with low concentration(3%-10%)O2[25,26].As is commonly known,with the exception of N2,flue gas resulting from combustion primarily comprises O2,CO2,and H2O(g),whereby the concentrations of O2and H2O(g)in flue gas can be readily adjusted through injecting air and water.As such,the flue gas from combustion may be deemed a highly effective activating agent.Li et al.[11] demonstrated the feasibility of utilizing flue gas to prepare activated carbon for SO2removal from flue gas,with improved performance observed as coal particle size decreased.Fu et al.[27]and Zhang et al.[28] have demonstrated that the concentration of O2during PAC preparation exerts a significant impact on the pore structure,while water vapor can facilitate O2to regulate the pore structure of PAC.
In order to reduce the preparation cost and overcome the limitations of CAC,a process for the rapid preparation of PAC from pulverized coal using the one-step rapid activation method under the flue gas atmosphere based on entrained-flow bed was proposed,and Fig.1 shows its flow chat.This method has a twostage structure,namely combustion zone and carbonization and activation zone,respectively.At the combustion zone,the fuels are burned to produce high temperature flue gas,which enters into the carbonization and activation zone after adjusting the temperature and component concentration at the ash hopper by spraying air and water.Then at the bottom of the carbonization and activation zone,pulverized coal is injected and mixed with the flue gas,and completing the PAC preparation by going up together for 3-5 s.This process greatly reduces the preparation time of PAC,and at the same time eliminates the molding step of CAC,so the preparation cost is reduced.

Fig.1.Flow chart of the one-step rapid activation method.
For the one-step method proposed in this article,our research group had done a lot of researches.Zhang et al.[29]found that PAC derived from lignite exhibited a high capacity for SO2adsorption but low yield,while PAC derived from bituminous coal had relatively lower SO2adsorption capacity and higher yield.In contrast,anthracite-based PAC demonstrated poor performance in terms of SO2adsorption.In addition,they used the classical optimization method,and found that the reaction temperature,the oxygen concentration and the water vapor concentration had significant effect on the preparation of PAC,and the CO2concentration had little effect [28,30].Wang et al.[31] used different types of coal to prepare PAC and found that the PACs derived from low-rank coals exhibited well-developed pore structures,abundant oxygen-containing functional groups,and high SO2adsorption capacities.Zhou et al.[32,33] used the response surface methodology (RSM) to optimize the preparation parameters of PAC and obtained the best preparation conditions.The basis point of previous researches was always based on the matching between the change of preparation parameters,the change of preparation raw materials and the performance of preparation PAC,but no reasonable explanation was given for its reaction mechanism,resulting in the whole preparation process was always a “black box” state.
In this work,ShengLi lignite(SL-coal)and JinJie bituminous coal(JJ-coal) are utilized as the materials to prepare PAC through the one-step method in a drop-tube reactor (DTR).The impact of varying reaction times on PAC preparation is investigated by altering the residence times of particles in the DTR.Detailed analyses are conducted on burn-off,PAC yield,gas phase product yield and physicochemical properties of corresponding PACs.Finally,the reaction mechanism of the one-step rapid activation method under the flue gas atmosphere was summarized,which would provide reference and basis for the designs of the structure,size of the reactor and the ideal position of the activator nozzle for the PAC preparation.
2.Materials and Methods
In this study,SL-coal and JJ-coal are utilized as the experimental materials for preparing PACs,their proximate and ultimate analysisare presented in Table 1,and the size range of the particles is 60-90 μm.

Table 1 Proximate and ultimate analysis of experimental materials
The experimental system for PAC preparation has been described in detail in our previously published articles (see the studies by Wang et al.[31-33]).In this work,the detailed description is provided in the Supplementary Material.
In this study,the reaction temperature is 950°C,and the reaction atmosphere is a simulated flue gas (6% of O2,12% of CO2,20% of H2O (g) and 62% of N2),and the reaction times are 0.5 s,1.0 s,2.0 s,3.0 s and 4.0 s,respectively.As shown in Fig.S1 in Supplementary Material,it can be achieved to prepare the PACs under different reaction times of 4.0 s,3.0 s and 2.0 s by substituting three water-cooled feed tubes with different sizes.In addition,when the third water-cooled feed tubes(reaction time of 2.0 s) is used,it can be achieved to prepare the PACs under different reaction times of 1.0 s and 0.5 s by adjusting the insertion depth of the water-cooled sampling tube.All the experimental parameters are given in Table 2.In addition,the PAC prepared is named as *-PAC-τ,and “*” is “SL” or “JJ”;and “τ” is the reaction time,which is 0.5 s,1.0 s,2.0 s,3.0 s and 4.0 s,respectively.
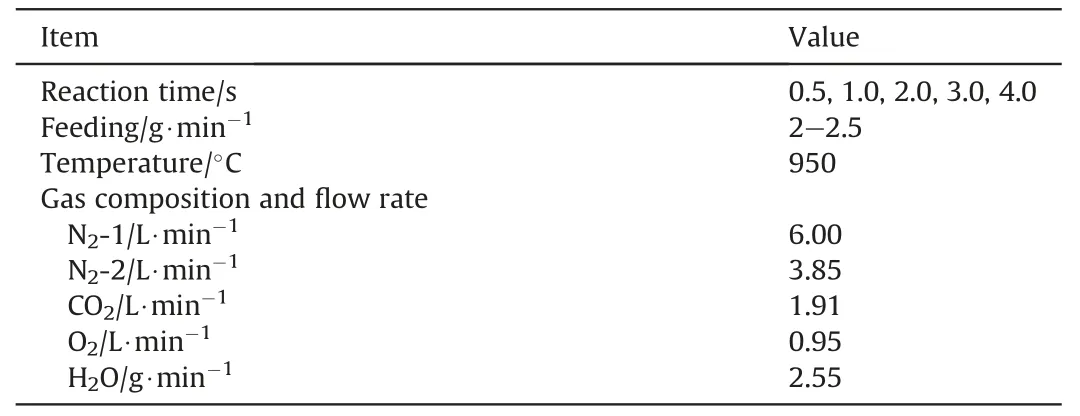
Table 2 Experimental process and parameters
3.Analysis and Characterization
3.1.PAC yield
The yield (Y) of PAC is determined by the ash balance method,which assumes that the absolute amount of ash remains constant before and after the reaction[34,35],and its calculation formula is shown as Eq.(1).
where,A0is the percentage of ash mass of coal(%,dry basis),and Aiis that of PAC (%,dry basis).
Moreover,the burn-off of raw coal in PAC preparation can be divided into two parts:the burn-off of volatile(XV)and the burn-off of fixed carbon(XFC),which can be calculated using Eq.(2)and Eq.(3),respectively.
where,Y is the PAC yield (%).Vcoaland VPACare the percentage of volatile mass of coal and PAC,respectively(%,dry basis).FCcoaland FCPACare the percentage of fixed carbon mass of coal and PAC,respectively(%,dry basis).
3.2.Gas phase product yield
The gas phase products generated during the preparation of PACs are collected in a 1 L gas bag using a suction pump and subjected to qualitative and quantitative analysis using gas chromatography (PE Clarus 580 GC,PerkinElmer,America).
After determining the concentration of components in the gas phase product,the yield of each component in the gas phase product can be calculated using the nitrogen balance method[36,37].This method assumes that the absolute amount of nitrogen remains constant before and after the reaction,as shown in Eq.(4).
where,ηiis the yield of component i (L∙g-1),are the volume flows of nitrogen and component i in the simulated flue gas respectively(L∙min-1),φiandare the volume concentration of component i and nitrogen in the gas phase product respectively(%),M0is the mass flow rate of feed coal (g∙min-1).
3.3.PAC characterization
BET (Brunauer Emmett Teller) is employed for the analysis of pore structure characteristics of PACs;FTIR (Fourier transform infrared spectroscopy)and XPS(X-ray photoelectron spectroscopy)are utilized to investigate the surface chemical properties of PACs;SEM (scanning electron microscope) is applied to observe the surface morphologies of raw materials and PACs.All the detailed test methods and instrument introductions can be found in the Supplementary Material.
3.4.SO2 adsorption capacity of PAC
The SO2adsorption capacities of PACs are tested using a fixed bed SO2adsorption system,which has been described in detail in our previously published articles (see the studies by Wang et al.[31-33]).In this work,the detailed description is provided in the Supplementary Material.
4.Results and Discussion
4.1.PAC yield,burn-off and gas phase product yield
Table 3 presents the proximate analysis of PACs,combining the data in Table 1,the yields of them can be calculated according to Eq.(1),and XV,XFCcan be calculated separately from Eq.(2)and Eq.(3).
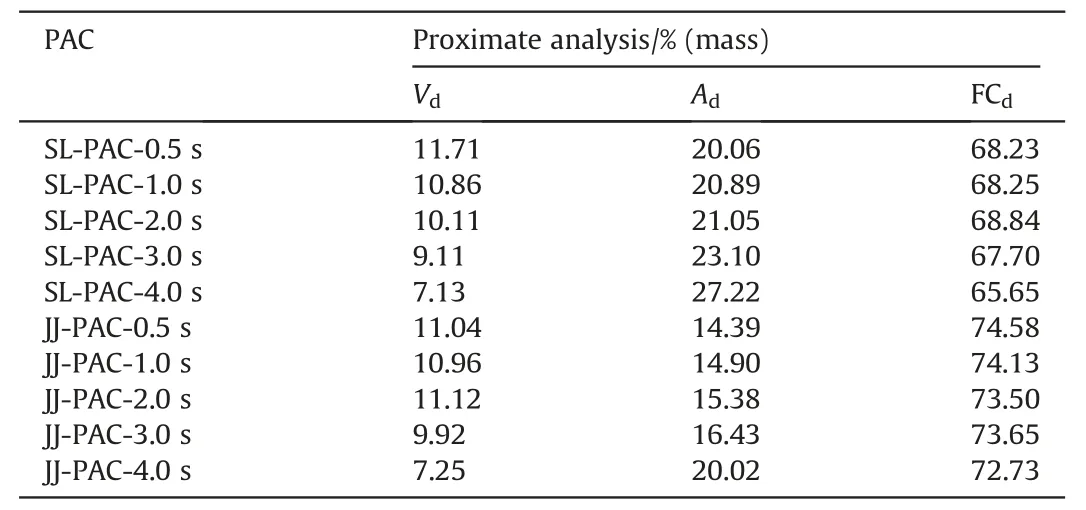
Table 3 Proximate analysis of PACs
The yield of PAC and the degree of burn-off in raw coal under different reaction times are presented in Fig.2.It is evident that as the reaction time prolongs,the yield of PAC gradually decreases.During the preparation process of PAC,most of the volatiles in the pulverized coal have been released within 0.5 s reaction time.As shown in Fig.2,the Xvof SL-PAC-0.5s is 32.89%,which accounts for 80.83% of volatiles of SL-coal;and the Xvof JJ-PAC-0.5s is 28.83%,which accounts for 79.20% of volatiles of JJ-coal.With the extension of reaction time,the volatiles continue to release,and the fixedcarbon is gradually burn-off.As we all know,in the preparation process of AC/PAC,the carbonization process primarily involves the release of volatiles,while the activation process predominantly entails burn-off of fixed carbon [38].It can be inferred that this process using for PAC preparation in this article is a coupling reaction mechanism in which the carbonization process weakens gradually and the activation process strengthens gradually.
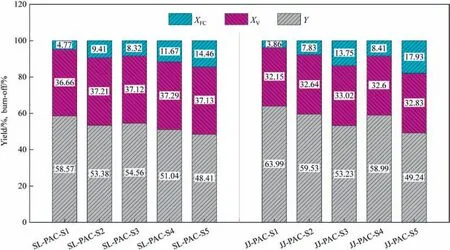
Fig.2.PAC yield and burn-off at different reaction time.
Fig.3 shows the gas phase product yield in PAC preparation process at different reaction times,as shown in it,there is no O2after 0.5 s,that is,O2is rapidly consumed at the initial stage of PAC preparation process.However,as shown the burn-off at the reaction time of 0.5 s in Fig.2 and the gas phase product yield at the reaction time of 0.5 s in Fig.3,the burn-off of fixed carbon is only 1.41% when SL-coal is used for preparing PAC,while the amount of CO2produced is very high,that is,the O2in flue gas are almost consumed by the released volatiles.When JJ-coal is used for preparing PAC,the burn-off of fixed carbon is 2.62% at the reaction time of 0.5 s,higher than 1.41% of SL-PAC-0.5s,which indicates that the O2is not only consumed by the released volatiles,but also is involved in the burn-off of fixed carbon.Analysis of the reasons,when SL-coal is used to prepare PAC,more gas phase products are produced compared with using JJ-coal,which will block the diffusion of O2to the particles,that is,O2will be completely consumed before spreading to the surface of the particles.While when JJ-coal is used,the gas phase products are relatively less,so the obstruction effect is weak.That is,O2can spread to the surface of the particles and ablative some fixed carbon.
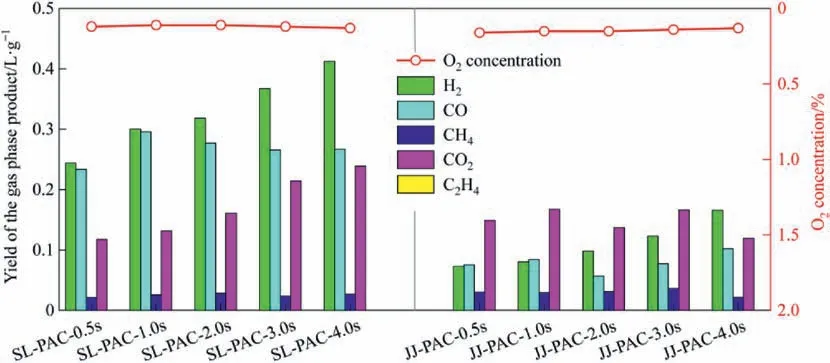
Fig.3.Gas phase product yield at different reaction time.
From the beginning of the reaction,O2is completely consumed within 0.5 s,indicating that CO2and H2O(g)are mainly involved in the activation during the PAC preparation process.However,the presence of O2is also necessary.For SL-coal,O2can rapidly burn off the released volatiles,eliminate their blocking effect,and promote the diffusion of CO2and H2O(g)to the particle surface.For JJ-coal,due to fewer gas phase products,O2has the opportunity to burn the covering layer of particles,which will expose more pores,open up the diffusion channel of CO2and H2O (g) into the particles,and increase the contact surface between CO2,H2O(g)and the particles,thus enhancing the activation effect.
4.2.Structural characterization of samples
The evolution of pore structure during the preparation process of PAC can provide insights into the formation and development mechanism of pores,which are crucial for assessing the properties and adsorption capacities of adsorbent materials [39,40].
Fig.4 shows the pore structure analysis of PACs prepared using SL-coal at different reaction time,comprising the nitrogen adsorption-desorption isotherms (Fig.4(a)),the pore size distributions(Fig.4(b)),and the pore structure parameters(Fig.4(c)and(d)).
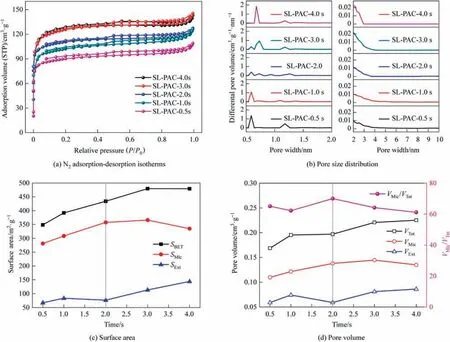
Fig.4.Pore structure analysis of PACs prepared using SL-coal at different reaction time.
According to the IUPAC classification[41],as shown in Fig.4(a),the isotherms of PACs prepared using SL-coal at different reaction times are predominantly type I isotherms,and the existence of hysteresis rings indicates that they also have the characteristics of type IV isotherms,that is,SL-PACs possess primarily microporous structures,while also exhibiting medium and large pore structures.As shown in Fig.4(b),with the extension of reaction time,the micropores gradually expand from 0.54-0.64 nm to 0.68-0.93 nm,while the number of mesoporous pores with a size range of 2-10 nm increases gradually.As shown in Fig.4(c)and(d),with the extension of reaction time,the SBETand VTotof the SL-PACs increase gradually,and the VMic/VTotreaches the maximum at the reaction time of 2.0 s,and then gradually decreases.The preliminary investigation indicates that the carbonization process predominantly induces the development of micropores [25],so in the PAC preparation process using SL-coal,carbonization is the main reaction process for 0-2.0 s.In this stage,the release of volatiles results in the formation of numerous micropores.Simultaneously,the diffusion of volatiles from inside out hinders the inward diffusion of active components,thereby impeding the activation process.During the reaction process of 2.0-4.0 s,the VMic/VTotdecreases significantly,that is,the mesoporous and macroporous structures gradually increase,indicating that the reaction stage of 2.0-4.0 s is dominated by activation process,and the release of volatiles at this stage basically ends,and the influence of preventing the internal diffusion of activated components basically disappears.In addition,the pores formed in carbonization process provide more contact surfaces (activation sites) and diffusion channels for the activation at this stage,thus strengthening the activation effect and further developing the pores,which makes the prepared PACs have relatively developed pore structures.
Fig.5 shows the pore structure analysis of PACs prepared using JJ-coal at different reaction times,comprising the nitrogen adsorption-desorption isotherms(Fig.5(a)),the pore size distributions(Fig.5(b)),and the pore structure parameters(Fig.5(c)and(d)).

Fig.5.Pore structure analysis of PACs prepared using JJ-coal at different reaction time.
According to the IUPAC classification [45],as shown in Fig.5(a),the isotherms of PACs prepared using JJ-coal at different reaction time are mainly type I isotherms,but the desorption line warps and does not coincide with the adsorption line,which indicates that they also have the characteristics of type IV isotherms,that is,the pores of JJ-PACs are mainly microporous,and also have medium and large pore structures at the same time.With the increase in reaction time,as depicted in Fig.5(b),there is a gradual rise in the distribution of micropores within the range of 0-2.0 nm,while the distributions of medium and large pores between 2 and 100 nm gradually decrease.When the reaction time reaches 4.0 s,these distributions almost vanish.That is,when JJ-coal is utilized as the raw material for PAC preparation,the development of pores in JJ-PAC primarily shifts from medium and large pores to micropores with an increase in reaction time.As shown in Fig.5(c) and (d),the proportion of micropores exhibits a gradual increase during the reaction process,indicating the directional evolution of pores.Besides,from Fig.5(c) and (d),the SBETand VTotof the JJ-PAC increase gradually during the reaction process from 0 to 3.0 s,which is different from the SL-PAC.This stage should be the stage of simultaneous carbonization and activation processes.That is because the decomposition and release of gas phase products are relatively few during PAC preparation using JJ-coal (as shown in Fig.3),which will have a weak obstruction to the diffusion of activated components towards the particle surface,that is,some activated components can be diffused to the particles from the beginning of the reaction,so the carbonization and activation processes should be carried out simultaneously in this stage.During the reaction process of 3.0-4.0 s,pore structure parameters increase significantly,and the burn-off of fixed carbon at this stage is also relatively high (as shown in Fig.2),which indicates that the activation effect is relatively obvious at this stage.The reasons are that the release of volatiles has basically ended at this stage,and the obstruction of gas phase products to the inward diffusion of activated components basically disappears.Besides,in the previous stage (0-3.0 s),the JJ-PAC has relatively developed pores,which provides the contact surface (activation site) and diffusion channel for the subsequent activation reaction.Therefore,the activation effect is significantly improved,the pores are significantly increased,and the burn-off of fix carbon is also significantly increased.
4.3.Analysis of surface chemical characterization
The surface functional groups of AC play a crucial role in the adsorption of SO2,particularly those containing O-containing functional groups that possess more active adsorption sites[14,42,43].The changes in surface chemical properties during the preparation process of PACs can aid in elucidating the evolution pattern of surface functional groups.
In this study,the surface functional groups of all PACs are characterized using FTIR,as shown in Fig.6.From the multitudinous peaks observed in these spectra,one can intuitively infer that PACs possess a diverse range of surface functional groups.The derived FTIR spectra can be interpreted based on four main bands,which include the hydroxyl groups(-OH)within the wave number range of 3200-3700 cm-1;the aliphatic groups(-CH)in the range of 2800-3000 cm-1;the oxygen-containing groups(C=O and C-O)in the range of 1300-1800 cm-1;and finally,the C-O-C and C-N groups in a specific frequency range.As depicted in Fig.6(a),the aliphatic absorption peak gradually diminishes during the reaction process when SL-coal is utilized as a raw material for PAC preparation.This phenomenon indicates that volatiles are progressively released with an increase in reaction time.However,the absorption peak gradually disappeared after a reaction time of 2.0 s,indicating that the release of volatiles was essentially complete and thus the carbonization process had been accomplished,which is consistent with the aforementioned analysis results.Additionally,the changes in functional groups of other bands were not discernible with prolonged reaction time.This also held true for JJ-coal as the raw material (as shown in Fig.6(b)).

Fig.6.FTIR spectra of PACs.
In addition,XPS spectra can be used to further investigate the distribution and evolution of O-containing and C-containing functional groups on PACs’ surface prepared at different reaction times.According to the literature,different peak positions in XPS spectra represent different types of functional groups,and the fitted peak area represents their relative content.With the help of XPSPEAK41 software,the O 1s spectrum can be resolved into three peaks,and the C 1s spectrum can be resolved into five [33,44].The deconvoluted O 1s spectra and C 1s spectra of all the PACs are shown in Figs.S1-S4 in the Supplementary Material.
Fig.7 shows the distributions of O-containing groups of all the PACs,and as can be seen from it,as the reaction process progresses,when SL-coal is used as the raw material,the O-containing functional groups on the surface of SL-PACs gradually evolve to the C-O functional groups;while when JJ-coal is used as raw material,they gradually evolve to the C=O functional groups.According to the literature,C-O functional groups can provide a greater number of active sites,thereby enhancing SO2adsorption.This is one of the reasons why the PAC prepared from SL-coal showed better SO2removal performance than that from JJ-coal,as shown in Section 4.4.
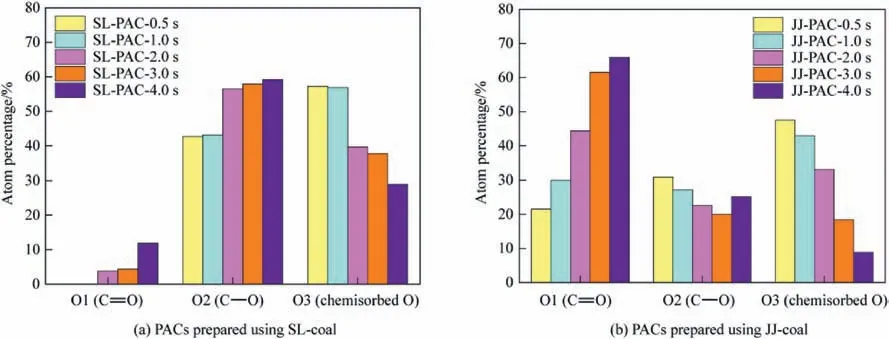
Fig.7.Distributions of O-containing groups of PACs.
Fig.8 shows the distributions of C-containing groups of all the PACs,and as can be seen from it,as the reaction process progresses,the relative content of graphite carbon(C-C)represented by C1 in the PACs gradually increases,indicating that the degree of graphitization of PAC gradually enhanced with the extension of reaction time.That is,the PAC is becoming more and more stable,and is basically stable at the reaction time of 3-4 s.Besides,the other C-functional groups represented by C2-C5 in the PACs show a gradually decreasing trend with the extension of reaction time,and the decreasing trends of them are also basically stable at the reaction time of 3-4 s.

Fig.8.Distributions of C-containing groups of PACs.
4.4.SO2 adsorption of PACs
The primary performance indicator for evaluating PAC is its SO2adsorption capacity.Fig.9 illustrates the SO2breakthrough curves and the corresponding SO2adsorption capacities of the SL&JJ-PACs prepared at varying reaction times,and the adsorption capacities of SO2exhibit a gradual increase with prolonged reaction time,as evidenced by the observations.When the PAC preparation time gradually increases from 0.5 s to 1.0 s,2.0 s,3.0 s and finally to 4.0 s using SL-coal as raw material,the SO2adsorption capacities of SL-PACs for 2 h are 80 mg∙g-1,86 mg∙g-1,99 mg∙g-1,101 mg∙g-1and 106 mg∙g-1,respectively;similarly when JJ-coal is used as raw material the SO2adsorption capacities of JJ-PACs for 2 h are found to be 40 mg∙g-1,45 mg∙g-1,50 mg∙g-1,53 mg∙g-1and 56 mg∙g-1,respectively.
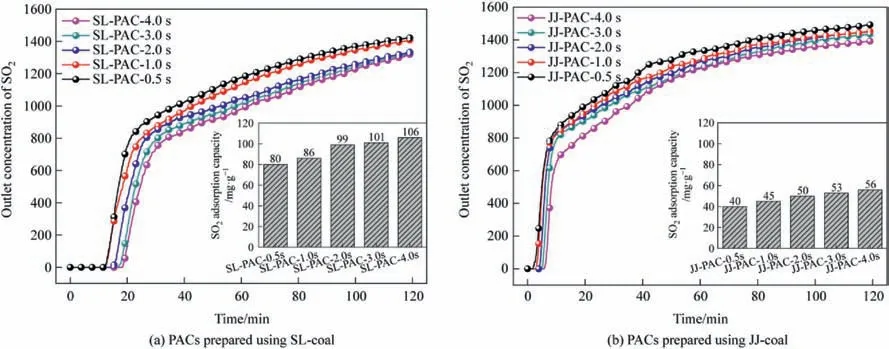
Fig.9.SO2 breakthrough curves and SO2 adsorption capacities of PACs.
4.5.Balance calculation of two-step rapid pyrolysis activation method
By summarizing the research contents of Sections 4.1-4.4,it can be inferred that the reaction mechanism for preparing PAC through the one-step rapid activation method under flue gas atmosphere can be obtained,as shown in Fig.10.The entire reaction process can be divided into three stages as follows:
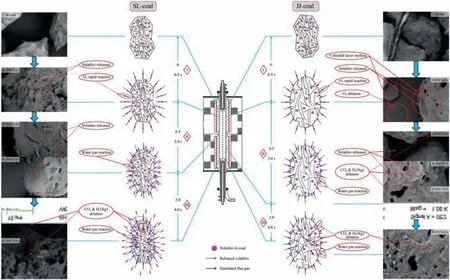
Fig.10.Reaction mechanism of PAC preparation through the one-step rapid activation method under the flue gas atmosphere.
Stage I is the rapid release of volatiles and the rapid consump tion of O2.When the raw material entered the effective reaction zone,due to the high heating rate (about 103K∙s-1[45]),most of the volatiles (about 80.83% of SL-coal and about 79.20% of JJ-coal)were released within 0.5 s reaction time (as shown in Fig.2),and they decomposed simultaneously,and the main decomposition products were H2,CO,CO2,CH4,etc.(as shown in Fig.3).In addition,there was almost no O2in the gas phase products at the reaction time of 0.5 s (as shown in Fig.3),indicating that the O2in the flue gas was consumed within 0.5 s reaction time.Besides,based on different types of coal,the effect of O2was slightly different.As shown in Fig.9,during the reaction time of 0-0.5 s,when SL-coal was used to prepare PAC,due to its high content of volatiles,more gas phase products were released and decomposed,which were diffused from inside to outside,thus preventing the outward-inside diffusion of activation components.While the O2would react with some gas phase products to form CO2and H2O,which would weaken the obstruction of gas phase products to the activation components diffusing from outward to inside.When JJ-coal was used to prepare PAC,due to its weak bonding property and the presence of the colloidal layer,the preparation process would be accompanied by a series of changes in the softening,melting,expansion,condensation and solidification of the colloidal layer,so its particle morphology changed from the irregular shape of raw coal to ellipsoid/spheroid,as shown by the SEM of JJ-PAC-0.5 s in Fig.9.In addition,when JJ-coal was used,the gas phase products were relatively less,as shown in Fig.3,which would have a relatively weak obstruction to the diffusion of activation components to particles.And at the same time part of O2would have a chance to spread to the surface of particles and part of C would been burned off,as shown by the SEM of JJ-PAC-0.5 s in Fig.9,there was a large area of local ablation on the surface of particles.This would expose some pores that had been blocked by the colloidal layer,which would provide diffusion channels and activation sites for the subsequent activation.
Stage II is mainly the continuous release and diffusion of vola tiles,which is the carbonization and activation coupling reaction stage,and the carbonization process is the main in this stage.When SL-coal was used to prepare PAC,the stage II mainly occurred in the reaction period of 0.5-2.0 s,during which the burn-off of fixed carbon and volatile increased gradually,indicating that the carbonization process and activation process proceed simultaneously.However,due to the internal and external diffusion of volatile products,the diffusion of activated components to the surface and interior of the particles was hindered.When the reaction time reached 2.0 s,the burn-off of fixed carbon was only 3.14% (as shown in Fig.2),indicating that the activation process at this reaction stage was relatively weak.In addition,previous studies had found that the carbonization process mainly leads to the formation of micropores [25],and as shown in Fig.4(d),the VMic/VTotof SL-PAC gradually increased during the period from 0.5 to 2.0 s,and when the reaction time reached 2.0 s,it reached its maximums,about 70.0%.This meant that the carbonization process mainly occurred during the period of 0.5-2.0 s when SL-coal was used to prepare PAC.And as shown in Fig.9,the surface morphology of SL-PAC-1.0s and SL-PAC-2.0s showed that the pores formed on their surfaces were mostly aperture or circular pores,which was mainly caused by the release of volatiles.That is,no obvious activation effect was shown in this reaction stage.When JJ-coal was used to prepare PAC,the stage II mainly occurred in the reaction period of 0.5-3.0 s.Similarly,the burn-off of fixed carbon and volatiles in this reaction stage increased gradually,as shown in Fig.2.Although there were relatively few gas phase products during its preparation process,the release process still hindered the diffusion of activated components.In addition,due to the melting of its colloidal layer,the particles themselves had relatively few pores,as a result that they had relatively few contact surfaces with the activated components,so the activation effect was relatively weak.As shown in Fig.5(c) and (d),the evolution rate of pores in this reaction stage was slow,reflecting that the activation process had not been fully carried out.Besides,the surface morphology of JJ-PAC-1.0s and JJ-PAC-2.0s in Fig.9 showed that the pores on their surface were mostly formed because of the release of volatiles.When the reaction time reached 3.0 s,the surface of JJ-PAC-3.0s began to show obvious ablation,indicating that the carbonization process basically ended and the activation process began to take place deeper.
Stage III is mainly the activation stage,during which activated components diffuse to both the surface and interior of particles,that is,the carbonization process has essentially concluded and the reaction stage is now dominated by the activation process.When SL-coal was used to prepare PAC,the stage III mainly occurred from 2.0 s to 4.0 s.Firstly,the burn-off of fixed carbon significantly increased,and it increased from 3.14% at 2.0 s to 7.76% at 3.0 s and 14.46% at 4.0 s,as shown in Fig.2.Secondly,the micropore volume ratios (VMic/VTot) of the corresponding PACs gradually decreased from 70.0% at 2.0 s to 64.2% at 3.0 s and 61.2% at 4.0 s,as shown in Fig.4(d),indicating that because of the active components the ablation of the surface and inside of the particles led to the increases of pores and the proportion of medium and large pores,simultaneously.In addition,as shown in Fig.9,the surface morphologies of SL-PAC-3.0s and SL-PAC-4.0s showed that the surface pores increased significantly,reflecting a good activation effect at this stage.When JJ-coal was used to prepare PAC,the stage III mainly occurred from 3.0 s to 4.0 s.According to the stage II,there was an obvious activation reaction when the reaction reached 3.0 s,and the first two stages made the particles form a certain number of pores,which could provide sufficient diffusion channels and activation sites/contact surfaces for the activation of CO2and H2O(g)in the stage III,thus promoting the activation process.As a result,the burn-off of fixed carbon increased significantly in this reaction stage,it increased from 9.55% at 3.0 s to 17.93% at 4.0 s,as shown in Fig.2;and the pores of JJ-PACs increased significantly,as shown in Fig.5(c) and (d).
5.Conclusions
In this work,SL-coal and JJ-coal are used as raw materials to prepare PACs through the one-step rapid activation method under flue gas atmosphere,and the effects of different reaction times on PAC preparation are investigated,and the burn-off,the PACs yield,the gas phase products yield and the physicochemical properties of the corresponding PACs are analyzed.Ultimately,a summary is provided regarding the reaction mechanism for this method.The main conclusions are as follows:
(1) The reaction process of the one-step rapid activation method under flue gas atmosphere can be divided into three stages:stage I is the rapid release of volatiles and the rapid consumption of O2;stage II is mainly the continuous release and diffusion of volatiles,which is the carbonization and activation coupling reaction stage,and the carbonization process is the main in this stage;stage III is mainly the activation stage,during which activated components diffuse to both the surface and interior of particles,it is mainly the reaction stage of CO2and H2O (g) activation.Besides,the main function of the first two stages is to provide more diffusion channels and contact surfaces/activation sites for the diffusion and activation of the activated components in the third stage.
(2) The stage I mainly occurs in the reaction time of 0-0.5 s,the O2in the flue gas is consumed within 0.5 s reaction time,and based on different types of coal,the effect of O2is slightly different.For SL-coal,the O2can react with some gas phase products to form CO2and H2O,which will weaken the obstruction of gas phase products to the activation components diffusing from outward to inside.For JJ-coal,because the gas phase products are relatively less,there will have a relatively weak obstruction to the diffusion of activation components to particles.So,the O2can have a chance to spread to the surface of particles and part of C can been burned off,which will expose some pores that have been blocked by the colloidal layer,which will provide diffusion channels and activation sites for the subsequent activation.
(3) The stage II and stage III are divided differently based on different types of coal.For SL-coal,the stage II mainly occurs in the reaction times of 0.5 s-2.0 s,and the stage III mainly occurs in the reaction times of 2.0 s-4.0 s.For JJ-coal,the stage II mainly occurs in the reaction times of 0.5 s-3.0 s,and the stage III mainly occurs in the reaction times of 3.0 s-4.0 s.
(4) Within the reaction times of 0-4.0 s,the SO2adsorption performances of the corresponding PACs exhibit a gradual increase with prolonged reaction times.When the PAC preparation time gradually increases from 0.5 s to 1.0 s,2.0 s,3.0 s and finally to 4.0 s using SL-coal as raw material,the SO2adsorption capacities of SL-PACs for 2 h are 80 mg∙g-1,86 mg∙g-1,99 mg∙g-1,101 mg∙g-1and 106 mg∙g-1,respectively;similarly when JJ-coal is used as raw material the SO2adsorption capacities of JJ-PACs for 2 h are found to be 40 mg∙g-1,45 mg∙g-1,50 mg∙g-1,53 mg∙g-1and 56 mg∙g-1,respectively.
Declaration of Interest
The authors declare that they have no known competing financial interests or personal relationships that could have appeared to influence the work reported in this article.
Acknowledgements
This work was supported by the Qingdao Postdoctoral Program Funding (QDBSH20220202045),Shandong provincial Natural Science Foundation (ZR2021ME049,ZR2022ME176),National Natural Science Foundation of China(22078176)and Taishan Industrial Experts Program (TSCX202306135).
Supplementary Material
Supplementary data to this article can be found online at https://doi.org/10.1016/j.cjche.2023.07.012.
杂志排行
Chinese Journal of Chemical Engineering的其它文章
- Flower-like tin oxide membranes with robust three-dimensional channels for efficient removal of iron ions from hydrogen peroxide
- Experimental study on the activation of coal gasification fly ash from industrial CFB gasifiers
- Enhanced stability of nitrogen-doped carbon-supported palladium catalyst for oxidative carbonylation of phenol
- Solubility of iron(III) and nickel(II) acetylacetonates in supercritical carbon dioxide
- Filtration performance and modeling of granular bed for dust removal from coal pyrolytic vapors
- Copper slag assisted coke reduction of phosphogypsum for sulphur dioxide preparation
