Filtration performance and modeling of granular bed for dust removal from coal pyrolytic vapors
2024-04-22ShuaiqiangYangLinDuGuangchaoDingRunguoLiuWenliSongSonggengLi
Shuaiqiang Yang,Lin Du,Guangchao Ding,Runguo Liu,Wenli Song,3,Songgeng Li,3,*
1 State Key Laboratory of Multiphase Complex Systems,Institute of Process Engineering,Chinese Academy of Sciences,Beijing 100190,China
2 School of Petrochemical Engineering,Yan’an Vocational and Technical College,Yan’an 716000,China
3 Sino-Danish College,University of Chinese Academy of Sciences,Beijing 100049,China
Keywords: Granular bed filtration Dust removal Pyrolysis Filtration Fixed-bed
ABSTRACT Dust removal from pyrolytic vapors at high temperatures is an obstacle to the industrialization of the coal pyrolysis process.In this work,a granular bed with expanded perlites as filtration media was designed and integrated into a 10 t∙d–1 coal pyrolysis facility.The testing results showed that around 97.56% dust collection efficiency was achieved.As a result,dust content in tar was significantly lowered.The pressure drop of the granular bed maintained in the range of 356 Pa to 489 Pa.The dust size in the effluent after filtration exhibited a bimodal distribution,which was attributed to the heterogeneity of the dust components.The effects of filtration bed on pyrolytic product yields were also discussed.A modified filtration model based on the macroscopic phenomenological theory was proposed to describe the performance of the granular bed.The computation results were well agreed with the experimental data.
1.Introduction
Low rank coal contains high volatiles,which can be extracted through pyrolysis and further converted into value-added gas and oil products.The remaining char is considered much cleaner than the parent coal since there are relatively less sulfur and nitrogen left.There has been a growing trend that the pyrolysis based coal utilization route is an efficient,clean and low-carbon process in comparison with direct combustion[1,2].Accordingly,a pyrolysis based poly-generation technical route on low rank coal utilization has triggered increasing interests from both academic and industrial niches,especially in China where the gas and oil reserves are scarce[3].Various conversion technologies,such as circulating fluidized bed (CFB) downer pyrolysis [4],kiln pyrolysis [5],fluidized bed pyrolysis[6]and moving bed pyrolysis[7]were demonstrated in the last decades.Although much progress has been achieved,few realized a commercial operation.A technical challenge for the deployment on an industrial scale is thein-situdust removal from pyrolytic volatiles.The entrained dust in tar generated from coal pyrolysis would not only increase the difficulties in the subsequent transformation into oils and chemicals,but also incur abnormal operations of the entire system due to pipe blocking [8–11].Therefore,it is significant importance to develop an efficient and reliable technology for thein-situremoval of dust particles from pyrolytic volatiles.
At present,there are many types of dust removal technologies[12],such as cyclone separators [13–16],granular bed filters [10],and electrostatic precipitators [17].Granular bed filtration is a promising technology for the dust removal from hightemperature pyrolytic volatiles due to its advantages of high efficiency,easy regeneration,simple operation and low cost.There are various configurations of granular bed for filtration,generally categorized into fixed bed and moving bed [18,19].Characteristic operating parameters,such as gas velocity,dust concentration,bed thickness and types of granules are considered important factors that governing collection efficiency and pressure drop[20–25].Though there are extensive studies in regard to granular bed filtration,it is worth mentioning that most of these studies were conducted at facilities derived from a cold module [21,26–33].Apparently,cold model tests cannot fully describe and represent the performance at practical facilities running at high temperatures,however,reports from actual hot test facilities are rare.Yanget al.[34] evaluated the filtration performance of a moving granular bed for pyrolytic volatiles from biomass.The results showed that the collection efficiency approached 98%.Zhanget al.[35]carried out a series of lab-scale experiments to study the dust removal from coal pyrolytic vapors.These limited results are good references to the application of granular bed filtration in the pyrolysis process.
The dust trapping mechanism of granular bed is complex.Besides interception [36,37],inertial collision [36,38],sedimentation [36,37],and Brownian diffusion [36,38,39],the adsorption and coking of the dust-laden tar can occur on the granular bed for the filtration of pyrolytic vapors [11].Researchers figured out varieties of mathematical models to describe the deposition of fine particles on filtration media and predict the granular bed performance [21,40].Two fundamental regimes were proposed.One is based on the filtration mechanisms,namely microscopic method,focusing on the development of sophisticated mathematical models including two-dimensional and three-dimensional formulas to capture the detailed physical features of the process[10].The other attempts to describe the dynamic behavior of granular bed filtration from macroscopic phenomenological perspective [10].Tien and Ramarao [41] summarized the models from both microscopic and macroscopic aspects comprehensively.Due to the complexity of the filtration process,the models still remain at a semiempirical stage.Moreover,the accuracy and reliability of these models need to be verified when apply to the dust removal from pyrolytic vapors in consideration of the confined accessibility of hot test data.
In this study,a fixed granular bed filter (GBF) was tested at a 10 t∙d–1pilot-scale CFB downer pyrolysis facility.Collection efficiency and pressure drop at different operating conditions were compared.The effects on the pyrolysis products were systematically evaluated.To facilitate a practical design of GBF,a modified filtration model based on the macroscopic phenomenological theory was proposed to predict the filtration performance.
2.Materials and Methods
2.1.Materials
A bituminous coal was used for the pyrolysis tests in this study,sourced from Shaanxi Province,China.It was ground and sieved to particle sizes around 4 mm on average and dried prior to pyrolysis.The proximate and ultimate analyses were performed according to GB/T 212—2008 and GB/T 31391—2015[42].The analytical results are shown in Table 1.

Table 1 Proximate and ultimate analyses of coal samples
Expanded perlites were used as filtration media for GBF considering its inert nature,high-temperature resistance,availability,and low cost.The relevant parameters of the materials are shown in Table 2.

Table 2 Parameters of filtration media
2.2.Experimental apparatus
A fixed filtration bed filter (Fig.S6,in Supplementary Material)was designed and integrated into 10 t∙d–1downer pyrolysis facility,as shown in Fig.1.The two filtration beds were implemented in pairs and operated alternatively for continuous filtration.The duration of filtration was set to 5 min for one cycle and then switched to regeneration mode,which lasted for 30 s with a reversed flow of steam purging out the dust accumulated in the bed.Upon regeneration,the pyrolytic vapor stream was directed into the other bed for filtrationviaadjusting pneumatic valves automatically.For the pyrolysis process,hot ash generated in a CFB combustor was used as a heat carrier to provide the required energy for the reaction.The remaining char discharged from the downer pyrolyzer was circulated into the CFB riser for combustion.A cyclone was installed in the upstream of the filtration bed as the preprocessing step for dust removal.The temperature of the filtration bed was maintained at around 400–450 °C.Differential pressure sensors were installed at the inlet and outlet of the GBF to monitor the pressure drop of the bed.The pyrolytic volatiles were simultaneously sampled from the inlet and outlet of the GBF to evaluate the filtration performance according to the isokinetic sampling principle (sampling system,shown in Supplementary Material).The duration of sampling was 1 h.The condensable gases from the sampling were captured by a cold trap.The incondensable gases were collected with a gas bag for the gas composition analysis.
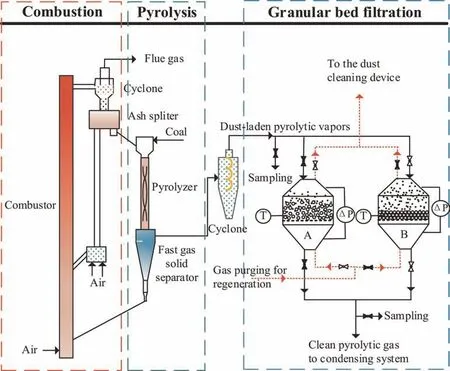
Fig.1.Schematic diagram of a 10 t∙d–1 CFB coal downer pyrolysis facility with an integrated granular bed filtration.
2.3.Collection efficiency determination and pyrolytic product analyses
Collection efficiency was calculated as:
wherecinandcoutrefer to the concentration of dust at the inlet and outlet of GBF,which are determined through the isokinetic sampling equipment.
The particle size was determined with a laser particle size analyzer (Mastersize 2000,Malvern,Britain).A gas chromatograph(GC-2014,Shimadzu,Japan) was employed to analyze gas composition,which was calibratedviathe external standard method to quantify the gas components.The water content in tar was determined by a volumetric Karl Fisher titrator (KFT,Mettler Toledo V20,Switzerland).The yields of condensable and incondensable pyrolytic products were calculated as:
whereYiandWiare the yield and mass of pyrolytic product.Wcoalis the mass of coal.
Surface morphologies were characterized by a field-emission scanning electron microscopy (SEM,GeminiSEM 300,Zeiss,Germany).
The dust in tar was expressed as toluene-insoluble matter[43].The amount of toluene-insoluble matter was determined by Soxhlet extraction [43].
3.Mathematical Model
A filter bed with a depth ofLcan be considered an assembly of many sequential unit bed elements.The relationship between the unit collection efficiency (η) and the total collection efficiency (E)can be expressed as [35]
wheredgis the filter-grain diameter,Lis the filter height,ε is the filter porosity.
Unit collection efficiency can be written as a function of specific deposit (σ) [44]
where σ is defined as the volume of dust particles occupied per unit volume of bed.ƞ0is the initial collection efficiency of individual collector.F(σ)is the correcting factor and used to account for the effect of dust deposition.
Substituting Eq.(4) into Eq.(3),gives Eq.(5):
In consideration of the mechanisms of interception,inertial impaction and the rebound effect of dust particles,a model proposed by Junget al.[45] was adopted to determine the initial collection efficiency (ƞ0):
whereNReis Reynolds number,NRis the interception number,Nstis Stoke number,γ is the adhesion probability,Nsteffis the effective Stoke number,Asis the relevant parameter.
The pressure drop across filtration bed is given as:
where ΔP0can be determined by Ergun equation.kis a constant.
4.Results and Discussion
4.1.Determination of F(σ)
F(σ)reflects the capacity of the filter to collect particles.Walataet al.[46] suggests:
where α1,α2is the coefficient.
The definition for the average specific deposit is as follows:
where ρpis the density of the dust,ugis the superficial gas velocity,andtis the filtration time.
For the experiments performed in this work,the sizes of fine dusts (~12 μm on average) were much larger than the ones(~2.02 μm) employed by Walataet al.[46] Moreover,the influent concentration was higher.Thus,dust deposition significantly reduces the bed porosity as the filtration time increases,subsequently affecting the collection efficiency.Hence,an effective specific deposit σeffis suggested to replace σ,taking the effect of bed porosity into account,which is defined as:
Thus,Eq.(12) can be rewritten as:
where α1and α2are expressed as a function ofNst,which is determined through data fitting (shown in Supplementary Material),given as the following:
It is worth mentioning that the correlation coefficients(Table S4)obtained by fitting Eq.(12)were much lower than those(Table S3)viathe modified model (Eq.(15)).It indicates that the modified model of Eq.(15) is more reasonable to describe the GBF performance.In other words,the effect of bed porosity cannot be ignored in this work.
Similarly,considering the influence of bed porosity,Eq.(11) is modified as:
wherekis obtained through data fitting (Fig.S4)
With the known operation conditions and the properties of gas and solid,Eand ΔPcan be calculated from Eq.(5) and Eq.(18),respectively.
4.2.Model validation
In order to validate the model,the experimental data resulted from the cold tests both in this work (displayed in Supplementary Material)and literatures with different filtration media were compared with the calculated results,as shown in Figs.2–5.
Fig.2 shows the variations of the collection efficiency and pressure drop with superficial gas velocity.A low superficial gas velocity corresponds to a low kinetic energy of the dust particles.Rebounding of the dust particles from filtration media tends to become strong with an increasing of superficial gas velocity,thus the dust particles have increasing tendency to escape from the bed.Undoubtedly,the increase in bed thickness makes the dust particles difficult to be entrained out.Pressure drop increased with superficial gas velocity since the resistance through the bed was elevated.Fig.3 presents the variations of the collection efficiency and pressure drop with filtration time.Both showed increasing trends with time.The expanded perlite exhibited a slightly higher efficiency than that of ceramic ball,which could be attributed to its irregular shape and surface structure.The SEM images of perlite and ceramic ball are shown in Fig.4.The surface of ceramic ball is relatively flat,and the surface of perlite is almost honeycomb structure.The dust is more likely to be trapped by the honeycomb structure of perlite.The irregular shape and surface structure of perlite always leads to high voidage.Thus,it enables a relatively lower pressure drop.The effects of inlet dust concentration on pressure drop and collection efficiency are given in Fig.5.Collection efficiency showed a slightly decrease with an increasing of dust concentration.In contrast,the pressure drop revealed a significant rise as the dust concentration was augmented.This is mainly due to the increase in inlet dust concentration,which increases the amount of dust deposited in the bed.The dust captured by the bed may be entrained by the gas again,resulting in a slight decrease in collection efficiency.The increase in the amount of dust in the bed causes an increase in the resistance of the bed[47,48],resulting in a significant increase in pressure drop with increase of dust concentration.The data in literature [10,49] was also used to verify the accuracy of the proposed model (Fig.S5).The error between the experimental and calculated values is less than 1%.Consequently,the calculated results are well in an agreement with the experimental data.
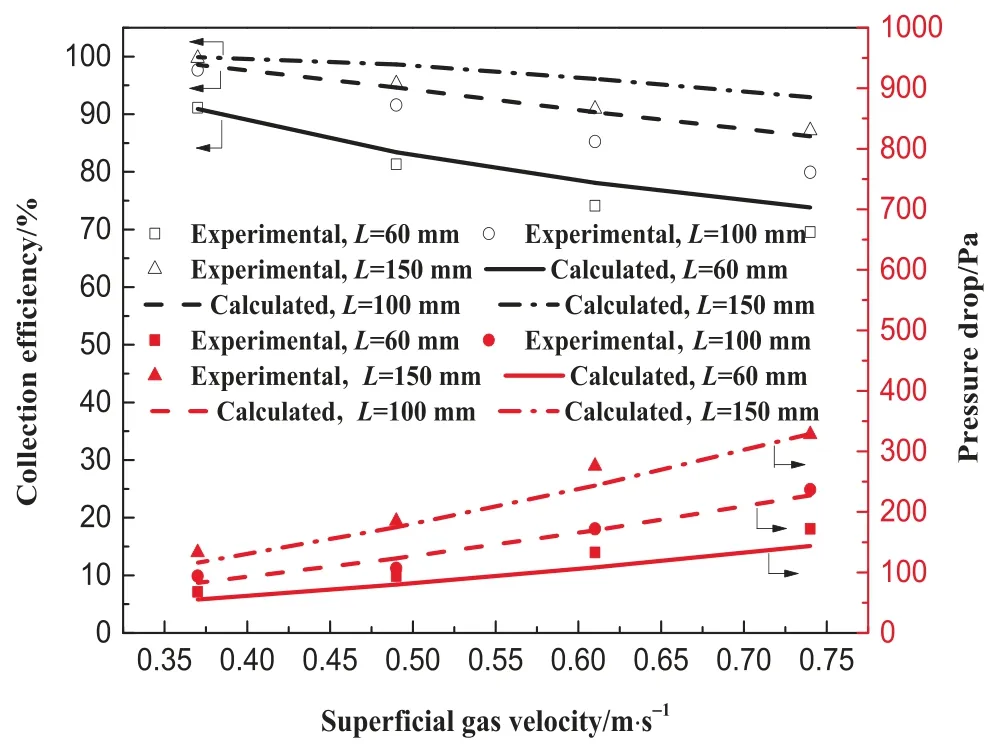
Fig.2.Collection efficiency and pressure drop as a function of superficial gas velocity (cin=3 g∙m-3).

Fig.3.Collection efficiency and pressure drop as a function of filtration time.
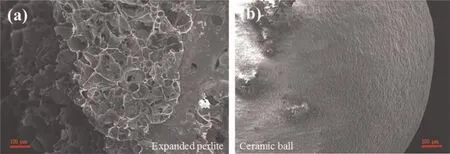
Fig.4.SEM images of expanded perlite and ceramic ball.

Fig.5.Collection efficiency and pressure drop as a function of inlet dust concentration.
4.3.Hot tests in a 10 t∙d–1 pyrolysis facility
4.3.1.Determination of the filtration bed thickness
The granular bed thickness is a crucial factor that influences the collection efficiency.Fig.6 gives the prediction of the collection efficiency with different bed thickness under hot conditions.It is interesting to note that there existed an inflection point with gas velocity increased,which was located at the velocity of 0.27 m∙s-1,corresponding to the effective Stokes number of 1.2.It is generally agreed that the secondary entrainment caused by the inertial collision of fine dusts with filtration granules can be ignored when effective Stokes number is less than 1.2.As the gas velocity further increased,the secondary entrainment owing to the inertial collision became pronounced [41,46].Thus,the correlation between gas velocity and collection efficiency appears an opposite trend before and after the critical point (0.27 m∙s-1).However,with the increasing of bed thickness,the effect of gas velocity turned into weak.Especially for the bed thickness of 200 mm,no obvious difference in collection efficiency was observed under the gas velocities examined.It is rational since the bed is thick enough to re-capture the escaped dust particles.Accordingly,the bed for the hot test facility was designed at 200 mm in thickness to avoid the dramatic drop in efficiency due to the load change.

Fig.6.Collection efficiency as a function of gas velocity (conditions: T=460 °C,cin=6.4 g∙m-3, t=3600 s, dp=11.9 μm).
4.3.2.Filtration performance
The dust particle size distribution at the GBF inlet is shown in Fig.7.It displayed a broad distribution with a median particle size of 11.9 μm,and 90% of the influent dust were less than 53 μm.
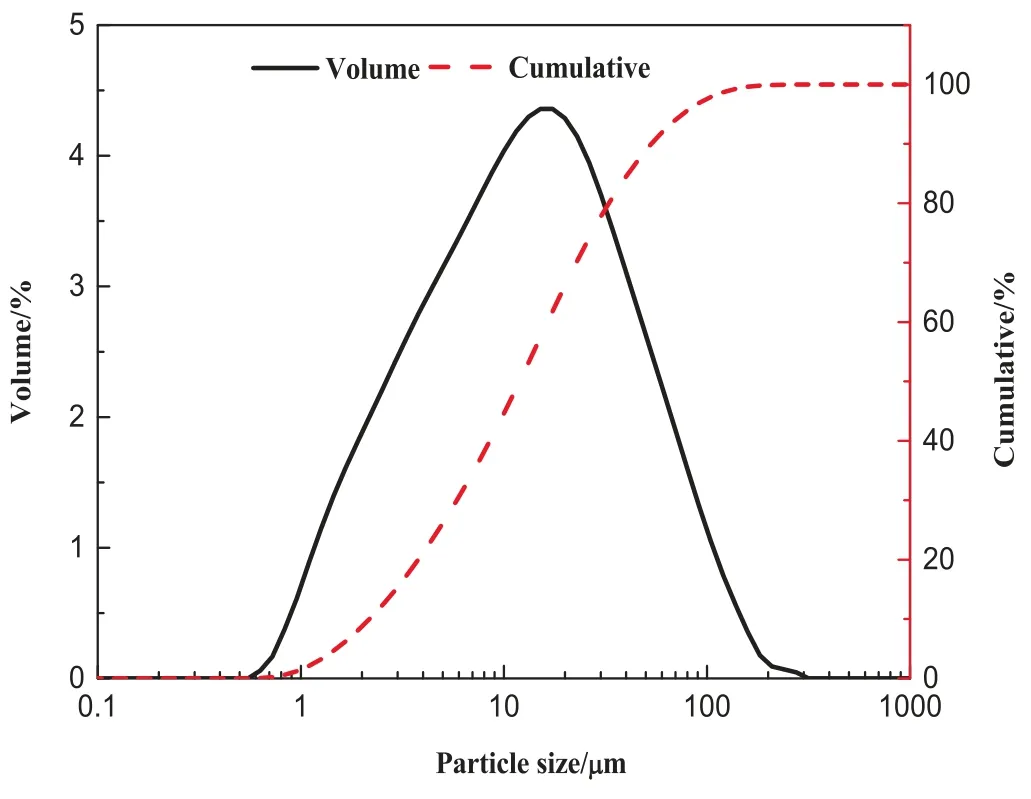
Fig.7.Influent dust particle size distribution.
Fig.8 presents the fluctuations of the inlet pyrolytic gas temperature and the bed temperature with time.It can be seen that the inlet temperature was controlled at 460 °C.And it dropped to 415 °C in the bed due to heat loss.The maximum pressure drop varied from 356 Pa to 489 Pa (Fig.9) for a single filtration stage.After 5 min filtration,the bed was purged with steam to purge out the fine particles accumulated in bed,which lasted for~30 s.The dramatic drops in pressure drop indicated the occurrence of purging.In the meantime,the filtration was switched from granular bed A to granular bed B for a continuous operation.The collection efficiency was 97.56%,which is close to the calculated value of 98.76%.Fig.10 shows the comparison of pressure drop between the estimated values and experiment data.The consistency indicated that the model can adequately describe the filtration performance under hot conditions.
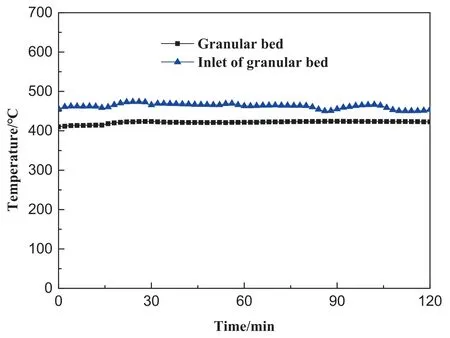
Fig.8.Temperature profiles at filtration bed.
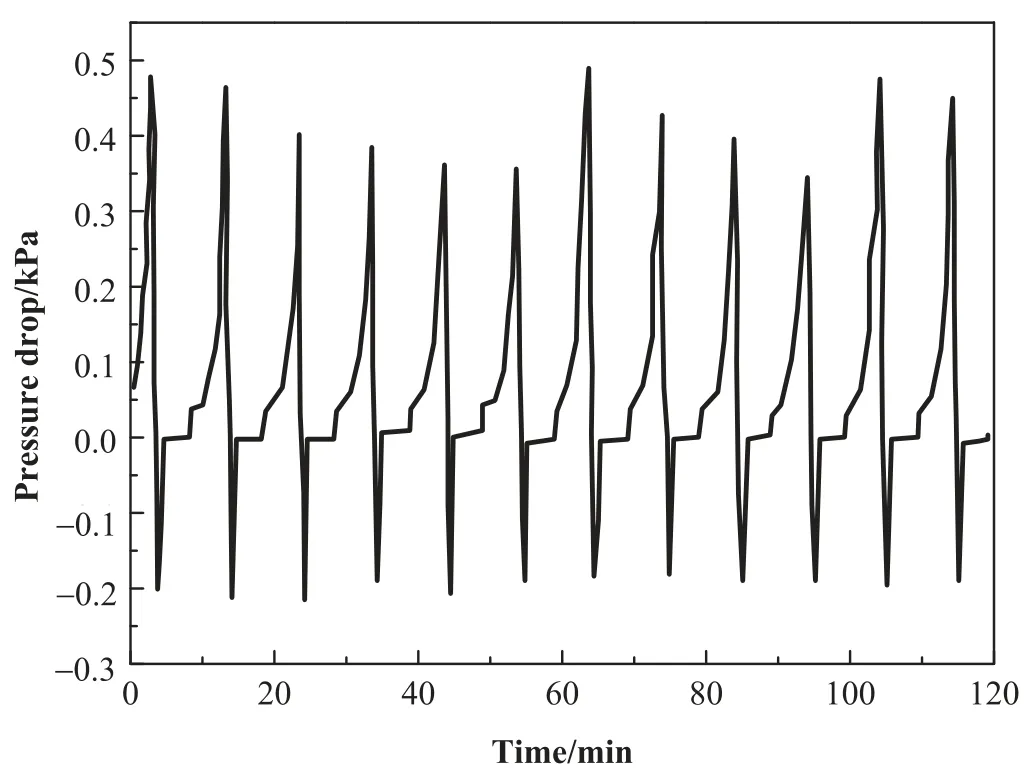
Fig.9.Pressure drops across filtration bed.
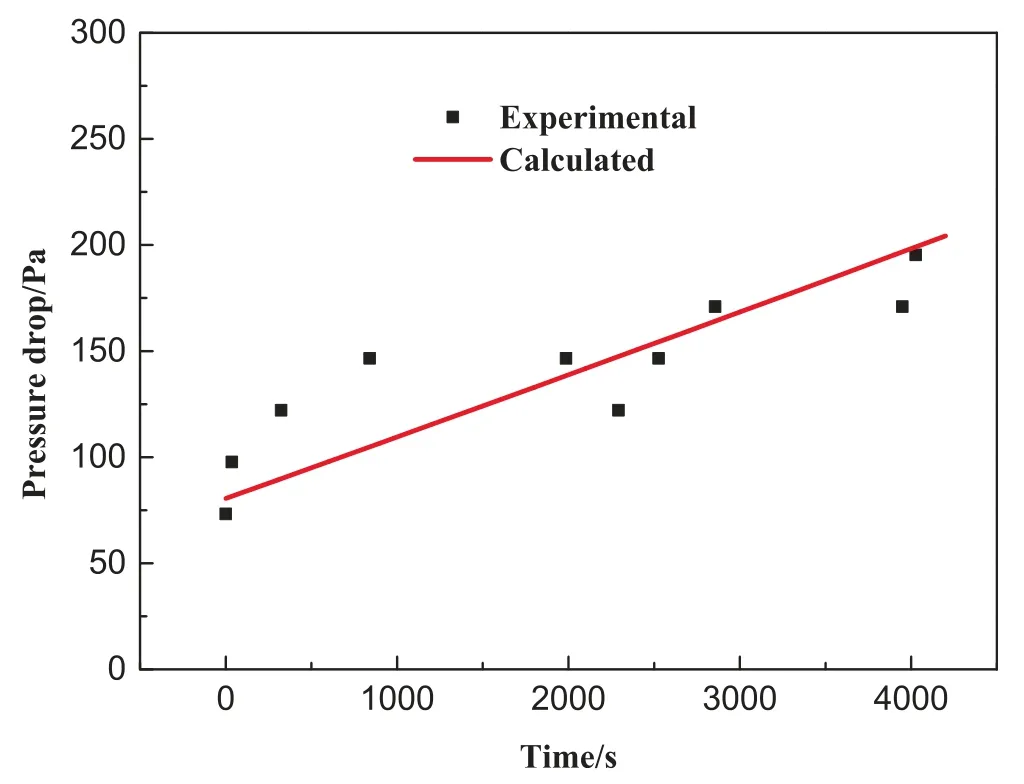
Fig.10.Comparison of pressure drop estimated by the model with experimental data (conditions: T=460 °C, cin=6.4 g∙m-3, ug=0.1 m∙s-1, L=200 mm).
Fig.11 gives the results of the effluent dust size distribution.Interestingly,it exhibited two distinct peaks,which was different from the unimodal size distribution of the influent dusts.One peak was centered at 3.3 μm and the other was at 22.9 μm.Ash generated on the combustion side acted as a heat carrier in the pyrolytic process,which mixed with the fine char particles from the downer pyrolyzer,constitutes the influent dust particles entering into the granular filtration bed.Since fine char has much lower density(0.5–0.6 g∙cm-3)than the ash(2.0–2.3 g∙cm-3).The light char particles displayed better flowing behaviors in comparison with ash,leading to a quite difference in the collection efficiency.Fig.12 shows the collection efficiencies of char particles and ash calculated by the model,assuming the same particle size distributions as given in Fig.7.It is found that the filtration bed had a much lower collection efficiency for chars than that for ash due to the significant difference in density.Therefore,it can be speculated that the peak centered at 22.9 μm was ascribed to chars and the peak at 3.3 μm was attributed to ash.

Fig.11.Effluent particle size distribution.
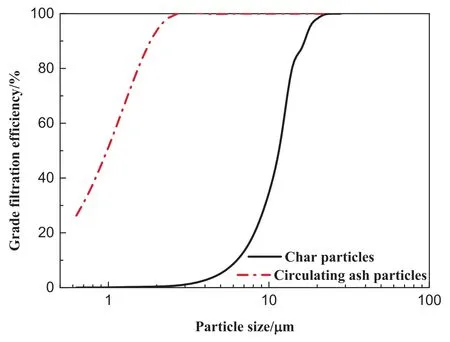
Fig.12.Calculated collection efficiencies for char and ash under hot conditions.
4.3.3.Effect on pyrolysis products
It is that the dust content in tar was dramatically lowered,achieving a reduction from 9.96% to 0.94% amid the filtration.It further indicated that the GBF performed appropriately in terms of the dust removal from hot pyrolytic vapors.
Fig.13 illustrates the pyrolytic product yields before and after the filtration process.It was seen that the yield of incondensable gas and water increased after the filtration at the expense of tar yield,indicating that a tar cracking occurred over the bed.In addition,the adsorption of perlite may also cause the tar yield to decline.The tar yield was reduced from 6.85% to 5.20%.This trend is consistent with the lab experiments[11].The components of tar and gas before and after filtration were shown in Table 3.No significant change was found in gas compositions as listed in Table 3.The decrease in the content of oxygen-containing compounds in tar is consistent with an increase in water yield.The content of aromatic hydrocarbons in tar decreases,while the content of aliphatic hydrocarbons increases,indicating that the tar undergo cracking reactions.These results imply that tar yield would be sacrificed to some extent in order to achieve a low dust content of tar when using GBF.
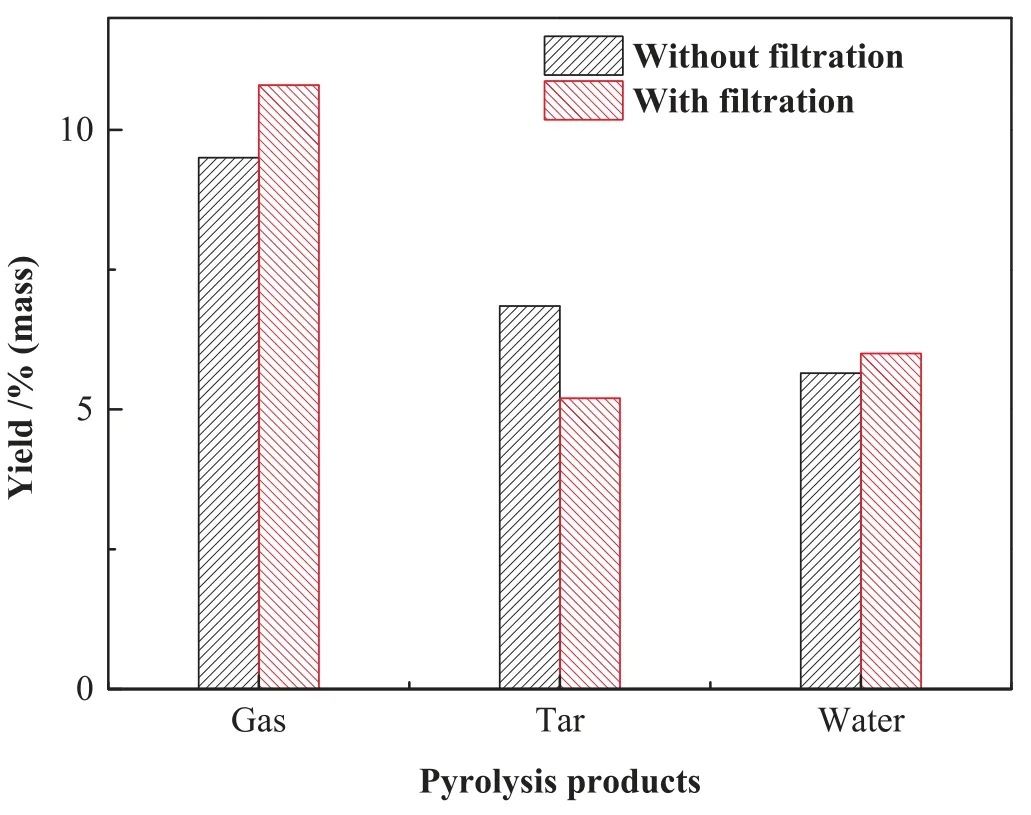
Fig.13.Pyrolysis product yields before and after the filtration.
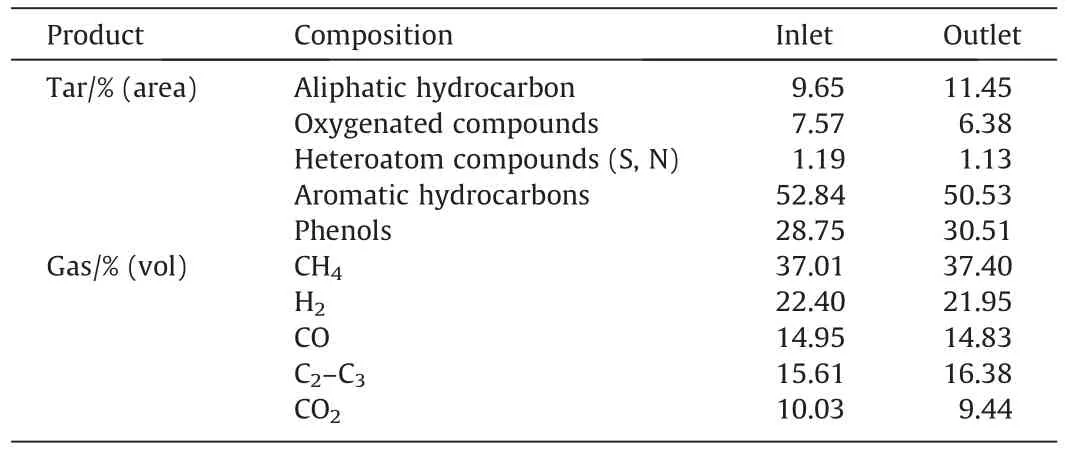
Table 3 Tar and gas compositions before and after the filtration
5.Conclusions
Main conclusions can be drawn as follows:
(1) The description and prediction of granular bed filtration performance was of great theoretical and practical significance for understanding the filtration process.To account for the effect of bed porosity,an effective specific deposit was introduced to the modification of Walata’s filtration coefficient model.Based on the macroscopic phenomenological theory,this model was successfully applied to describe the dust deposition effect on the GBF performance in the dust removal from coal pyrolytic vapors.
(2) A fixed granular bed with expanded perlites as filtration media was integrated into a 10 t∙d–1pilot scale facility.A dust collection efficiency of 97.56% was obtained.The pressure drop varied from 356 Pa to 489 Pa.The dust content in tar was significantly lowered,which reduced from 9.96%to 0.94%.The tar yield showed a slight decrease after filtration due to the tar cracking.As a result,the incondensable gas yield increased and no significant change in gas composition was observed.
(3) A bimodal size distribution of dust particles after filtration was observed in the hot tests at the 10 t∙d–1pilot scale facility.It can be explained by the heterogeneity of the dust components.
Data Availability
The authors do not have permission to share data.
Declaration of Competing Interest
The authors declare that they have no known competing financial interests or personal relationships that could have appeared to influence the work reported in this paper.
Acknowledgements
The authors are grateful to the financial support from the National Key Research and Development Program of China(2018YFB0605003).
Supplementary Material
Supplementary data to this article can be found online at https://doi.org/10.1016/j.cjche.2023.07.003.
Nomenclature
Asparameter defined in Eq.(10)
CSCunningham correction factor
cininfluent particle concentration,kg∙m-3
couteffluent particle concentration,kg∙m-3
dgfilter-grain diameter,m
dpparticle diameter,m
Etotal collection efficiency
F(σ) a function of specific deposition rate
kcoefficient or parameter
Lfilter height,m
NRinterception parameter,defined asdp/dg
NReReynolds number,defined as(dgugρ)/μ
NstStokes number,defined as
Nsteffeffective Stokes number
ΔPpressure drop,kPa
Toperation temperature,°C
tfiltration time,s
ugsuperficial gas velocity,m∙s-1
Wcoalmass of coal,kg
Wimass of pyrolysis products,kg
Yiyield of pyrolysis products
α1,α2coefficient or parameter
γ adhesion probability
ε filter porosity
λ filter coefficient
σ specific deposit,defined as
σeffeffective specific deposit
η efficiency of individual collector
η0initial value of η
μ fluid viscosity,Pa∙s
ρ fluid density,kg∙m-3
ρpdust density,kg∙m-3
杂志排行
Chinese Journal of Chemical Engineering的其它文章
- Flower-like tin oxide membranes with robust three-dimensional channels for efficient removal of iron ions from hydrogen peroxide
- Experimental study on the activation of coal gasification fly ash from industrial CFB gasifiers
- Enhanced stability of nitrogen-doped carbon-supported palladium catalyst for oxidative carbonylation of phenol
- Solubility of iron(III) and nickel(II) acetylacetonates in supercritical carbon dioxide
- Copper slag assisted coke reduction of phosphogypsum for sulphur dioxide preparation
- The Al2O3 and Mn/Al2O3 sorbents highly utilized in destructive sorption of NF3
