Laboratory observation of electron energy distribution near three-dimensional magnetic nulls
2024-04-06RenchuanHE何任川TianchaoXU徐田超XiaoyiYANG杨肖易ChijieXIAO肖池阶ZuyuZHANG张祖煜RuixinYUAN袁瑞鑫XiaogangWANG王晓钢ZhibinGUO郭志彬XiumingYU余修铭andYueGE盖跃
Renchuan HE (何任川) ,Tianchao XU (徐田超),* ,Xiaoyi YANG (杨肖易), ,Chijie XIAO (肖池阶),* ,Zuyu ZHANG (张祖煜) ,Ruixin YUAN (袁瑞鑫) ,Xiaogang WANG (王晓钢),Zhibin GUO (郭志彬),Xiuming YU (余修铭) and Yue GE (盖跃)
1 State Key Laboratory of Nuclear Physics and Technology,School of Physics,Peking University,Beijing 100871,People’s Republic of China
2 Department of Physics,Harbin Institute of Technology,Harbin 150001,People’s Republic of China
Abstract The acceleration of electrons near three-dimensional (3D) magnetic nulls is crucial to the energy conversion mechanism in the 3D magnetic reconnection process.To explore electron acceleration in a 3D magnetic null topology,we constructed a pair of 3D magnetic nulls in the PKU Plasma Test (PPT) device and observed acceleration of electrons near magnetic nulls.This study measured the plasma floating potential and ion density profiles around the 3D magnetic null.The potential wells near nulls may be related to the energy variations of electrons,so we measured the electron distribution functions (EDFs) at different spatial positions.The axial variation of EDF shows that the electrons deviate from the Maxwell distribution near magnetic nulls.With scanning probes that can directionally measure and theoretically analyze based on curve fitting,the variations of EDFs are linked to the changes of plasma potential under 3D magnetic null topology.The kinetic energy of electrons accelerated by the electric field is 6 eV(ve~7vAlfvén-e) and the scale of the region where accelerating electrons exist is in the order of serval electron skin depths.
Keywords: electron acceleration,EEDF,3D magnetic null,magnetic reconnection(Some figures may appear in colour only in the online journal)
1.Introduction
Magnetic reconnection is a ubiquitous phenomenon that extends across various scales and dimensions,during which magnetic energy is quickly transformed into kinetic and thermal energy of plasma [1-6].Evidenced by observations of solar flares,reconnection-driven acceleration has proved to be an effective medium for the conversion of magnetic energy into electron kinetic energy [7].As a result,magnetic reconnection accounts for numerous astrophysical phenomena.The most notable of these are characterized by the generation of high-energy particles,including stellar flares[2] and gamma-ray bursts [8].According to previous studies on 3D magnetic nulls and reconnection in space plasmas,the reversal of magnetic field direction is related to the distribution of high-speed flows,which provides a useful criterion for the occurrence of reconnection [6,8-10].Local observations in space cannot effectively reflect the macroscopic properties of magnetic null topology,and remote sensing of magnetic nulls on the solar surface cannot perform high spatial resolutions [1,5,6,11,12].Laboratory observations can compensate for the aforementioned shortcomings.There are many laboratory observations on particle acceleration under two-dimensional magnetic null topology [9,13].For example,observed in the experiment on the Magnetic Reconnection Experiment (MRX) device,electrons are accelerated to several times the local Alfvén velocity near two-dimensional magnetic nulls [13].The scale of the region where accelerated electrons exist is in the order of electron skin depth.Previous studies manifest a Quasi-separatrix Layer (QSL) with hyperbolic flux tube (HFT) geometry between magnetic flux ropes has been experimentally observed in the Large Plasma Device (LAPD) at UCLA [14]and in the linear device VINETA II at the Max-Planck-Institute [15].The Madison Plasma Dynamo Experiment(MPDX) and the Terrestrial Reconnection Experiment(TREX) are designed to study plasma processes related to astrophysics including antiparallel reconnection,strong guide-field reconnection and 3D reconnection [16].However,there is a paucity of research on electron acceleration in 3D magnetic null points in laboratory settings.Such experiments have the potential to offer not only precise diagnosis of localized electron distribution functions but also insight into the relationship between accelerated electron distribution and macroscopic magnetic topology structures[17-19].
In the 3D magnetic null experiment conducted on the PPT device,an electric field was observed along the axis in an area approximately 4deaway from a magnetic null.Considering that electrons in the vicinity of magnetic nulls are decoupled from magnetic field lines,electrons in demagnetized plasma may be accelerated by electric fields.In subsequent experiments,utilizing Mach probes with scanning bias voltage,electron flows with velocityv=7vAlfvénnear the magnetic nulls were observed to exist in an area about 4delong inside the separatrix.
2.Experimental method
In order to study the plasma in 3D magnetic null configurations,we constructed the magnetic configuration shown in figure 1(a) on the PPT device [20-22].As illustrated in figure 1(c),a hollow cylindrical permanent magnet is placed on the central axis of the PPT device,with an outer diameter of 152 mm,an 88 mm inner diameter and a length of 140 mm.The magnetic field of this permanent magnet is superimposed with the magnetic field generated by the Helmholtz coils to form the magnetic configuration shown in figure 1(a).The white straight line in the middle is the γ-line of this magnetic null configuration,and the white closed curve is the separatrix connecting two magnetic nulls.The size of the closed field line area in the 3D magnetic null configuration can be adjusted by the current of the Helmholtz coils.When the current of the Helmholtz coils is adjusted from 100 A to 200 A,the background magnetic field changes from 260 G to 525 G,and the maximum distance from the separatrix to the central axis decreases from 130 mm to 90 mm,which is shown in figure 2.
In the magnetic null experiment,the discharge power of the helicon plasma source is 1500 W.The working pressure is 0.5 Pa,and the plasma density can reach up to 1012cm-3when the argon gas is discharged.In the same experimental configuration,previous studies have observed ion Bernstein waves on the separatrix [20].This paper employs the same electrostatic probe diagnosis as in previous work.Nine electrostatic probes placed side by side formed a 9-probe array.The radial measurement range of this probe array is 32 mm.Two nine-probe measurements with different magnet suspension positions can be combined to obtain a wider axial range of the measurement,which is increased to 48 mm.The 2D profiles of density and floating potential are shown in figure 2.
In this paper,a scanning voltage probe is used to measure the electron distribution function of plasma.As shown in figure 3,theI-Ucharacteristic curve of plasma can be obtained using voltage scanning probes.For plasma in which the electrons satisfy the Maxwell distribution,the reciprocal of the first derivative of electron current with respect to the probe voltage is proportional to the electron temperature.The electron distribution function can be calculated by equation (1),and the calculation method of electron currentIein this formula refers to previous work [23,24].
In equation (1),V=Vplasma-Uprobe>0,Spis the effective area of the probe in contact with the plasma,andUis the probe voltage.f0is the electron distribution function(EDF),Fis the electron energy distribution function(EEDF) andfpis the electron energy probability function.According to the physical meaning of EEDF,it can be used to calculate plasma density,effective temperature,and total energy of electrons [23,24]:
The effective electron temperatureTeffrepresents the electron energy of unit density.For electrons following the Maxwell distribution,Te=TeffandEtotal=Te.When electrons deviate from the Maxwell distribution,the total electron energy cannot be represented byTe,and it should be calculated by integrating the EEDF [23,25].However,the measurement of the electron distribution function needs to overcome the interference on probes from the RF source and the overheating problem of probes.Since theI-Ucharacteristic curve is non-linear,data smoothing cannot remove the influence of the RF source and the measured characteristic curve is still distorted.Previous studies demonstrate that the above-mentioned distortion is most noticeable in the interval where electron currents and bias voltages are exponentially related,which will seriously affect the measurement of EDFs [24].In the actual measurement,the overheating of probes will also cause the distortion of characteristic curves,which will also affect the calculation of EDFs.In order to address the above problems,the measurement signal ground of the PPT device is isolated from the RF source,and a passive filter voltage divider circuit is used to collect the signal of the scanning voltage probes.There is a sufficient time interval (about 10 min)between each probe measurement to prevent the tungsten rod of the probes from overheating.Based on the above methods,the characteristic curves can thus be measured more accurately.The energy resolution of the EDF on the PPT device can reach 0.5 eV.Therefore,further studies near magnetic nulls have been performed on the PPT device.
3.3D magnetic null experiments
The nine-tip probe array measured the plasma density and floating potential profiles in the 3D magnetic null region.As shown in figure 2,the peak of ion density and the potential well of the floating potential exist near the separatrix of the 3D magnetic null configuration.The electric field near the magnetic null can be calculated based on the profile of the floating potential.It can be seen that significant electric fields are present not only in the separatrix region but also near the magnetic null region.The electric field is likely to change the kinetic energy of the electrons near the magnetic null point for the demagnetization of the electrons.It is necessary to measure the variation of EDF near magnetic null points.
In the PPT device,the probes move in the radial direction at a certain axial position,so the variation of physical quantities in the axial direction cannot be measured directly.However,the variation in the axial direction relative to the magnetic null position can be obtained by changing the position of the magnetic null.The magnetic field of the permanent magnet remains constant and the position of magnetic nulls changes as the magnetic field generated by Helmholtz coils changes.When the background magnetic field generated by Helmholtz coils changes from 260 G to 525 G,the null position gradually moves outwards about 20 mm in theZ-direction (axial direction of the PPT device).Therefore,the axial variation of the EDF can be measured by changing the current,namely changing the relative position between the probes and the magnetic null point,which is shown in figure 4(d).However,this method also changes the background magnetic field of the device,and the errors caused by this method will be discussed in the final section.
As indicated in figure 4(d),the electron distribution function changes from a single-peak distribution to a doublepeak distribution near the magnetic null point.The axial position of the probe platform center when=150 A is taken as the zero point of theZaxis.The axial profile of the electron distribution function from the zero point to the area inside the separatrix can be obtained,as shown in figure 4(d).The positive direction of the horizontal axis points to the plasma source.The measurement results in figure 4(d) show two peaks at~1 eV and~4 eV in a region about 18 mm long from the magnetic null point to the separatrix.
Figures 5(b) and (c) are the radial profiles of the EDF for different axial positions when background magnetic fieldBBack=395G.Figure 5(b) has a measuring range of 0-150 mm and figure 5(c) has a measuring range of 0-100 mm.In the central region of figure 5(c),the energy distribution function of electrons has higher energy than that at the edges.Considering figures 4 and 5 comprehensively,the EDF in the central region of the device has two peaks at~ 1 eV and~ 4 eV,which no longer follows the Maxwell distribution.In summary,the electron distribution function of the plasma near the magnetic nulls exhibits a bimodal distribution.The region where electrons have higher energy has an axial length of about 17 mm and a radial length of 20 mm.In the next section,we discuss whether the excess electron energy is isotropic thermal energy or anisotropic kinetic energy,and further explore its causes.
4.Electron acceleration near the magnetic null
In order to explore the relationship between the direction of electron motion with different energies and the direction of the electric field on the central axis,we used a Mach probe with biased scanning voltage,as shown in figure 6 [26].In order to reduce the mutual interference between these two probes,one probe is not connected to bias voltages when the other scanning probe is measuring.The axial distribution of the EEPF on the upstream and downstream surfaces is obtained,as shown in figures 7(a) and (b).Figure 7(c) indicates the EEPF difference between upstream and downstream.The results show that the electrons with higher energy mainly come from the direction of the upstream side,which coincides with the direction in which the axial electric field accelerates electrons,as shown in figures 8(c) and (d).
Figure 8(a) is the EEDF measured by a single probe.Equation (2) shows the relationship between EEDFs and EDFs.The total energy of electrons and electron density can be calculated by integrating the EEDF.The calculation results in figures 8(c) and (d) show that the total energy of the electrons increases significantly in the region where the axial electric field is larger.Electrons in the Maxwell distribution may form a drift-Maxwell distribution under the action of an electric field [25,27]:
The kinetic energy of electrons can be obtained by fitting the results of the upstream probe.Figure 9 shows the fit of the EEDF calculated from the upstream probe to the drift-Maxwell distribution,and table 1 shows the fitting parameters and the goodness of fit obtained using the Curve Fitting Toolbox in MATLAB.The fitting uses the Levenberg-Marquardt algorithm in the Curve Fitting module in MATLAB.The results show that the kinetic energy of electrons accelerated by the electric field is 6 eV.
In this section,we found that electrons with directional motion velocity are generated by the axial electric field near the magnetic null region.The region where accelerated electrons (ΔEk=6 eV) exist has an axial length of about 4deand a radial length of about 8de(considering the axisymmetric nature).The velocity of electron directed motion is calculated to be 1026 km/s (~7vAlfvén-e).The normalized size of the region where the accelerated electrons exist is similar to the size of the electron diffusion region in the reconnection experiments of the MRX device[13],and so is the velocity of electrons.Figure 8(b) shows the electron density calculated using the integration over EEDF.
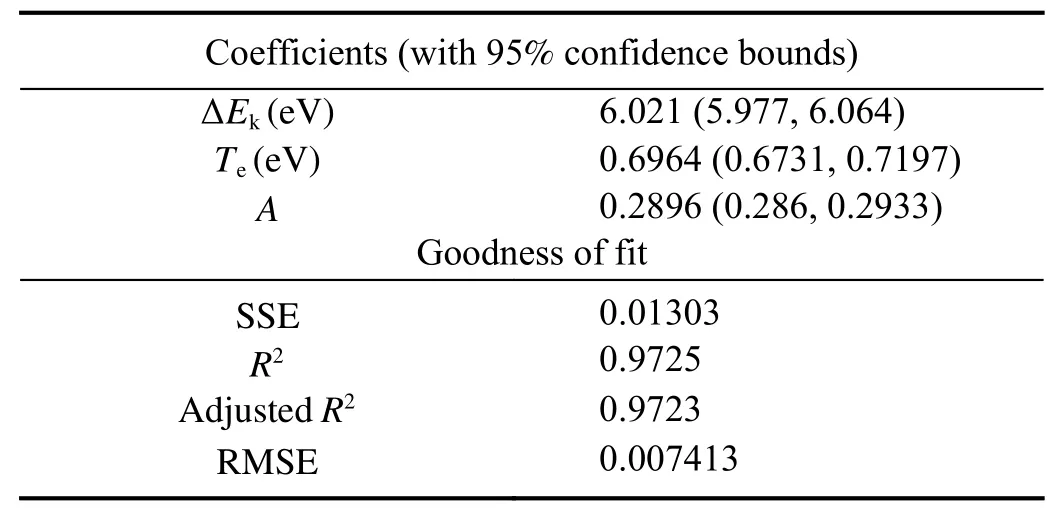
Table 1.The fitting parameters and the goodness of fit.
The electron density near the 3D magnetic null point has a maximum compared with the nearby density,which means that special magnetic topology near nulls may trap electrons.This is similar to the previous space observation study [28].As shown in figure 2,there is no such significant change in ion density near the null point.Therefore,this indicates that the formation of electric field is caused by charge separation,which could be related to the trapping effect on electrons of the magnetic topology near the 3D magnetic null point.
5.Discussion and conclusion
We measured the axial profile of the electron distribution function near the null point by changing the position of the null point through adjusting the coil magnetic field.However,the change of the magnetic field may affect the floating potential and electron distribution function of the plasma generated by the helicon source.Figure 10 shows the variation of the EDF and floating potential in the center of the PPT device with the magnetic field in cylinder configuration.When Helmholtz coil currentIcoil∈[100 A,200 A],adjusting the magnetic field will not cause significant changes in the potential and electron distribution functions.This also proves the feasibility of the axial profile measurement method adopted in the experiment.
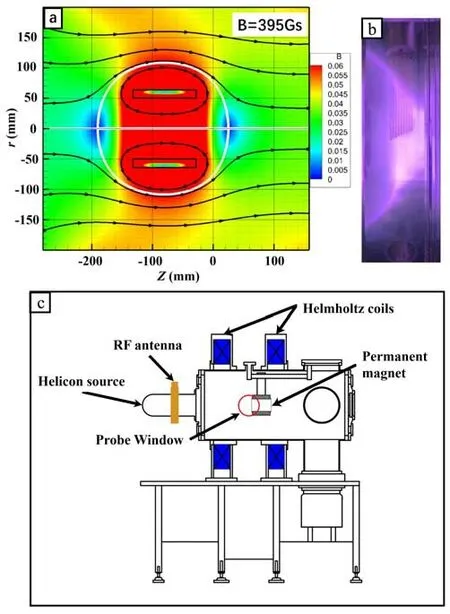
Figure 1.Schematic diagram of the magnetic field for the experiments in this paper.Experimental conditions were the same as in previous ion Bernstein wave (IBW) research work.The red circle in the figure indicates the window for probe diagnosis,and permanent magnets are suspended in the middle of the device [20].(a) The diagram of a magnetic null configuration,and the nine-probe array in the helicon plasma of the PPT device,(b) during the experiment,a nine-tip probe array was extended into the separatrix and (c)schematic diagram of the PKU plasma test device for the experiments.
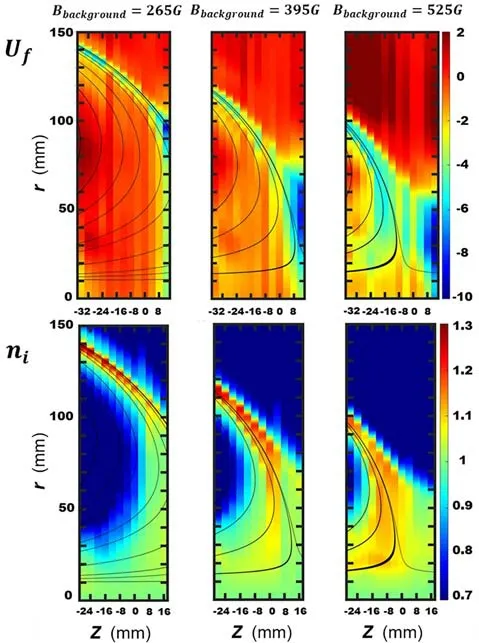
Figure 2.Ion density and floating potential profiles near the magnetic null,when the current of the Helmholtz coils is 100 A,150 A and 200 A.The magnetic field of the permanent magnet remains constant when the applied magnetic field changes.Therefore,the separatrix and magnetic null change their positions in different Helmholtz coil currents.
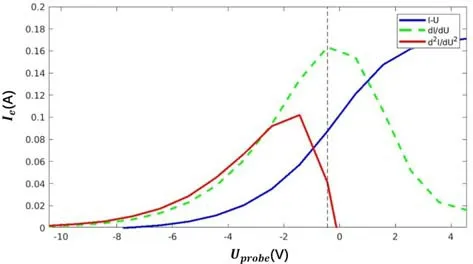
Figure 3.The I-U curve measured in the experiment and the first and second derivatives calculated based on it.The black dashed line represents the peak of the first derivative.
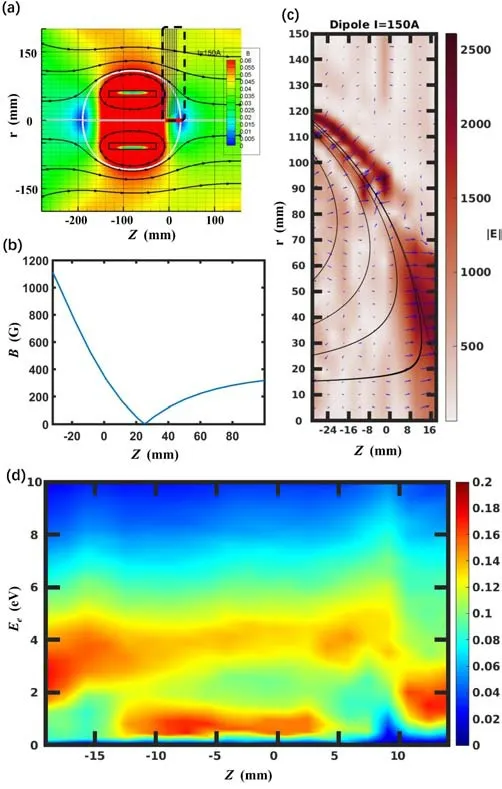
Figure 4.Magnetic field shown in (a) and (b) is calculated through CST based on experiment measurements.(a) Diagram of the ninetip probe’s diagnostic area.The black dashed line in the figure indicates the area where the 9-tip probe diagnoses,(b) variation of the magnetic field intensity in the magnetic null region with axial position Z on the central axis,(c) vector diagram of the electric field calculated from the floating potential profile when background magnetic field BBack=395 G and (d) axial profile of the EDF measured by the probe along the axial (Z-direction) position.The vertical axis represents the intensity of electron energy in units of eV.The colors in figure 4(d) represent the electron distribution functions at different axial positions.
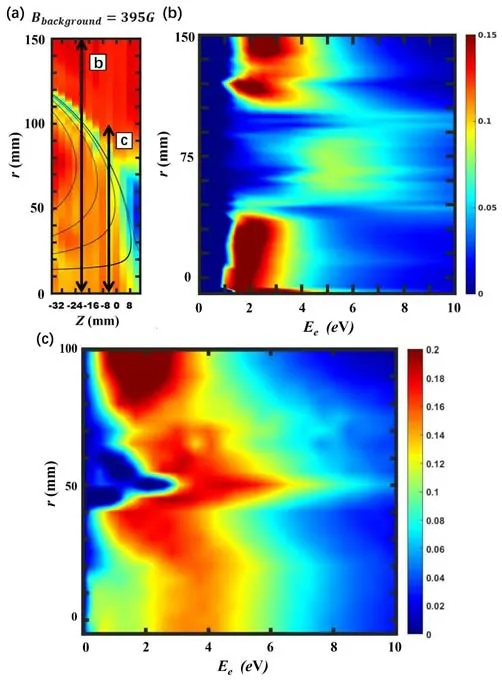
Figure 5.(a) Black bidirectional arrows on the floating potential profile are the scan probe trajectories for the measurement of the EDF under a 3D magnetic null-point configuration,(b) radial profile of the EDF at the axial position far from the null point and(c) radial profile of the EDF near the magnetic null point.
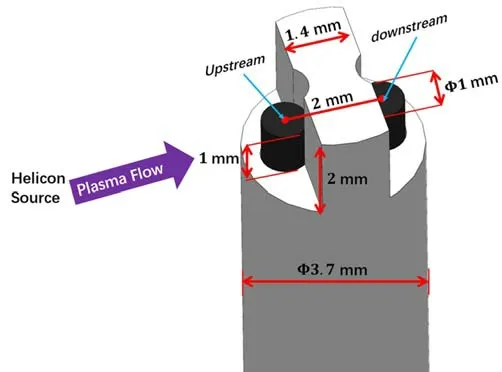
Figure 6.Schematic diagram of the Mach probe.The Mach probe head consists of two tungsten rods and an alumina ceramic plate spacer between them.The side close to the plasma source is the upstream side of the Mach probe,and the other side is the downstream side.
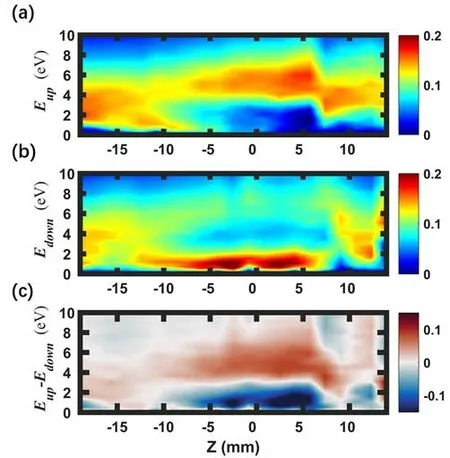
Figure 7.EDF measured at r=0 mm.(a) EDF measured by upstream probe in figure 5,(b) downstream EDF and (c) difference between upstream EDF and downstream EDF.
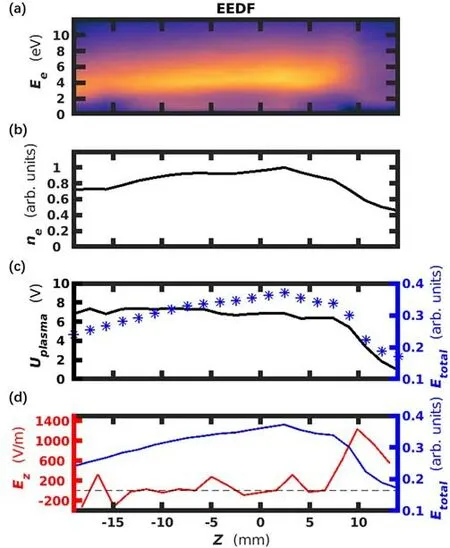
Figure 8.(a) EEDF of the plasma near the magnetic null,(b) electron density calculated by EEDF near the magnetic null,(c) axial profiles of plasma potential (left black y-axis) and total electron energy in plasma (right blue y-axis) and (d) axial profiles of the axial electric field calculated by the plasma potential (left red yaxis) and the total electron energy in plasma (right blue y-axis).

Figure 9.The fit of the EEDF calculated from the upstream probe data to the drift-Maxwell distribution.The black line is the EEDF measured by the upstream scanning probe,and the red dashed line shows the fitting results using the drift-Maxwell distribution.
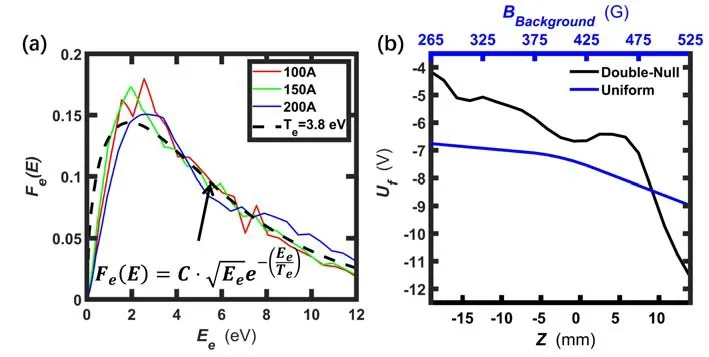
Figure 10.(a) EEDF in cylinder plasma with different uniform magnetic fields,which exhibits a Maxwell distribution and (b) floating potential in a cylinder plasma in a uniform magnetic field shows no significant change when compared to the plasma near the magnetic null point.
This paper first introduces the measurement of plasma density and floating potential profile in the 3D magnetic nullpoint experiment.The experimental results found that the interface of different magnetic topological regions,that is,the separatrix surface region,has a density change and an electric field exists.Then,using the scanning voltage probe,we found that there is a region with double-peak distribution of electrons in the 3D magnetic null region.
Using a Mach probe with scanning voltage bias to enable directional measurement of EDF,we found that the source of the accelerated electrons may be closely related to the electric field in the magnetic null region.The kinetic energy of the accelerated electrons found in the experiment is 6 eV,and the area with accelerated electrons is about 8de×4de.Through qualitative calculations,we found that the electron density in the magnetic null region is high,and the magnetic field topology is likely to confine the electrons.Considering that the attachment depth of electrons is much smaller than that of ions,the magnetic null-point configuration has a strong confinement effect on electrons.The formation of the electric field may be related to the electrons trapped by the topology of the magnetic nulls.Similar properties of 3D magnetic nulls have also been found in space satellite observation studies.Although no definite evidence of 3D magnetic reconnection has been identified in this experiment,the special magnetic field topology of magnetic nulls can cause changes in the distribution function of plasma.Our experimental results prove that the macroscopic properties of the 3D magnetic null topology have a direct impact on the EDF.The special EDF may be closely related to the instability in the 3D magnetic nulls and separatrix [20],and may also be associated with the triggering of 3D magnetic reconnection and related energy conversion mechanism.The precise mechanism of the electric field generation in the magnetic null region still requires accurate measurement of ion distribution functions and electron densities.
Acknowledgments
This work was supported by National Natural Science Foundation of China (No.11975038) and the National Key Research and Development Program of China (No.2022YFA1604600).
杂志排行

Plasma Science and Technology的其它文章
- Forward modelling of the Cotton-Mouton effect polarimetry on EAST tokamak
- First results of CO2 dispersion interferometer on EAST tokamak
- Reconstruction of poloidal magnetic field profiles in field-reversed configurations with machine learning in laser-driven ion-beam trace probe
- Electron density measurement by the three boundary channels of HCOOH laser interferometer on the HL-3 tokamak
- Development of a toroidal soft x-ray imaging system and application for investigating three-dimensional plasma on J-TEXT
- Inward particle transport driven by biased endplate in a cylindrical magnetized plasma