A synthetic diagnostics platform for microwave imaging diagnostics in tokamaks
2024-04-06ZihanLI李子涵ShangchuanYANG杨尚川XinhangXU徐新航LifuZHANG张立夫ChengmingQU渠承明ChengpuLI李诚普GeZHUANG庄革andJinlinXIE谢锦林
Zihan LI (李子涵),Shangchuan YANG (杨尚川),Xinhang XU (徐新航),Lifu ZHANG (张立夫),Chengming QU (渠承明),Chengpu LI (李诚普),Ge ZHUANG (庄革) and Jinlin XIE (谢锦林)
Department of Plasma Physics and Fusion Engineering,University of Science and Technology of China,Hefei 230026,People’s Republic of China
Abstract Interpreting experimental diagnostics data in tokamaks,while considering non-ideal effects,is challenging due to the complexity of plasmas.To address this challenge,a general synthetic diagnostics (GSD) platform has been established that facilitates microwave imaging reflectometry and electron cyclotron emission imaging.This platform utilizes plasma profiles as input and incorporates the finite-difference time domain,ray tracing and the radiative transfer equation to calculate the propagation of plasma spontaneous radiation and the external electromagnetic field in plasmas.Benchmark tests for classical cases have been conducted to verify the accuracy of every core module in the GSD platform.Finally,2D imaging of a typical electron temperature distribution is reproduced by this platform and the results are consistent with the given real experimental data.This platform also has the potential to be extended to 3D electromagnetic field simulations and other microwave diagnostics such as cross-polarization scattering.
Keywords: synthetic diagnostics,tokamak plasmas,microwave imaging diagnostics,microwave imaging reflectometer,electron cyclotron emission imaging
1.Introduction
Extensive research has been conducted on plasma instabilities in tokamaks,specifically the magnetohydrodynamics modes and turbulence behaviors.Fluctuations and distributions of the electron density and temperature are critical for analyzing these instabilities.Consequently,numerous diagnostic systems have been implemented for accurate measurement of these parameters.Notably,the microwave imaging reflectometer (MIR) and electron cyclotron emission imaging (ECEI) are effective tools that provide high spatial and temporal resolution in two dimensions for obtaining visualized fluctuation distributions of electron density and temperature fluctuations,respectively [1-7].These two diagnostic tools have now been unified into a single diagnostic system,which can measure the electron density and temperature fluctuations in the same observation area to explore the plasma instabilities in tokamaks.
The MIR functions as a diagnostic tool akin to radar.An extraordinary wave at a certain frequency can be reflected by plasma at a cutoff layer determined by the magnetic intensity and the electron density as dictated by the plasma dispersion relation.The phase of the reflected wave is related to the location of the cutoff layer while the electron density fluctuations can be inferred from the phase fluctuation,provided the magnetic intensity is known.Due to the rough shape of the cutoff layer,the waves scatter on a significantly large scale,resulting in a complex pattern of the reflected field.In order to collect as much of the reflected signal as possible for precise wavefront reconstruction,a solution involving large aperture microwave optics is implemented [6].Arranging the antennas along the vertical direction outside of the tokamak,one can acquire phase information for the entire cutoff layer.The number of selected frequencies determines the radial resolution of the MIR.Most importantly,the imaging quality and the accuracy of the data are influenced by the matching among three planes,namely the shape of the cutoff layer,the wavefront of the incident beam as it propagates through the optical system and plasma away from the cutoff layer,and the shape of the imaging plane formed by the configuration of the receivers and the receiving optical system [8].The propagation direction of the incident beam needs to be perpendicular to the cutoff layer to facilitate perfect signal collection by the antennas.If the ‘shape-matching’ issue is ideally satisfied,the Doppler effect caused by the plasma poloidal velocity is zero and the phase fluctuations purely represent the density fluctuation.It is challenging to determine whether the ‘shapematching’ issue is satisfied in different plasma environments.
Synthetic diagnostics have emerged as a solution to address the aforementioned challenges.By using the first principles of plasma diagnostics,synthetic diagnostics simulate digital diagnostics on computers,allowing for the modeling of various plasma profiles.Various plasma profiles can be input into synthetic diagnostics,after which the diagnostic process generates digital signals. Additionally,synthetic diagnostics enable the analysis of experimental data obtained from tokamak diagnostics by comparing it with digital data [9-11].Furthermore,synthetic diagnostics facilitate the assessment of the capability and sensitivity of MIRs [10,12-14],allow for diagnostics upgrades [15-17],and aid in studying the influence induced by plasma instabilities [13].
ECEI is a 2D imaging measurement system for electron temperatures by passive detection of electron cyclotron emission (ECE) [2].In magnetized plasmas,ECE and its harmonics are generated by the gyro-motion of electrons and reabsorbed by plasmas along the propagation path.Finally,the pure black-body emission can be received by the antennas if the emission is reabsorbed completely by local plasmas with sufficiently high electron density.In general,ECE in O-mode and the second harmonic of ECE in X-mode are used in tokamak measurements.However,if the electron density of plasma is not large enough to significantly reabsorb the ECE,part of the ECE leaks out of the tokamak and is received by antennas.This makes the electron temperature measured by ECEI appear higher than its actual value [2].The signal intensity received by antennaI(ω) at the electron cyclotron frequency and its harmonics is [9,18-21]:
wherecis the speed of light,ω is the detected frequency,Teis the electron temperature at the location where the electron cyclotron frequency equals ω,τ is optical thickness defined as τ=αds′where α is the absorption efficient andlis the trace of the emission.As we all know,the ECE frequency ωce=eBme-1is a monotonically decreasing function of the major radiusR.ThusI(ω) can be used to interpretTealong the major radius.As in an MIR,with antennas arranged along the vertical direction,2D imaging diagnostics are achieved and the temperature fluctuations over time can also be measured.According to equation (1),the electron temperature at the location where ω=ωcecan be considered proportional to the measured radiation if τ ≫1 is satisfied.To achieve this condition,the electron density must be large enough [2,9].In contrast,if τ<1,called the optical thin area,the electron temperature can no longer be easily interpreted by theI(ω) unless the optical thickness can be predicted in advance.Therefore,the optical thickness is crucial for data interpretation,especially at the edge of a tokamak where the optical thickness is normally thin [22-24].In such cases,synthetic diagnostic using forward modeling can assist in interpreting experimental data even under these non-ideal conditions.
In order to solve the tricky problems described above,a unity and general synthetic diagnostics platform for MIR and ECEI has been established and discussed in this paper.Currently,two microwave imaging diagnostics are available for simulation on the GSD platform.Figure 1 illustrates the workflow of the GSD platform,which is designed to accommodate supplementary modules and scripts for other diagnostics,such as cross-polarization scattering (CPS) and the Doppler backscattering system (DBS),as required in the future.This platform comprises numerous modules that simulate the changes in wave characteristics as they propagate through plasmas.Each diagnostic within the platform has its own script that calls upon the necessary modules to generate synthetic signals.
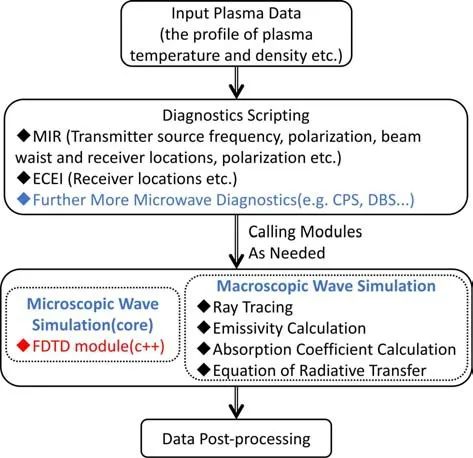
Figure 1.The workflow of GSD platform.
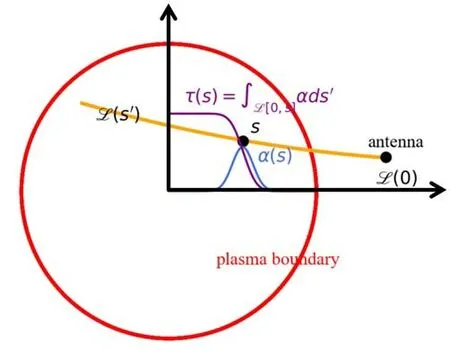
Figure 2.Illustration for the definition of the absorption efficient α and the optical thickness τ(s) on the light path L,which is shown by the orange line.
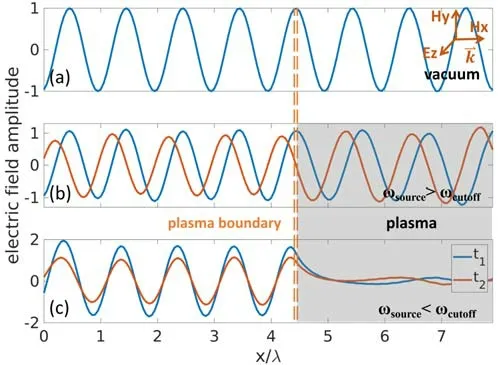
Figure 3.The normalized electric amplitude of the O-mode incident beam propagating from vacuum into plasma along the x direction.The shaded part on the right represents the plasma area.Two time slices are chosen in the middle and the bottom subfigures in different colors.
In this paper,section 2 introduces the numerical methods and the workflow in each module,section 3 shows the results of the code validation via comparative analysis of simulation results against theories.Conclusions and the future development of this platform are discussed in section 4.
2.Introduction of the modules in GSD
2.1.Introduction of the finite-difference time domain (FDTD)module
As a 2D imaging diagnostic,the advantage of the MIR is its ability to collect high-order diffracted light using large aperture optics so that large wavenumber density fluctuations can be observed [3,4].However,this feature complicates the wave characters near the cutoff layer,requiring precise simulation of wave propagation in this region.In addition,the refraction and diffraction affect the wave greater near the cutoff layer than away from it [25].As mentioned above,addressing the ‘shape-matching’ issue in this step is significant.Therefore,handling the wave propagation near the cutoff layer is the core of the MIR module in GSD platform.The whole calculation area is divided into three parts: (1) the vacuum region outside of the tokamak,(2) the paraxial region away from the cutoff layer and (3) the full wave region within several wavelengths near the cutoff layer [12].The full wave region uses the FDTD method to solve full wave equations:
Equations (2) and (3) are two Maxwell equations.The plasma profiles are described by the key equation (4),where ωpe=(meε0)]1/2is plasma frequency,ωceis electron cyclotron frequency,µ and ε are magnetic permeability and permittivity,respectively.Specifically,the FDTD module is capable of handling the moving plasma conditions that are commonly encountered in tokamaks.This module accurately solves Maxwell’s equations and the plasma current equation on the scale of wavelength,making it the central component of the GSD platform.In order to conserve computing resources and achieve accurate calculations normalization is performed prior to simulation using the FDTD module.The normalization units will be mentioned in the subsequent examples.
The accuracy of the calculations in the FDTD solver heavily relies on the effective absorption boundary.In the FDTD module,perfectly matched layers are implemented on the four boundaries,which have been verified to produce stable and reliable results [26,27].As for the source,a Gaussian beam is adopted due to its extensive usage and its congruency with the experimentally employed source.
2.2.Program flow of the ECEI module
The ECEI module is established according to the first principles of ECEI.The ECE power received by the antennas is determined by the electron temperature at the resonant location,the optical thickness along the radiation path,the antenna patterns,etc.The plasma region,antenna patterns and the mathematic modules are all modeled as the experiment settings.The schematic diagram is shown in figure 2.The core workflow begins with mapping the antennas from their original positions to the vicinity of the plasma boundary using optical calculation software.Second,the light path Lis simulated by the ray-tracing method from the antenna to the tokamak plasma.Next,the absorption coefficient α is calculated at each location along L,which is related to the local plasma properties.Then,the optical thickness τ is calculated,which equals the integral of α from the antenna to the plasma by using the reciprocity theorem.The emissivity η is calculated by equation (6),named Kirchhoff’s law of radiation.The absorption coefficient is a function of plasma frequency ωpe,electron cyclotron frequency ωceand electron thermal velocityvth,as per the equations given in Chapter 3 in [9].Lastly,by using the radiative transfer equation and Kirchhoff's law of radiation:
whereNris refractive index,Iis emission intensity,andBr(ω,T)is Planck’s black-body radiation.Considering the antenna model,the synthetic ECE spectral power is raised as the equation (7):
The absorption and emissivity are both functions of the electron density,thermal velocity and magnetic field in the ECEI module.Therefore,the ECEI module can analyze the observation location shift caused by relativistic effects associated with thermal velocities.The results are shown in section 3.4.The abnormal temperature in the optical thin area where τ<1 can also be reproduced because the absorption and the optical thickness are calculated quantitatively by GSD.
3.Code validation
First,uniform-profile plasma,plasma with a density gradient and moving plasma tests are presented to benchmark the FDTD module in one dimension.Considering that the plasmas rotate in poloidal direction in a tokamak,the structures on the cutoff layer also rotate along with the plasmas.The FDTD module is designed for moving plasma conditions,which means the plasma parameters are time-varying during the simulation.The Doppler effect due to plasma movement is tested using the FDTD solver (section 3.2),which is essential when estimating its influence on MIR data processing.It is important to note that the parameters used in the FDTD module,such as ωpe,grid size and time step,are normalized,so the parameters without units shown in this section are normalized.
Next,the validation between the ray tracing and the FDTD module is presented to verify the accuracy of the modules in two dimensions.
Whether the way was long or short, he came soon to the city, and there at the gate the Gray Wolf stopped. Get down now, Tsarevitch Ivan, he said. I am no longer a servant of thine and thou shalt see me no more, but sometimes remember the journeys thou hast made on the back of the Gray Wolf.
Last,the whole workflow is validated by using experimental data as input.The input data and the synthetic data fit well,with the exception of some errors that can be interpreted using theories.Assessing the discrepancies between the experiment and the theories is an important function of the synthetic diagnostic platform.
3.1.Validation in uniform-profile plasma regions
Uniform magnetic field and density profiles are selected to verify whether the results calculated by the FDTD module conform to the dispersion relation in plasma.Both O-mode and X-mode plane waves are selected for simulation.These simulations can be regarded as one-dimensional simulations.The results are shown in figures 3 and 4,respectively.In the samples in these two figures,the region includes the vacuum region from 0 to 4.4λ and the plasma region from 4.4λ to 7.9λ,where the electron density is uniform and the same in plasma region,with a sharp boundary atx=4.4λ.It is noted that the horizontal axis is normalized by the wavelength of the source.Two types of the electron densities satisfying a positive (middle subfigure in figures 3 and 4) and a negative(bottom subfigure in figures 3 and 4) refractive indices are chosen to investigate the difference of two wave amplitudes.Two time slices are shown to illustrate the formation of reflected waves and standing waves when ωsource<ωcutoff.The results in figure 3 reveal that when the refractive index is positive,the O-mode wave can propagate through the plasma region while it exponentially decays rapidly and reflects back at last for the negative refractive index condition.In the middle figure,the wavelength in the plasma region is a little longer than that in the vacuum region due to the refraction of plasma,which has a refractive index slightly smaller than 1.In the bottom figure,the wave is reflected by the plasma at the plasma boundary and a standing wave has been formed by the superposition of incident and reflected waves.The source frequency is ωsource=π/10 atx=0.5λ .The plasma frequencies are ωpe=π/10-0.15 and π/10+0.05in the positive and negative refractive indices examples,respectively.The normalized length unitl0=2×10⁻⁴m and the time unitt0=6.67×10⁻¹³s are used in this example.
As for the X-mode wave example,the plasma region is defined identically to the O-mode setup except for adding a uniform ωcevalue.An example (figure 4) is provided for the right-hand cutoff frequency with source frequency ωsource=π/10 positioned atx=0,ωpe=0.168 and ωce=0.1 and 0.234for positive and negative refractive indices,respectively.The normalized length unit and time unit are both the same as those in the O-mode analysis.Our findings demonstrate that,when the refractive index is positive,the incident beam propagates through the plasma region with a slow decay while the amplitude of the incident beam decays obviously when the refractive index is negative,similar to the O-mode results.Compared with the O-mode simulation results under the positive fraction efficient condition,the wave decay is more obvious.This is because the chosen refraction index in the X-mode simulation is closer to 0 than that in the O-mode simulation,and this causes the dissipation term to affect the X-mode wave more.These simple results for simulating O-and X-modes confirm the FDTD module’s computation accuracy.
The results above show that the FDTD module calculates the propagation of the incident beam in the theoretical region.A more realistic region of vacuum and plasma with a gradient electron density is now adopted to test the applicability of this module.In this case,an O-mode wave is selected.Specifically,the vacuum region extends from 0 to 10λ and the plasma region spans from 10λ to 30λ.Within the plasma region,ωpe=0 atx=10λ,whereas ωpe=0.31416 atx=25λ,with ωpeincresing linearly.The location of the cutoff layer is atx=25λ.The incident beam frequency is chosen as ωsource=π/10 atx=0.5λ.The normalized units are also consistent with those mentioned previously.Figure 5 shows the results simulated by the FDTD module in such a region.Similar to the region in the theoretical region,the amplitude of the beam increases gradually during propagation to the cutoff layer,which is consistent with the Helmholtz equation.Finally,the wave is reflected by the cutoff layer atx=25λ.As we all know,the electric field of a propagation beam is not zero right at the cutoff layer.There is sample depth behind the cutoff layer,which is the distance between the cutoff layer and the location where the wave amplitude reduced to e-1of the amplitude at the cutoff layer.The electric amplitude is 1.994 atx=25λ,and the sample depth is about 0.65 λ from the figure.Theoretically,the sample depth is calculated by the wave equation and the result is Δx=Ln(4π2)-1)1/3[28],where λ0is the wave length andLnis the electron density gradient scale length.The sample depth is about 0.72λ according to the theoretical equation,which agrees with the FDTD simulation results.The inaccuracy between the simulation result and the theory is about 0.07 λ,only 1.4 grid in this simulation,and this error is within tolerance.Hence,the FDTD module’s applicability in the context of uniformprofile plasma has been validated.
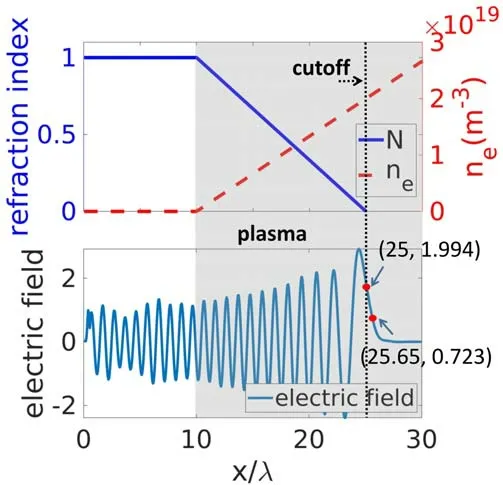
Figure 5.The electric amplitude calculated by the FDTD module in vacuum and plasma with linearly increasing plasma frequency.The shaded part on the right represents the plasma area.The electron density profile and the refraction index are also shown in the top figure.
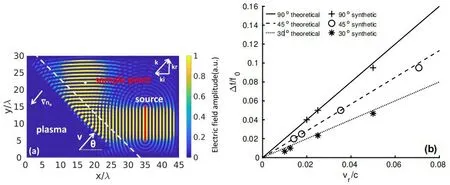
Figure 6.The source is set as π/10 at x=35λ .Plasma frequency is linearly increasing along the -x direction.The angle between the incident direction and the plasma boundary and the velocity of the plasma are scanned.The simulation and synthetic results align perfectly.(a)Contour plot of the FDTD module settings.(b) Comparison between theory and FDTD module.
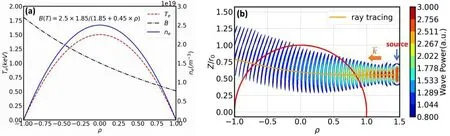
Figure 7.The results are simulated by ray tracing (solid line) and the FDTD solver (background) for microwave propagation in a tokamaklike plasma (area in red circle).The main optical paths of the FDTD solver and ray tracing solver fit well.The horizontal and vertical axes represent the normalized major radius and normalized vertical direction of plasmas,respectively.(a) The profiles of ne and B adopted in example.(b) The results obtained from the two methods.
3.2.Validation in moving plasma regions
The FDTD module possesses the essential characteristic of not only accommodating uniform-profile plasmas,but also moving plasmas.This is the main feature of this module.In order to validate the module’s calculation accuracy for wave propagation in moving plasmas,a Doppler effect simulation scheme is employed.This scheme involves a Gaussian beam with a normalized frequency of π/10 entering a moving plasma with a cutoff layer.The normalized units are not changed.The electron density is linearly increased along the-xdirection and the beam is reflected by the moving cutoff layer.If we set an observation point on the beam path,the Doppler effect can be extracted from the data at this point.The velocities of the plasmas and the incident angles are scanned.Then the Doppler frequency shift can be obtained by Fourier analysis of the GSD data.Finally,the simulated Doppler shift is compared with the formula,given as Δf=2·v·cosθ/λ.The region settings and results are shown in figure 6(a),wherevis the plasma velocity,θ is the incident angle and λ is the beam wavelength.The comparison shown in figure 6(b) infers that the simulation results and the theories are in good agreement.So,the FDTD module can give correct results when simulating the region of moving plasmas.
3.3.Validation between the ray tracing and the FDTD module
The test problem is configured asfinc=120 GHz,which is the frequency of an incident beam,withneandBprofiles,as shown in figure 7(a).The beam is arranged at ρ=1.5,propagating to the left.In the ECEI module,we calculate the beam trace from the antenna to the tokamak plasma by using the reciprocity theorem.It means that although the ECEI is a passive diagnostic,we set the receiving antenna as the source and calculate the trace of the light.Since the configuration in the FDTD test problem requires a much smaller grid size in order to cover the whole poloidal cross-section,it serves as an efficient test case for the cross-validation between the ray tracing and FDTD codes in GSD,withfinc=6 GHz,ne400 times smaller andB20 times smaller to configure an equivalent system as it in the ECEI module.
The cross-checked results between these two algorithms are shown in figure 7(b).The light paths calculated by ray tracing and the main light path simulated by the FDTD module fit well but not perfectly.This is because the raytracing method simulates the geometric ray,but the FDTD module simulates the whole beam with an experimental beam width.The scattered effect is more obvious in the FDTD module than in the ray-tracing method,especially in areas of high electron density gradient.In contrast,this also means that the observed location of the ECEI is not the standard rectangular arrangement,especially where the electron density gradient is high.Therefore,the observed area needs to be calibrated by the FDTD method at such locations.The correction of the two algorithms in GSD has been validated.
3.4.Validation of the 2D imaging of the ECEI module
To validate the workflow of the ECEI module,a realistic electron temperature profile (figure 8(a)) is adopted in this section,with the normalized radius ρ ranging from -0.2 to 0.3.The electron temperature setting is divided into two parts: the background and the fluctuation.The background temperature is 1500 eV while the electron temperature fluctuation is referred to ECEI data by shot #42289 at 1.0875 s on EAST,which is a typical electron temperature distribution of the tearing mode.The electron density,which strongly affects the optical thickness,is sufficiently large in this region,where the optical thickness can be regarded as optically thick.In the experimental setup,the antenna array is in a poloidal arrangement with 24 antennas and 16 frequencies chosen,which defines the radial resolution.So,the visual location arrangement in the GSD is also 16(radial) × 24 (poloidal).The result obtained from the GSD is the radiation temperature,which can be compared with the real electron temperature.The radiation temperature along the radial (horizontal) and poloidal (vertical) directions in figure 8(b) is basically the same as the real temperature setting.The figure 8(c) shows the real and radiation temperature at the location of poloidal antenna 3.Figure 8(d) shows the real temperature at the location of radial channel 14 and radiation temperature at the location of radial channels 14 and 15.The solid lines represent the real temperature and the dots represent the radiation temperature generated by GSD.According to the results,the radiation temperature is a little smaller than the real temperature in the whole area.One of the reasons for this is the absorption by plasmas.In other words,according to equation (1),the coefficient of real temperature (1-e-τ) is smaller than 1.The optical thickness calculated by GSD is about 6.71 and the coefficient(1-e-τ)=0.998.The ratio of the radiation and the real temperature is about 0.996 after excluding the effect of frequency shifts due to relativistic effects.These two coefficients are almost equal.The other reason is the limitation of calculation accuracy.However,this does not affect the temperature fluctuation analysis and only tiny errors stem from this issue.From figure 8(c),it is worth noting that the simulated radiation temperature seems to shift to the lowfield side according to antenna 3.This causes the results to deviate from a perfect fit for the radial channels,such as channel 14.This is because the ECE radiation frequency is shifted to a lower frequency due to relativistic effects.The radiation frequency received by ECEI is the lower frequency.However,the ECEI analysis only considers cold resonance without a frequency shift.This causes the whole observed area to shift towards the low-field side.What is particularly worth mentioning is that the radiation temperature of channel 15 agrees with the real temperature of channel 14 very well,as figure 8(d) shows.The mean square error between the real temperature of channel 14 and the radiation temperature of channel 14 is 101.67,but it is only 19.75 between the real temperature of channel 14 and radiation temperature of channel 15.This means the shift distance caused by the relativistic effects is about one channel or 0.03ρ in this example.This location shift simulation is also an important application of synthetic diagnostics and it can be determined quantitatively.Hence,the ECEI module workflow can be successfully executed,thereby producing credible radiation temperatures for further analysis.
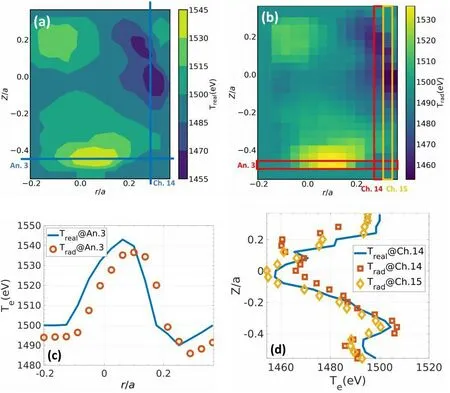
Figure 8.The electron temperature profile setting is shown in (a).The radiation electron temperature simulated by GSD is shown in (b),with 16 (radial) × 24 (poloidal) observed locations.The comparison between the real temperature and the radiation temperature by the chosen channels and antenna in radial and poloidal direction is shown in (c) and (d).The solid lines represent the real temperature while the dots represent the radiation temperature in different channels and antennas shown as lines and boxes in (a) and (b).The radiation temperature is restored well except for a little observation location shift.
4.Summary and conclusions
A general synthetic diagnostic platform has been established and applied to an MIR and ECEI,which provides a firstprinciples-based approach to interpreting experimental data.Most diagnostics are based on ideal situations and simplified physical formulas.When there is turbulence in the plasma or perturbations in the formulas,the ideal situations are disrupted.For example,the assumption of optical thickness is not satisfied in ECEI,the relativistic effect mentioned in section 3.4 and the ‘shape-matching’ issue of the MIR mentioned above.These small non-ideal effects more or less influence the final diagnostic quality.The synthetic diagnostics platform,which is a forward-modeling platform,can help to analyze these perturbations.At present,this GSD platform is applicable to the MIR and ECEI on EAST.Due to the module’s generalization and scalability,this platform can also be used for many other microwave diagnostics in tokamaks,such as CPS and DBS.
Benchmarking tests have been conducted between the FDTD results and the theories in uniform-profile and moving plasma regions to confirm the applicability of the FDTD module.Simulating 2000 time steps for 200 × 200 grids incurs a computational expense of approximately 14 s of wait time for static plasma conditions.In experimental cases,there needs to be 1000 × 1000 grids simulating for 10000 time steps,and it would cost approximately 5000 s wait time for moving plasma conditions in such experimental grids.
As for the ECEI module,the main methods,like the raytracing module,are tested to confirm the correction.Finally,the whole workflow of the ECEI module is tested.All results prove that this GSD platform is correct and credible for basic simulations.The wait time for the 16 (radial) × 24 (poloidal)channels in section 3.4 is about 5500 s.At present,all modules in the GSD platform are simulated on a single CPU.The platform is really useful for processing diagnostic data,so we want to analyze the data during the interval between two discharges to enable timely adjustments to the experiment,particularly for the MIR.In addition,parallel computing needs to be added to the GSD platform so that the wait time can be reduced by tens of times,depending on the number of CPUs.The wait time can be compressed to several minutes to meet the requirements of short-period analysis.This represents the future work concerning the application of the platform.
The whole package is composed of many modules,so it is easy to use and develop.This paper only describes the basic functions of the GSD platform and more useful modules will be developed to solve more physical problems in the future,such as a non-thermal module for studying the impact of non-thermal electron emission on electron cyclotron emission and a post-processing module for ECEI and the MIR module.This GSD platform will be open source soon.
Acknowledgments
This work is supported by the National Magnetic Confinement Fusion Energy Program of China (No.2019YFE03020001),the Collaborative Innovation Program of Hefei Science Center,CAS (No.2021HSC-CIP010) and the Fundamental Research Funds for the Central Universities.
猜你喜欢
杂志排行

Plasma Science and Technology的其它文章
- Forward modelling of the Cotton-Mouton effect polarimetry on EAST tokamak
- First results of CO2 dispersion interferometer on EAST tokamak
- Reconstruction of poloidal magnetic field profiles in field-reversed configurations with machine learning in laser-driven ion-beam trace probe
- Electron density measurement by the three boundary channels of HCOOH laser interferometer on the HL-3 tokamak
- Development of a toroidal soft x-ray imaging system and application for investigating three-dimensional plasma on J-TEXT
- Inward particle transport driven by biased endplate in a cylindrical magnetized plasma