Estimating the yield stress of soft materials via laser-induced breakdown spectroscopy
2024-03-25ShuhangGong龚书航YajuLi李亚举DongbinQian钱东斌JinruiYe叶晋瑞KouZhao赵扣QiangZeng曾强LiangwenChen陈良文ShaofengZhang张少锋LeiYang杨磊andXinwenMa马新文
Shuhang Gong(龚书航), Yaju Li(李亚举), Dongbin Qian(钱东斌), Jinrui Ye(叶晋瑞),Kou Zhao(赵扣), Qiang Zeng(曾强), Liangwen Chen(陈良文),Shaofeng Zhang(张少锋), Lei Yang(杨磊), and Xinwen Ma(马新文)
1Advanced Energy Science and Technology,Guangdong Laboratory,Huizhou 516000,China
2Institute of Modern Physics,Chinese Academy of Sciences,Lanzhou 730000,China
3University of Chinese Academy of Sciences,Beijing 100049,China
Keywords: laser-induced breakdown spectroscopy,soft materials,yield stress
1.Introduction
Yield stress is one of the most important mechanical parameters of materials.Estimating it timely and nondestructively is significant for many investigations on physical properties of the material itself, as well as for some related applications.With sufficiently low mechanical properties, soft materials such as powders, usually present extreme instabilities in structures.Accordingly, it is impossible to timely estimate their yield stress noninvasively by traditional methods,such as the most common method rheometer testing(RT).[1-4]The estimation with RT method depends on the construction of well-controlled fluid layers, which involves an incrementally increasing stress or strain until a critical value is identified at which the material starts to flow.More often, the RTbased estimation is conducted by shearing the material fixed on a holder at a constant shear rate; a peak or a plateau of stress is obtained before flowing.All of these reveal the intrinsic drawbacks of RT method, time consuming, seriously destructive to materials,unsuitable forin-situtest,and so on.
Laser-induced breakdown spectroscopy (LIBS) is an emerging spectroscopic technique to identify and quantify the elements contained in a material by optical emissions of plasma generated by focused laser pulse ablating the material surface (see, for example Refs.[5-7]).Compared with conventional techniques, the attractive advantage of LIBS is that without sample preparation,in-situ, and real-time detections could be achieved with minimal destruction to sample.Therefore, LIBS technique has good application prospects for materials’ elemental analysis in industrial processes, especially the processes concerning hostile and/or inaccessible environments.Certainly,it also often runs into soft materials such as powders consisting of fine grains,[8-10]because a considerable portion of industrial products exists in at least one stage during manufacture as a powder material.[11]
In studies on LIBS technique for soft materials, spectral emissions are generated by focusing laser pulses onto soft surfaces.It should be mentioned that the analytical performance of LIBS is usually suppressed as the spectral emissions fluctuate among soft materials with diversity of mechanical properties(hereinafter called mechanical effect).[5,9,10]Therefore,LIBS-based analysis of soft materials requires to understand the complex interaction between laser pulse and soft surface,especially to figure out the LIBS signals complicated by the mechanical effect.In fact, our recent experiments[12]have been dedicated to the investigations of the mechanical effect taking a set of soft samples, prepared by loose packings of size-selected Cu microspheres with sizes ranging from 109µm to 297µm(smaller sizes to poorer mechanical properties),as examples.It was found that changing the grain size leads to a trend variety of the relationship between plasma emission intensity(I)and laser pulse energy(E).To put it simply,smaller grains exhibit more contrastingI-Erelationships compared to the block Cu material reported by Femandezet al.[13]The findings were interpreted by considering that the samples’mechanical performance to support the laser-induced recoil pressure (LIRP) imparted by the processes of plasma generation and expansion,becomes worse with decreasing grain size and increasingE.Especially for the smallest size, the trend of the measuredI-Erelationships presents a reversal:Ivalue increasing initially and then decreasing with incrementalE.This leads to speculate that there might be a well-defined critical energy,at which a change in the dynamic response of the sample to the LIRP takes place,influencing the forming environment of the plasma as an emission source for LIBS measurement.According to the fact that soft materials are often considered as a non-Newtonian Binghanm fluid with a yield stress,[1-4]the change may stem from the LIRP strength at the critical energy reaching the sample’s yield point.As a result, below and above the critical energy,the sample exhibits distinct mechanical performances to react on the generating/expanding plasmas,finally causing a striking difference in plasma emission.Therefore,it is expected that by measuringE-dependent LIBS for a set of soft samples,it would be possible to establish an LIBS-based method for estimating the yield stress of soft materials using the possible critical energy as an indicator.
In this paper,we report an experiment designed to investigateE-dependent LIBS of three soft samples prepared by loose packings of size-selected Cu microspheres with sizes smaller than those investigated previously.[12]By extending the samples’ mechanical properties (yield stress specifically involved here) down to a previously untouched region, the experiment provides clear evidence that the speculation mentioned above is true and reveals that using LIBS as a method for estimating the yield stress of soft materials is feasible.
2.Material and methods
Three piles of dry unconsolidated Cu microspheres(density, 8.9 g/cm-3; purity, 99.99%) with narrow size distributions around the median diameters of 77 µm, 95 µm, and 109µm,respectively,were used to prepare the samples to be investigated, labelled as Sn(n=1-3).The detailed description on the preparation procedure can be found in Ref.[12].Briefly, it involves a two-step procedure, including (i) gently and slowly pouring these microspheres into the same cubic containers (10 cm inside length); (ii) using a straight edge to level each sample surface without any noticeable compaction.Such a preparation procedure enables the samples having the following features, i.e., sufficiently low yield stresses and some difference in yield stress mediated only by grain size.Before performing the LIBS measurements,the samples’yield stress was determined with a rotational rheometer (HAAKE Viscotester iQ Air)at a constant shear rate of 0.01 rad/s.The values of yield stress extracted from the measured stress-strain curves[see Fig.1(a)]are plotted in Fig.1(b).The increase of yield stress from S1to S3reflects that grain size is a crucial parameter in influencing the mechanical properties of powder materials.[2,3,14]It should be noted that S3was also used in the previous experiment(Ref.[12]),wherein it has the poorest mechanical properties among those investigated samples,indicating that here we extend the samples’mechanical properties down to a previously untouched region.

Fig.1.The stress-strain curves measured by the rotational rheometer for the three samples(a)and the yield stresses extracted from the curves(b).
The schematic diagram of experimental setup used in this work is shown in Fig.2.AQ-switched Nd:YAG laser with a fundamental wavelength of 1064 nm and pulse duration of 7 ns was used as the ablation source.The laser beam first passed through an optical attenuator for pulse energy change and reflected by dichroscope,and then passed through a planeconvex quartz lens with a focal length of 80 mm and a diameter of 25.4 mm,and finally was focused onto the sample surfaces which was exposed to air at atmospheric pressure.All the sample surfaces were placed closer to the lens by 12 mm with respect to the focal plane.The laser spot focused onto the sample surfaces was about 600µm in diameter which is relatively large compared with the grain sizes here,and therefore,is beneficial to reproduce the emission of plasma formed from the same sample.The dichroscope,which was used to reflect laser beam,was also simultaneously employed to transmit the plasma emission lights.The transmitted emission lights were focused to an optical fiber by another plane-convex quartz with a focal length of 35 mm and a diameter of 12.7 mm,and finally fed to an Echelle spectrometer(LTB,ARYELLE 200)with a wavelength range of 200 nm-750 nm, and recorded with an intensified charge-coupled device (ICCD, Andor, DH 334T).In the experiments, the relative efficiency of the spectrometer was calibrated by a deuterium-halogen tungsten lamp,and the gate delay of the ICCD detection was set at 1 µs and the gate width was set at 2 µs.To provide a fresh point for each laser shot and to avoid the influence of the excavation initiated by the LIRP on subsequent LIBS measurements,[10,15]we use two special operations: (i)the sample is moved rapidly on the plane perpendicular to the laser beam by a translation stage with a speed of 7 mm/s; and (ii) the sample in the container is emptied, refilled, and leveled in the same way after every 80 single-shot measurements.For more details about the sample preparation and the experimental system, please refer to previous publications.[16-18]
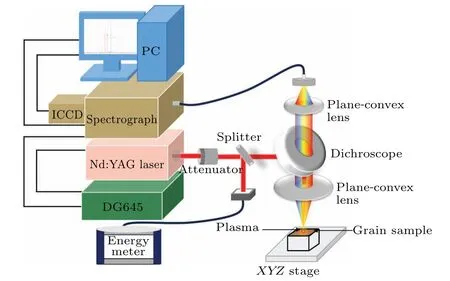
Fig.2.Schematic diagram of the experimental setup.
3.Results and discussion
In Fig.3 we display the segments of the measured LIBS spectra for S1at differentEover the wavelength from 509 nm to 524 nm.In the following investigation, we chose three emission lines Cu I 510.55 nm, Cu I 515.32 nm, and Cu I 521.82 nm, just located in the limited range, as diagnostic tools.One can see from Fig.3 that the intensities of the three emission lines exhibit the same trend of increasing initially and then decreasing with the incrementalE.For the other two samples, the LIBS spectra present a similarE-dependent behavior and are not shown repetitively here.
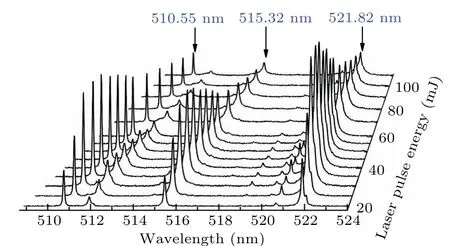
Fig.3.Segments spectra of LIBS for S1 obtained at different laser pulse energies.Each spectrum was generated by the accumulation of 80 single shots.
To quantify theI-Erelationships for the samples, the peak areas of the three Cu I lines were obtained by Lorentz fitting.The quantitativeI-Erelationships (see Fig.4) show two interesting features.One is that for each sample,they are two distinct regions separated by a well-defined critical energy(marked with dotted lines in Fig.4): whenEis less than the critical energy, a fastIgrowth is evident with the incrementalE; however, whenEexceeds the critical energy, theIvalues abruptly show different degrees of decrease with the incrementalE.This provides clear evidence that the speculation described in the previous part, at least about the existence of a well-defined critical energy, is true.Another feature is that the critical energy has a positive correlation with the grain size limited here and thus with the yield stress of the three samples limited here, implying that there seems to be an internal connection between the well-defined critical energy and the samples’yield stress.
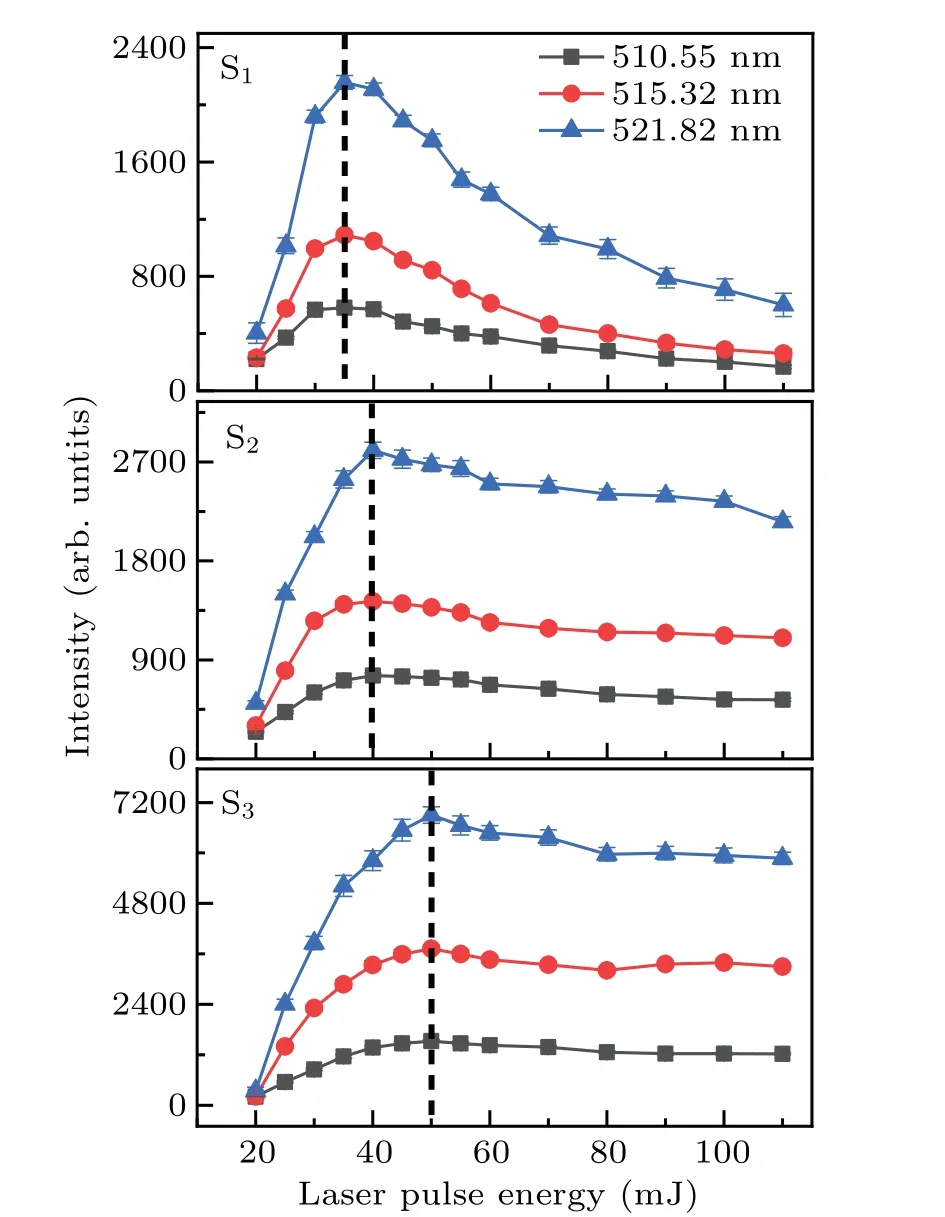
Fig.4.Intensities of Cu I lines at 510.55 nm,515.32 nm,and 521.82 nm as a function of laser pulse energy for the three samples.Error bars correspond to the standard deviations obtained from a series of 10 spectra generated by 80 single-shot LIBS accumulations.The dotted lines represent the positions of the critical energies.
To uncover the physics behind the existence of such a critical energy,exploring theE-dependent electron densityDand plasma temperatureTis necessary,because theD-EandT-Erelationships could help us to understand the change of the influence of the sample surface on the plasma formation with the incrementalE.Here,following previous studies,[12]the Starkbroadening of Cu I 510.5 nm was selected to calculate the electron density.The temperature was calculated by the Boltzmann plot method which depended on the obtained intensities of the three emission lines shown in Fig.4 and the corresponding spectroscopic parameters summarized in Refs.[17,18].
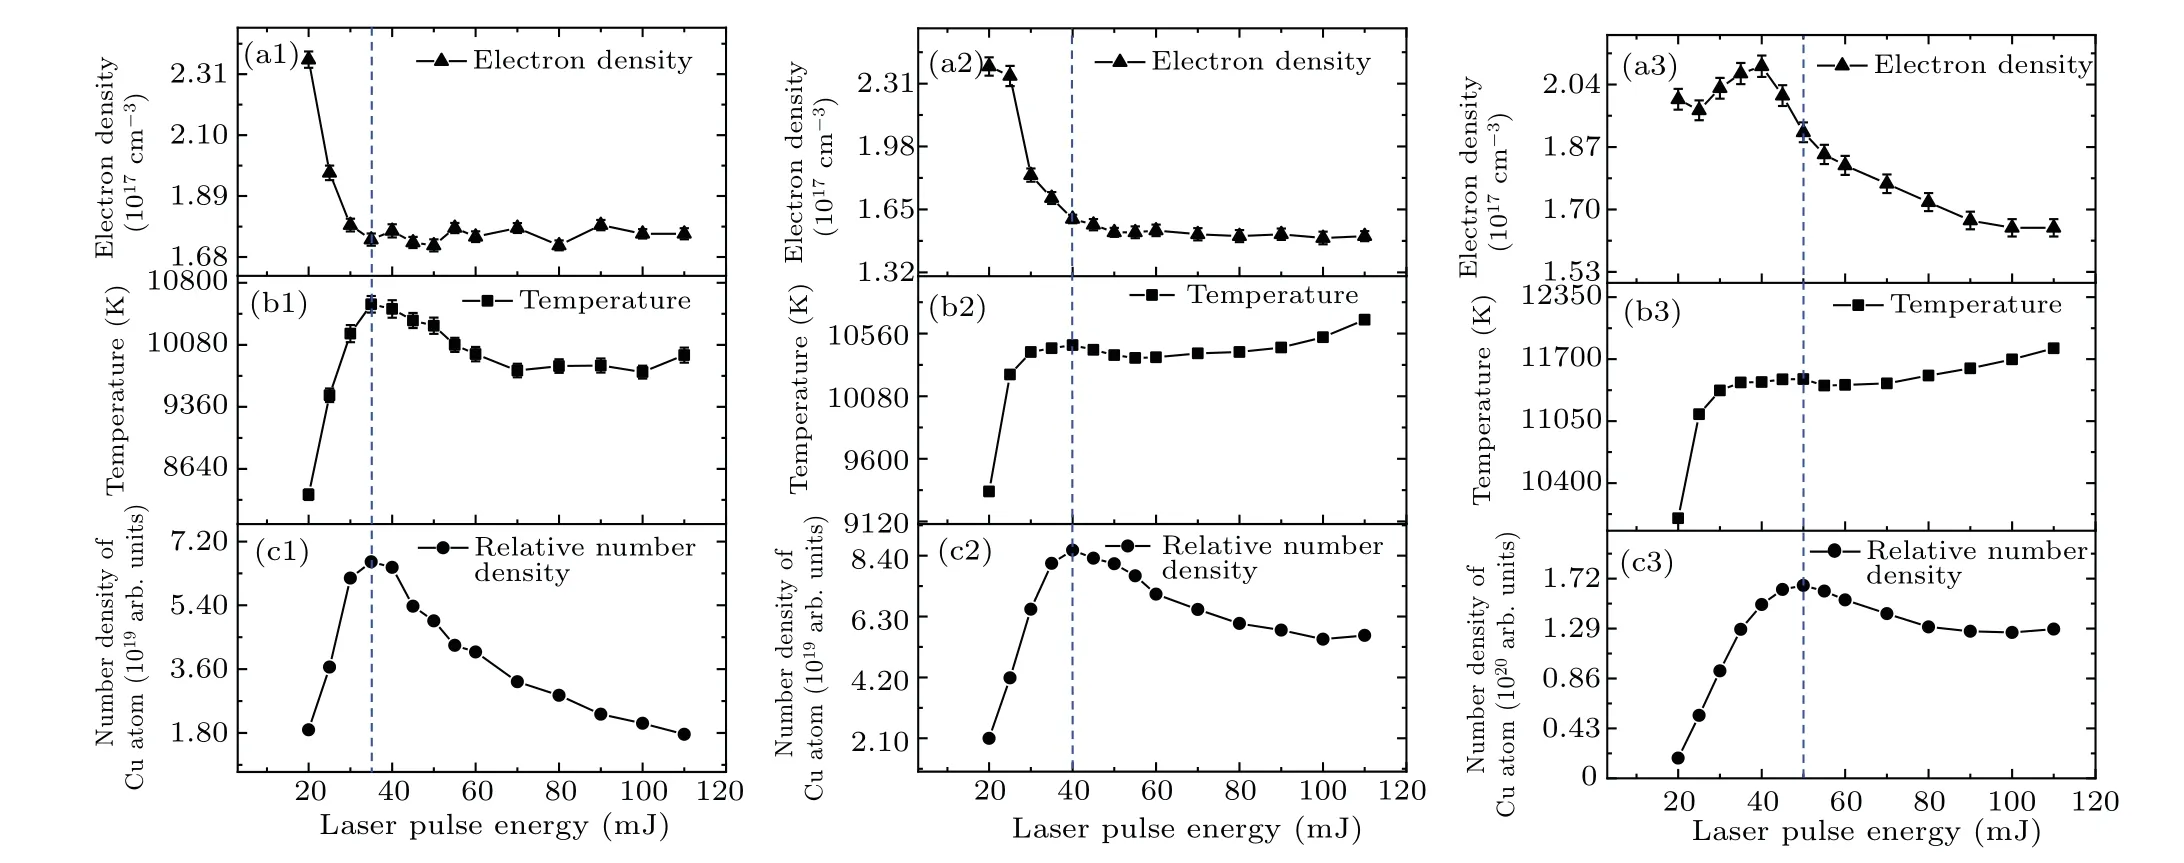
Fig.5.The electron density (upper row, (a1)-(a3)), plasma temperatures (middle row, (b1)-(b3)), and relative number density (lower row,(c1)-(c3))as a function of the laser pulse energy for samples S1 (left column),S2 (middle column),and S3 (right column).
The calculatedDandTvalues as functions ofEfor the three samples are plotted in Figs.5(a) and 5(b), respectively.As seen from Figs.5(a1)-5(a3), the electron density values of the samples are greater than 1017cm-3,indicating that the plasmas are at local thermal equilibrium (LTE)condition under McWhirter criterion.[5,19]The variations ofTwith the incrementalEfor all the three samples present similar trends to those of the relationships ofI-E[see Figs.5(b1)-5(b3)].It should be noted that theTvariations(8340 K-10550 K for S1,9349 K-10471 K for S2, 10031 K-10490 K for S3) are not as steep as theIvalues measured,especially whenEexceeds the critical energy.Actually,in a luminous plasma,the intensity of an emission line is determined not only by the plasma temperature but also the number density of the corresponding emitting species.Under the LTE approximation, the line intensity can be expressed by the following relation:[5,19-22]
whereNis the number density of the emitting species, andU(T) is the partition function of the emitting species;Ekis the upper-level energy related to the spectral line andkBis the Boltzmann’s constant.Here,we use the Cu I line at 510.55 nm to derive the relationship between the relativeNof Cu atoms and theEby putting the measuredIand the calculatedTinto Eq.(1),namely,
The derivedN-Erelationships [see Figs.5(c1)-5(c3)] shows similar trends with those of the emission lines displayed in Fig.4.This implies that,compared with the plasma temperature,the number density of Cu atoms dominates the evolution ofI-Erelationships.
Furthermore, the three samples investigated here can be considered as non-Newtonian Binghanm fluids with yield stresses,[1-4]as mentioned in Section 1.During a laser ablation event, the samples’ mechanical performance to react on the generating/expanding plasma depends on the LIRP strength,and thus on the laser pulse energy to be used.[5,6,23,24]Our measurements imply that whenEis less than the critical energy,the samples suffer a weak LIRP’s strength because small laser energies input.In this case, each sample has a yield stress larger than the LIRP’s strengths, displaying quite good mechanical performances to rebound the plasma.As a result, the samples exhibit theI-Erelationship similar to the block Cu material, namely, larger laser energies to stronger plasma emissions.With the increase ofEto the critical energy, a reverse of theI-Erelationship occurs for each sample.This is understandable when considering that the LIRP’s strength at the critical energy starts to match the samples’yield strength.Following this line,with the further increase ofE,the LIRP’s strength exceeds the samples’yield stress.In this case,each sample displays quite poor mechanical performances to rebound the plasma,instead,leading to an efficient surface absorption of the recoil energy of ablated species located in the plasma and of the species themselves(larger laser energies to poorer mechanical performances,and to higher absorption efficiencies).As a result,whenEexceeds the critical energy,the plasma emission and the number density of Cu atoms present a decreasing trend with the incrementalE.
It should be stressed that such a reversal phenomenon observed in our spectroscopic results should be a common phenomenon inE-dependent LIBS of soft materials.Furthermore, the reversal occurring at a well-defined critical energy,which is easily obtainable from LIBS measurements, is directly linked to the materials’ yield point.All of these imply that, for one type of soft materials having mainly differences in mechanical properties, there should be a one-to-one correspondence between the critical energy and the material’s yield stress.Indeed, our spectroscopic observations provide direct evidence for the implication (see Fig.6): a monotonous increase of the critical energy with the incremental yield stress.This reveals that LIBS measurements are successful in estimating the yield stress of soft materials,at least to those having the yield strengths comparable to or lower than investigated here, by simply monitoring the relationship between plasma emission intensity and laser pulse energy.Considering that such an LIBS-based method for yield stress estimation only involves incrementally increasing laser energy until a critical value is identified at which a peak of plasma emission intensity is obtained,it is expected that,compared with the conventional RT method,it has many attractive advantages such as no sample preparation,real-time&in-situdetection,and minimal destructive to sample materials.
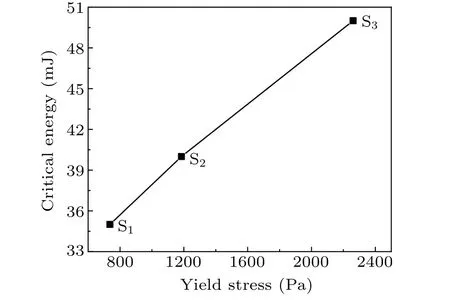
Fig.6.Correlation between the critical energy and the yield stress for the three samples.
4.Conclusions
This work aims to experimentally demonstrate the potential of employing LIBS to estimate the yield stress of soft materials.An experiment was performed to investigate the changes of LIBS for soft materials with the laser pulse energy.By extending the materials’softness to a previously untouched region,we observed an interesting reversal phenomenon in the trend of the measured relationships between atomic spectral intensity of LIBS signal and laser pulse energy:increasing initially and then decreasing separated by a well-defined critical energy.Such a reversal phenomenon was explained by considering the soft materials as non-Newtonian fluids: in the range of laser energy above(below)the critical value,the recoil pressure imparted by the energetic processes of the plasma generation and expansion is larger(smaller)than the materials’yield stress.As a result,there is a one-to-one correspondence of the samples’ yield stress with the critical energy.Based on this,we proposed a method for estimating the yield stress of soft materialsviaLIBS, having many attractive advantages over conventional rheometer testing.
Acknowledgements
Project supported by the National Key Research and Development Program of China (Grant No.2017YFA0402300)and the National Natural Science Foundation of China(Grant Nos.U2241288 and 11974359).
猜你喜欢
杂志排行
Chinese Physics B的其它文章
- A multilayer network diffusion-based model for reviewer recommendation
- Speed limit effect during lane change in a two-lane lattice model under V2X environment
- Dynamics of information diffusion and disease transmission in time-varying multiplex networks with asymmetric activity levels
- Modeling the performance of perovskite solar cells with inserting porous insulating alumina nanoplates
- Logical stochastic resonance in a cross-bifurcation non-smooth system
- Experimental investigation of omnidirectional multiphysics bilayer invisibility cloak with anisotropic geometry
