Investigation of the self-induced magnetic field characteristics in a pulsed plasma thruster with flared electrodes
2020-04-24QiLIU刘祺LeiYANG杨磊YupingHUANG黄玉平XuZHAO赵絮andZaipingZHENG郑再平
Qi LIU(刘祺),Lei YANG(杨磊),Yuping HUANG(黄玉平),Xu ZHAO(赵絮)and Zaiping ZHENG (郑再平)
Beijing Research Institute of Precise Mechatronics and Controls,Beijing 100076,People’s Republic of China
1 Author to whom any correspondence should be addressed.
Abstract
Keywords:pulsed plasma thruster,numerical investigation,magnetic flux density,flared electrodes
1.Introduction
Pulsed plasma thrusters (PPTs) are a kind of electromagnetic accelerator for spacecrafts.Due to their flexible power and robust structure,PPTs have been applied to several space missions to execute orbital and attitude adjustment.In 1964,the PPT in Zond-2 became the first electric propulsion system used in space[1].However,due to the lower performance of the PPT compared with other thrusters such as Hall thrusters and ion thrusters,PPTs were not recommended for space application.Actually,PPT has a typical thrust efficiency of 5%–15%,while other thrusters have an efficiency of 50%[2].In recent years,PPTs were optimized to higher efficiency and were selected as the main propulsion system for the lunar exploration mission BW1(Baden-Württemberg 1)[3].Much effort has been made to improve the performance of PPTs [3–8].It was found by experimental research that some approaches could optimize the performance,such as increasing the aspect ratio [3,9],which is the ratio of the gap between the electrodes and the width of the electrodes,and raising the discharge energy [9,10].So the configuration and the working process of this kind of PPT are worth investigating.Actually,such approaches may promote the thruster performance by influencing the magnetic field in the discharge channel,which could enhance the acceleration of the particles.
Magnetic field significantly affects the behavior of plasma and plays an important role in the working process of a PPT.The magnetic field might also be responsible for the erosion phenomenon due to its confinement of the ions that bombard the electrodes.When it comes to numerical study,an accurate magnetic field model could be the foundation of the magnetohydrodynamics or particle-in-cell simulations[11,12].This work builds a model to describe the magnetic field in spatial and temporal view for a better understanding of the working process and thruster structural design.
Several research works have been done in the selfinduced magnetic field in the past twenty years.Koizumi et al measured the magnetic flux density by a magnetic probe.However,in order to prevent the disturbance of the plasma flow,the magnetic probe was placed outside the sidewalls of the PPT,explicitly,and the probe was not in the discharge channel.So only qualitative results were presented [2].Scharlemann measured the magnetic field at three different axial positions in a Teflon-fed PPT and water-fed PPT with a magnetic probe.One of the positions was between the electrodes,the others were at the exit and in the plume.The distribution of the magnetic field between the electrodes was yet to be investigated [13].Lau et al measured the selfinduced magnetic field at several discrete points along the centerline of the discharge channel by inductive miniaturized probes.However,the magnetic field near the electrodes is difficult to acquire due to the fact that it would interfere with the plasma [14].They also presented that the magnetic flux density peaks at the area close to the Teflon surface,and the value is up to 0.82 T at 1300 V discharge voltage,with a total capacitance of 80 μF [5].
It could be seen that several experimental investigations have been made on the magnetic field of PPTs,however,the insertion of inductive probes disturbs the flow of plasma in the discharge channel due to the fact that the size of the probes cannot be neglected.Considering the pulsed discharge characteristics of the PPT,the magnetic field might not be totally identical in different pulses.The magnetic flux density at different positions could not be measured synchronically only if multiple magnetic probes are applied,which may introduce more disturbance of the plasma.In addition,the probe could be easily destroyed by the particles in high energy in the discharge channel.Considering the facts mentioned above,studying the magnetic field by modeling and calculating is an efficient and economic way.Nawaz et al applied a refined magnetic field model to a PPT called SIMPLEX(Stuttgart impulsing magnetoplasmadynamic thruster for lunar exploration) with parallel electrodes.No plasma sheet was considered in their calculation [15].Nawaz et al then built a more complete model,including the slug model of this thruster,and compared the results with experimental data[16].As mentioned above,increasing the aspect ratio could promote the thruster performance,and the application of the flared electrodes could be a direct way to increase the aspect ratio.As for the flared structure,Krejci et al built an analytical model to assess the electrode configuration of a PPT[17].The electromagnetic impulse bit was calculated as a criterion of performance analysis.It was concluded that the electromagnetic impulse bit peaks when at a flared angle of electrodes is about 25 deg.

Figure 1.The PPT with flared electrodes.(a) The schematic of the thruster.(b) The side view and computational domain.
This work would build a magnetic field model and analyze the field quantitatively.Unlike previous research works,the structure of the electrodes would be discussed in terms of the magnetic field.Above all,this work is going to provide suggestions for thruster design and enhance the understanding of the working process of the PPT.
2.Analytical model
2.1.The model of the magnetic field
In order to study the magnetic field in the PPT with flared electrodes,as shown in figure 1,a calculation model is established.In the figure,deis the distance between the parallel parts of the anode and the cathode,h is the gap between the electrodes,which increases as the position x moves downstream,φis the flared angle of the electrodes,dendingis the distance between the electrode endings,and lelectrodeis the total length of the electrodes.
In this work,the model is built under the following assumptions:the plasma blob is assumed as the plasma sheet,which is perpendicular to the x axis at all times.In other words,the plasma sheet canting is not considered.The mass of the plasma sheet is assumed to increase as it moves downstream[18–20].It is also assumed that only one plasma sheet exists at every moment,and that the mass of the plasma concentrates on the plasma sheet,which is the same assumption appearing in the slug model.The discharge current is acquired from experiments and inputted into the simulation,while the displacement current is disregarded in the calculation of the magnetic field.In addition,the magnetic field induced by the current in the plasma sheet would be ignored in this simulation.Since the thickness of the plasma sheet would be much broader than that of the electrodes’,the induced magnetic flux density would be partly canceled out in the plasma sheet.On the other hand,the magnetic field induced by the current within the plasma sheet does not contribute to the acceleration process [17],so such ignorance may have little influence on the analysis of plasma acceleration via magnetic flux density distribution.However,the existence and the directional movement of the plasma sheet are still admitted.Moreover,the magnetic field in the thruster is simplified as a two-dimensional model in the x-y plane,and some characteristics in the third dimension are not investigated in this work.
The magnetic field induced by the current could be expressed as

The magnetic flux density in z direction Bzis the main issue considered in this work:

where

μ0is the vacuum permeability,I is the current,which induces the magnetic field,l is the direction vector of the current,eris the direction vector of the vector pointing from the current element to the calculation point,α is the included angle of l and er,r is the distance between the current element and the calculation point,and r0is the perpendicular distance between the current and the calculation point.
Equation (2) is a concise description of magnetic field because it could be integrated analytically when the current flows in straight carriers:
Figure 2.The detailed calculation elements in the PPT with parallel electrodes.
The magnetic flux density could be calculated by the superposition of several parts where the current flows as shown in figure 2.Explicitly,the magnetic field is induced by the current in the two parts,I and II.In figure 2,the two parts of the magnetic field are going to be obtained by integrating the angles from α1to α2,and from β1to β2,respectively.Since only the magnetic flux density in the z-direction is considered in this work,the subscript z is omitted in the following equations.The total magnetic flux density of a traditional PPT with parallel electrodes could be expressed as
where r1and r2are the perpendicular distance between the electrodes and the calculation point.
The detailed expression of magnetic field calculated in PPTs with parallel electrodes is presented in equation(6)and in figure 2,however,the field of the flared electrode case is more sophisticated due to the fact that the structure of the flared angles in the electrodes should be considered.The magnetic field would be the superposition of the field induced by the current in the parallel parts and the flared parts of the electrodes,as shown in figure 3.The magnetic flux density induced by the current in the flared part(IV and V in figure 3)and the bending part (III in figure 3) of the electrodes,i.e.,Belectrodes_flaredand BAnode_bending,should be included as follows:

where Belectrodes_parais the magnetic flux density induced by the current in the parallel part of the electrodes (I and II in figure 3).As shown in figure 3,the integration of equation(5)from α1to α2and from β1to β2are added to be Belectrodes_para:


Figure 3.The detailed calculation elements in the PPT with flared electrodes.(a) The parallel part and (b) the flared part.
where r1–r5are the perpendicular distances between the current in elements I–V and the calculation point.
As mentioned in [18],for ablative PPTs,the mass of the plasma sheet would increase as it traverses,so a dynamic mass model is applied.A quasi-steady state of the mass flow is assumed and thus the mass of the plasma sheet could be derived.In the flow where the magnetic pressure is much higher than the plasma pressure and where the magnetic Reynolds number is high,a magnetosonic condition exists where the flow speed is equal to the local value of Alfvén sound speed[20].Based on the quasi-steady flow assumption and the law of conservation of momentum,the mass of the plasma sheet is estimated as
where A is the area of the propellant surface,w is the width of the electrode and vcritis the Alfvén critical speed.The area A could be described as the product of the propellant height hp,which is related to de,and the propellant width wp.So themass of the plasma sheet is

Table 1.Parameters of the validation case.

The formula of mass calculation contains the information for electrode configuration,which is w and hp,and the measured current I,so it is believed that the model is compatible with the present thruster.
During the operation of the PPT,the electromagnetic acceleration of the plasma sheet is produced by the Lorentz force,so the x-position of the plasma sheet xp(t) could be calculated by applying Newton’s second law and solving the kinematics equations as follows:

where vpis the velocity of the plasma sheet.
The discharge current I(t) is a crucial parameter for the description of the thruster performance,because it is related to the magnetic field and extensively the mass bit.In order to present a magnetic profile that is closed to its actual distribution,the current data is obtained experimentally for thrusters with different geometries.The Rogowski coil is placed around the cathode column of the capacitor.
Considering the computer memory and the curve resolution,the time step of the magnetic field calculation is set as 10−9s,while the grid size is 2.5×10⁻⁴m.For the PPT with a flared angle of 10 deg and an electrode gap of 21 mm,the calculation area is 82.5 mm×33 mm and the total number of grids is 43560.The related electric and structural parameters of the thruster model are described in table 1.
2.2.Model validation
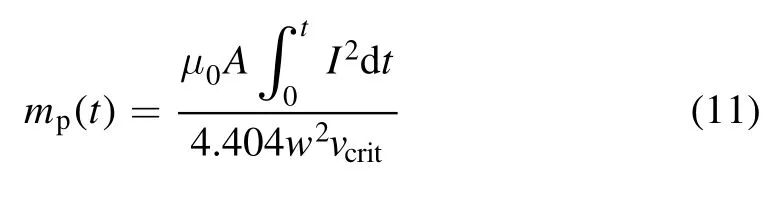
In the temporal axis,the calculated magnetic flux density at different positions on the centerline varying with time is compared with the experimental curve (figure 4(a)) in literature[14].The current data is acquired from the experiments of a PPT developed by the Beijing Research Institute of Precise Mechatronics and Controls.The flared angle of the thruster is 20 deg,deis 21 mm,and the capacitance is 80 μF,which are the same as the parameters in [14].As shown in figure 4(b),the maximum of the magnetic flux density at x=6 mm is
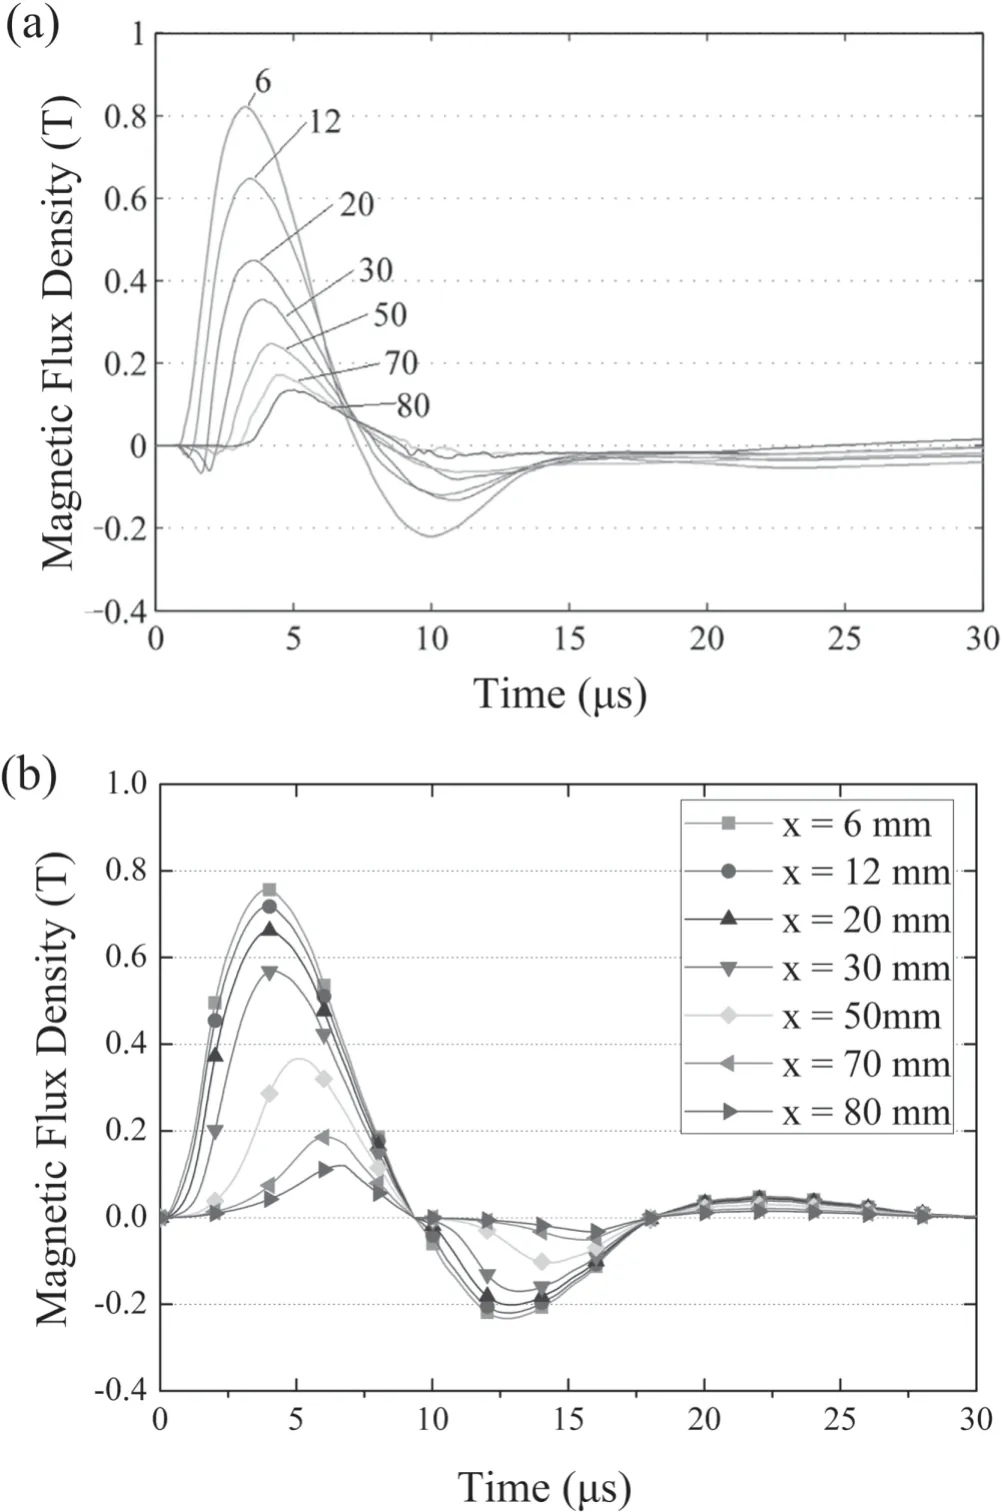
Figure 4.The magnetic flux density at different axial positions on the centerline of the discharge channel.(a) Experimental results in [14](Reprinted from [14],copyright (2014),with permission from Elsevier).(b) Calculated results in this work.
about 0.76 T,while at the exit of the discharge channel,x=70 mm and 80 mm,the peak values of magnetic flux density descend to 0.1–0.2 T,which coincide with the experimental data pretty well.In the middle area of the channel,the calculated magnetic flux density is higher than the experimental one.As a whole,the curves and the values of the magnetic flux density simulated by the model are in accordance with the experimental results.
3.Results
3.1.Magnetic profile
The discharge current used in calculations was measured by a Rogowski coil experimentally.Thrusters equipped with electrodes in different geometric structures were tested and the discharge curves were acquired.The experimental current data of a thruster,of which the electrode flared angle is 10 deg and deis 21 mm,is applied to the magnetic field model.The magnetic profile is presented in figure 5.It should be mentioned that the magnetic field induced by the current in the bending part of the anode is considered in this calculation,although that mechanical part of structure is out of the computational domain and is not shown in the contour.Other parameters except for φ and deare the same as shown in table 1.It could be seen that the magnetic field flux density decreases from the upstream to the downstream in the discharge channel,ranging from 0.8 T to 0.1 T and below.

Figure 5.Magnetic profile in the discharge channel.(φ=10 deg,de=21 mm,t=5 μs).

Figure 6.Experimental discharge current and the magnetic fulx density Bz at different positions on the channel centerline.(φ=10 deg,de=21 mm).
Since the magnetic field is induced by the discharge current,Bzshould be in close relation to the discharge current.According to equation (5),the current,which could be theoretically depicted as a function

is a factor in the expression of Bz.In equation(15),parameters a,b and c are constants.As a consequence,the magnetic flux density curves are similar to the curve of a damped oscillation function.However,as shown in figure 6,the peaks of the magnetic flux density curves lag behind the current peak,and the lags are larger at the downstream than the ones at the upstream in the discharge channel,which coincides with the measured results in figure 4(a) [14].The time lags are significant,as shown in table 2.The time lag is due to the fact that there are time-related items,α1and α2,in equation (5).The movement of the plasma sheet is considered and the boundaries of the current in electrodes change at every moment.So at a fixed point in the discharge channel,the magnetic field changes with not only the value of the current in the electrodes but the position of the plasma sheet.The coincidence of the calculated and experimental results toward the time lag demonstrates that the plasma sheet literally moves in the discharge process.

Figure 7.Bz with and without the magnetic flux density induced by the current in the bending part of the anode on the channel centerline.(t=5 μs,φ=10 deg,de=21 mm).

Figure 8.Magnetic flux density in thrusters with different electrode gaps and flared angles (x=20 mm,in the midpoint between electrodes).

Table 2.The time lag between the negative peaks of Bz and I.
3.2.Magnetic field of different electrode structure
3.2.1.Anode structure.The structure of the anode has been discussed in [21]from the point of view that the initial inductance could be reduced by shortening the distance between electrode endings,as can be seen in figure 1(b).As a consequence of this improvement,there is an extra part of the anode that is called the bending part in this paper (part III shown in figure 3(a)).From the view of the magnetic field,this anode structure is yet to be studied.The magnetic field is simulated with and without considering the bending part.As shown in figure 7,the magnetic flux density is higher when the magnetic field induced by the bending structure is considered,compared to the one without the bending part,especially at the upstream of the discharge channel ranging from x=0 m to x=0.02 m.It could be seen from the successive image of C+in the APPT firing [12]that the ionization process happens near the surface area of the propellant,then plasma is accelerated from the surface.Sothe increase of magnetic field at the beginning of the discharge channel could enhance the acceleration of the charged particles near the propellant.
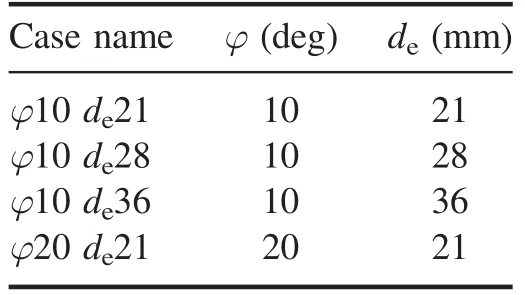
Table 3.The tested cases.
3.2.2.Geometrical study.Four geometrical cases shown in table 3 are tested and calculated to investigate the influence of deand the flared angle on the magnetic field.
As can be seen in figure 8,deexerts an evident influence on the magnetic field.For a thruster with a larger de,the greater exposure area of the propellant leads to a higher mass bit.However,the magnetic flux density on the centerline decreases with the increase of de.Consequently,the Lorentz force applied on the charged particles would diminish.
The flared angle has a slight influence on the magnetic field,which only decreases a little when the flared angle increases from 10 deg to 20 deg.The ablation areas of the propellant are identical for the cases φ10 de21 and φ20 de21,so the mass bit is not affected by the flared angle.A positive effect of the flared angle on the thruster could be deduced that the ion bombardment is alleviated due to the fact that less ions could reach the electrodes with larger flared angles.
Since the strong electromagnetic acceleration in the PPT,the electromagnetic impulse bit could represent the performance of the PPT,which is depicted as

The electromagnetic impulse bit in cases φ10 de21 and φ20 de21 are computed as shown in table 4.Although the magnetic field in the case φ20 de21 is slightly lower than the counterpart in case φ10 de21,the electromagnetic impulse bit of the former case is higher than the other one by 0.11 mNs due to the fact that a higher length h is achieved.In a word,the structure of flared electrodes would increase h and promote IEM.

Figure 9.The current curves of the PPT with φ=10 deg and de=21 mm.(a) Experimental current curve.(b) Simulated current curve.

Table 4.The electromagnetic impulse bit in the two cases with different flared angles (Ud=1300 V).

where U is the discharge voltage,R and L are the total resistance and the total inductance of the circuit and plasma,respectively.
The simulated current curve is in good accordance with the experimental curve as shown in figure 9.
Several cases of φ=10–40 deg are then simulated.The electromagnetic impulse bit is calculated according to equation (16).In figure 10,it could be seen that the flared angle has a positive effect on the electromagnetic impulse bit when the angle is in the range of 0 to 28 deg.The electromagnetic impulse bit reaches a maximum at φ=28 deg.However,for φ>28 deg,the impulse bit appears to decrease with the increase of the flared angle.Compared with the result of [17],in which the IEMincreases with φ and becomes maximum for φ beyond 25 deg,the
In the calculation results of the PPT with flared angles of 10 deg and 20 deg,the tendency of IEMincreases when the flared angle is observed.In order to further analyze the effect of the flared angle,more cases of various flared angles are simulated.Due to the numerous cases with different electrode geometries,instead of using the experimental current data,the current is calculated as follows result of a maximum of performance at φ=28 deg in this work could provide a clear suggestion for the structural optimization of the electrodes.The result shows that IEMcould not monotonically increase with the flared angle.

Figure 10.Change in electromagnetic impulse bit for PPTs with different flared angles (E0=68 J,de=21 mm).
Actually the electromagnetic impulse bit is a comprehensive result affected by the magnetic field,discharge current and h.The electrode flared angle has a negative effect on the magnetic field,while it has a positive effect on h,which could be seen in figure 11.The absolute value of the slope of Bz,peakcurve increases with the flared angle exactly.In addition,the flared angle has little effect on the current.So it could be deduced that for the electrode flared angle smaller than 28 deg,the positive effect of the flared angle on h prevails over the magnetic field.Whereas,the negative effect of the flared angle on the magnetic field dominates when the angle is larger than 28 deg.Considering the working process of the thruster and the application to the spacecraft,the large flared angle may cause discontinuity and the separation of the plasma sheet and lead to a redundant configuration of the thruster.So the structural design of electrodes could be optimized referring to the simulation result presented above.

Figure 11.Change in Bz,peak and h for PPTs with different flared angles(E0=68 J,de=21 mm,Bz,peak:the peak value of magnetic flux density at x=20 mm on the channel centerline).
4.Conclusions
The self-induced magnetic field in the PPT with flared electrodes is numerically investigated for the purpose of a better understanding of the working process and the structural design of the thruster.A two-dimensional model of the magnetic field in the discharge channel of the PPT is built and validated to be in accordance with the experimental results.The magnetic flux density in the discharge channel is presented and analyzed.The simulated magnetic field flux density decreases from the upstream to the downstream in the discharge channel,ranging from 0.8 T to 0.1 T and below.The peak of the simulated magnetic flux density lags behind the current peak,and the lags are larger at the downstream than the ones at the upstream in the discharge channel,which coincides with the experimental results in literature.By evaluating the expression of the magnetic field and the analytical discharge current,the existence of a moving plasma sheet in the discharge process could be deduced.The magnetic field induced by the current in the extra bending part of the anode is found to enhance the Lorentz force,which acts on the charged particles near the propellant.Finally,the geometric study indicates that the electromagnetic impulse bit could not monotonically increase with the flared angle,and that it reaches the maximum when the flared angle of the electrodes is 28 deg for the conditions in this work,which could provide significant suggestions for structural optimization.
Acknowledgments
This work is supported by National Natural Science Foundation of China (No.11602016).
ORCID iDs
猜你喜欢
杂志排行

Plasma Science and Technology的其它文章
- DBD coupled with MnOx/γ-Al2O3 catalysts for the degradation of chlorobenzene
- Investigation on pulsed discharge mode in SF6-C2H6 mixtures
- Temporal evolution of atmospheric cascade glow discharge with pulsed discharge and radio frequency discharge
- How bead shapes affect the plasma streamer characteristics in packed-bed dielectric barrier discharges:a kinetic modeling study
- Comparative analysis of the arc characteristics inside the convergingdiverging and cylindrical plasma torches
- 1,2,4-trichlorobenzene decomposition using non-thermal plasma technology