A generative adversarial network–based unified model integrating bias correction and downscaling for global SST
2024-03-04ShijinYuanXinFengBinMuBoQinXinWangYuxuanChen
Shijin Yuan,Xin Feng ,Bin Mu ,Bo Qin,Xin Wang,Yuxuan Chen
School of Software Engineering, Tongji University, Shanghai, China
Keywords:
ABSTRACT This paper proposes a global sea surface temperature (SST) bias correction and downscaling unifying model based on the generative adversarial network.The generator of the model uses a bias correction module to correct the numerical model forecasting results.Then it uses a reusable shared downscaling module to improve the resolution of the corrected data gradually.The discriminator of the model evaluates the quality of the bias correction and downscaling results as a criterion for adversarial training.And a physics-informed dynamics penalty term is included in the adversarial loss function to improve the performance of the model.Based on the 1°-resolution SST forecasting results of the GFDL SPEAR (Seamless System for Prediction and Earth System Research) model, the authors select the Remote Sensing System observations as the refined targets and carry out validation experiments for three typical events at different scales and regions (ENSO, Indian Ocean dipole, and oceanic heatwave events).The model reduces the forecasting error by about 90.3% while increasing the resolution to 0.0625°×0.0625°,breaking the limitation of the resolution of the observation data, and the structural similarity with the observation results is as high as 96.46%.
1.Introduction
As a critical component of the multi-sphere interactions on Earth,variations in global sea surface temperature (SST) are the engine driving significant climate changes and have considerable impacts on socioeconomic and human sustainability ( Garcia-Soto et al., 2021 ).Accurate global SST forecasting is important to reduce meteorological disasters and further improve our understanding of ocean dynamics mechanisms, and thus has become one of the meteorological topics of most concern ( O’Carroll et al., 2019 ; Haghbin et al., 2021 ).In recent years, numerous operational forecasting institutions ( Johnson et al.,2019 ; Zhou et al., 2022 ) and earth observation programs around the world have been working on SST forecasting ( Johnson et al.,2022 ; Du et al., 2021 ), such as the International Research Institute (IRI;https://iri.columbia.edu/our-expertise/climate/forecasts/enso/current )and the National Climate Center ( http://cmdp.ncc-cma.net/Monitoring/cn_nino_index.php ).
However, from a statistical perspective, SST forecasts from the numerical models involved can be highly scattered and often exhibit non-negligible deviations from real-world observations, especially for extreme events ( Wengel et al., 2021 ; Krasnopolsky et al., 2002 ); their low resolutions cannot meet the increasing requirements of refined operations.Therefore, more and more meteorological researchers are using deep learning to bias-correct and downscale the results of numerical models ( Choi et al., 2022 ; Sonnewald et al., 2021 ).Bias correction can significantly improve the simulation results of the numerical model,which is very helpful for analyzing the patterns and mechanisms of climate phenomena.Downscaling can greatly improve the fineness of the numerical model results and enable a more continuous and smooth portrayal of the evolution of climate events.For large-scale events, such as ENSO, finer data can better capture the pattern of the event, especially for small-scale anomalies in localized areas, which can be simulated more accurately.In mesoscale and sub-mesoscale events, the highly refined output data can help portray the evolution of events in more detail.They can better show the initial position and development direction of events.By improving the ability to characterize these details,downscaled models can help researchers to investigate the mechanisms of various climate events in depth, and better explore the detailed features of ocean dynamics processes.Thus, the scientific value of the simulation results of the numerical model is greatly improved, and the process of related meteorological research is accelerated.In general,using AI models to bias-correct and downscale the results of numerical models represents a coupled physics–dynamics-driven approach, which not only can take advantage of the clear physical meaning of the numerical model, but can also obtain a level of precision that cannot be obtained by observation.Such studies have achieved good progress.For example, Kim et al.(2021) and Han et al.(2021) used deep learning models such as LSTM (long short-term memory) and CU-net (correction U-net) to correct the forecast results of ECMWF, CESM, and Navy-ESPC(Earth System Prediction Capability) for climate phenomena such as the MJO and ENSO.Mu et al.(2020) and Liu et al.(2020) used deep learning methods such as CNN (convolutional neural network) and Bayesian convolutions to downscale SST and sea surface salinity, enabling the numerical models to better characterize the patterns of these variables.However, there are still common problems in the construction of deep learning models, such as oversimplified model structures and a lack of physical consistency ( Lloyd et al., 2022 ; Izumi et al., 2022 ).More importantly, existing models usually treat bias correction and downscaling as two separate tasks, making the logic of the refined process significantly flawed.
To tackle the above challenges, we construct a Generative Adversarial Network (GAN)-based universal deep learning model that can be used for any numerical model to perform integrated bias correction and downscaling procedures ( Goodfellow et al., 2020 ) (see Section 2.1).This model can take full advantage of the GAN, whose performance does not depend on excessive manual modulations but relies on the trainable discriminator’s inference to a large extent.Specifically, for the model configuration, we construct the generator with an encoder–inferer–decoder skeleton.The inferer uses the Residual-in-Residual Dense Block (RRDB)modules ( Wang et al., 2018 ) and the pixel shuffle layers ( Shi et al.,2016 ) as the core ingredients, which can modulate low- and highfrequency features simultaneously during SST evolutions and output multiple traceable intermediate results (e.g., corrected/downscaled results at medium resolutions).Meanwhile, the inferer contains the shared downscaling module, which can double the shape of SST data without limiting the size of the input data.So, SST data can be magnified to a finer level than labels.The discriminator constructed by the convolutional network is used to evaluate the accuracy and reliability of model results (See Section 2.2).As for the model training, we propose a physicsinformed ( Kashinath et al., 2021 ; de Wolffet al., 2021 ; Wolffet al.,2021 ) dynamics penalty term, which integrates a variety of SST key mode indices.It cooperates with the traditional adversarial loss for alternately tuning to maintain a high physical consistency (see Section 2.3).
Furthermore, to fully validate the model performance, we carry out a representative case study on the well-known GFDL SPEAR (Seamless System for Prediction and Earth System Research) model (see Section 2.4), which publishes monthly El Niño forecasts via CPC (Climate Prediction Center)/IRI.We correct and downscale its 1°-resolution forecast results, and use the high-quality 0.25°-resolution observations from Remote Sensing Systems as refined targets.In addition, we interpolate the observations to 0.5° × 0.5° and 1° × 1° resolutions to provide procedural supervision for the intermediate results of our model, improving refined physical details.Both datasets are from January 1998 to September 2022.Structure similarity (SSIM) ( Wang et al., 2004 ) is used as an evaluation index for the model performance.
2.Methods
2.1.Problem formalisation
The bias correctionc( ⋅) and downscalingd( ⋅) procedures of the dynamic numerical model are always considered as two independent tasks,as shown on the left-hand side of Eq.(1) :
where nmoutputrepresents the original numerical model outputs.These two operators can make the corrected result̂rcorrectionmatch the observations as much as possible and make the downscaled result̂rdownscalingmeet the resolution requirements of the operational forecasting, respectively.
After rethinking the internal logic between these two tasks, we find that their integration is more in line with the demands of operational forecasting.That is, the correction results of the numerical model are obtained first and then downscaled to higher-resolution dynamic details,as shown on the right-hand side of Eq.(1) , to align the final output̂rrefinewith high-resolution observations.Meanwhile, to ensure the high traceability of the whole process, we output all intermediate results,including the low-resolution bias correction results and the intermediate downscaling results.This is not only to satisfy the different resolution requirements in operational forecasting but also to set multiple effective optimizations to maximize the accuracy of results.
2.2.A unified model integrating bias correction and downscaling
In this study, we use GAN as the skeleton structure of our model( Fig.1 (a)), which has the superior capability of distinguishing the quality of generated data autonomously and producing dynamics-consistent results with more physical details ( Xiong et al., 2018 ; Yu et al., 2022 ).
The discriminator with the aim of binary classification adopts an improved CNN structure by the famous VGGNet (Visual Geometry Group Network; Simonyan and Zisserman, 2015 ), which is mainly composed of four discriminator blocks and a separate convolutional layer (as shown in Fig.1 (b)).Each discriminator block contains two convolution layers followed by two Leaky ReLU activation layers ( Maas et al., 2013 ).
The generator includes three CNN-based modules: encoder, inferer,and decoder ( Fig.1 (c)).The encoder and decoder consist of traditional convolution and deconvolution layers.To meet the requirements of the refined process, we propose a physics-informed inferer between encoder and decoder, which contains three connected sub-modules, outputting“bias correction ”, “2 ×downscaling ”, and “4 ×downscaling ”results (that is, module-level intermediate results), respectively.In detail, the structure of the inferer consists of two parts: the correction module and the downscaling module.The correction module consists ofSRRDBs( Wang et al., 2018 ) for correcting the GFDL SPEAR data.The RRDB(as shown in Fig.1 (d)) is used as the base block because it combines the residual connection ( He et al., 2016 ) and the dense connections( Huang et al., 2017 ) to better capture the multi-frequency features during the evolution of ENSO.The downscaling module is a reusable structure.We design it by combining a convolutional block,TRRDBs, and a pixel shuffle upsampling block ( Shi et al., 2016 ).This shared block can double the resolution of SST data and is not limited by size and resolution.By reusing this shared block, we can break the limitation of the resolution of real observation data (4 times the resolution of GFDL SPEAR data; 0.25°×0.25°) and increase the resolution of prediction data to 16 times to obtain the final output with the resolution of 0.0625°×0.0625°
2.3.Physics-informed loss function for adversarial training
Like the original GAN model, our model also uses the adversarial loss function to facilitate the “game ”between the generator and the discriminator, as in Eq.(2) :
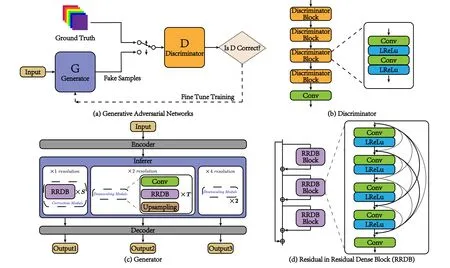
Fig.1.Our model structure: (a) The model’s overall structure is GAN, and the correct capability is enhanced by adversarial training of generators and discriminators.(b) The discriminator uses a VGG-like structure with four blocks containing two convolutional layers activated by Leaky ReLU.(c) The generator has three parts to provide correct results at different resolutions, and the main units of each part are the correction module and a shared downscaling module, which can double the resolution of any size SST data.(d) RRDB adds a dense connection structure inside the residual blocks in ResNet.
whererand̂rrefinerepresent observations and refined results, respectively (containing the corresponding intermediate results); LGand LDare the loss function for the generator and discriminator, respectively;D( ⋅) represents the binary judgment of the discriminator on the input source data; and (E )( ⋅) is the mathematical expectation.According to Eq.(2) , it is explicated that the generator aims to produce observationconsistent data (to minimize the mean square error (MSE) loss function)and deceive the discriminator while the discriminator strives to distinguish the authenticity of the input.
Furthermore, to make the results more consistent with the laws of physics, we design a physics-informed dynamics penalty term, which can maintain the consistency of multiple SST key mode indices between results and real observations, as shown in Eq.(3) :
wherêInandInare the specific ocean mode indexes of refined results and observations, respectively, andNdenotes the number of selected ocean mode indices.MAE is the mean absolute error.That is, the MAE of the refined results and observations is used as part of the loss function to constrain the model.We can further enhance the overall accuracy by reducing the errors of these modes.
The detailed computation areas and abbreviations of each selected ocean mode indexes are shown in Table 1.For the Pacific Ocean, Niño3,Niño4, ONI, and Niño1 + 2 all reflect the variations in SST in different regions of the equatorial Pacific, and PWAA represents the variations inthe coverage area of the warm pool in the equatorial Pacific.These indicators can reflect the occurrence and evolution of ENSO events in the Pacific Ocean, which have a significant influence on the global climate( López-Parages and Terray, 2022 ; Hrudya et al., 2021 ).For the Atlantic Ocean, the TSA, NTA and AMM indices represent the SST variations in the northern parts, southern parts of the tropical Atlantic Ocean, and the ocean areas near the meridian, which directly reflect the climate phenomena such as South Atlantic tropical cyclones, tropical North Atlantic events, and the Atlantic Meridian Overturning Circulation.These phenomena are related to the North Atlantic Oscillation, ENSO, North Atlantic Warm Current, and other climate phenomena, directly or indirectly through the Walker/Hadley circulation, Pacific–North America teleconnection, and other climate processes ( Zhang et al., 2021b ;Kucharski et al., 2015 ).For the Indian Ocean, we focus on the Indian Ocean Dipole (IOD) phenomenon and add the DMI and IOBW indices into the dynamic penalty term.The IOD has an important impact on SST and precipitation in the Indian Ocean, and is also connected with other oceans through processes such as the Walker circulation and Indonesian Throughflow ( Zhang and Han, 2021 ; Zhang et al., 2021a ).
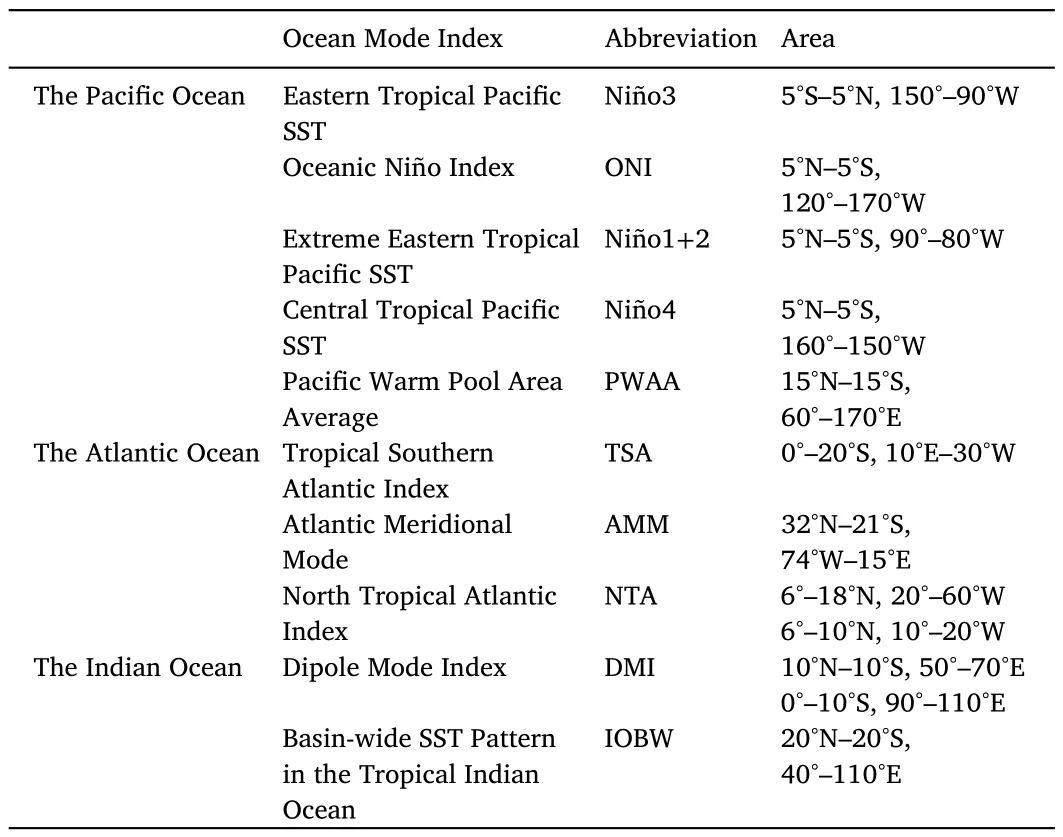
Table 1 The multiple ocean mode indices for the calculation of the dynamics penalty, including their abbreviations and coverage areas.
These selected indices reflect well the SST evolution of some important ocean events.Also, they connect climate phenomena and processes in the three tropical oceans through atmospheric circulation, ocean currents, and multiple teleconnections.A targeted reduction of errors in these indices could enable the model to simulate these ocean events better, thus making the model output more consistent with the overall regulation of the Earth’s ocean system and improving the physical consistency of the results.
2.4.Case study: application of GFDL SPEAR
In this case study, we separately collect the numerical model prediction results and the corresponding observations to construct the dataset to validate our model performance.The numerical model data are derived from the monthly global SST average forecast results of the 30 ensemble members of GFDL SPEAR( https://www.gfdl.noaa.gov/spear_large_ensembles/ ) with a resolution of 1° × 1°, and the high-resolution observations are obtained from the daily global SST remote sensing observations provided by Remote Sensing Systems ( https://www.remss.com/missions/amsr/ ) with a resolution of 0.25°×0.25°.In the training process, we average them monthly and use bicubic interpolation to generate corresponding observations at resolutions of 1°×1°and 0.5°×0.5°to provide procedural supervision for the intermediate output of our model.Meanwhile, in the practical utilization process, we increase the resolution of the numerical output up to 16 times by reusing the shareable downscaling module to obtain 0.0625° × 0.0625°, Both the numerical model data (GFDL SPEAR data)and observations span from January 1998 to September 2022, and we divide the training set (January 1998 to December 2013) and the testing set (January 2014 to September 2022) according to the ratio of approximately 7:3.To remove the influence of North Pole and South Pole sea ice on the data and to circumvent the acquisition performance (e.g.,scanning blindness) limitations of the observing equipment, we remove the middle/high latitudes from both sources of SST data, i.e., the latitudinal coverage of the data grid points is chosen as 25°S–35°N to cover the global tropical oceans.
In addition to MSE, we also use SSIM as a model evaluation metric to ensure the physical consistency of the processing results.This is a commonly used quality metric for grid data, which represents a combined measure of luminance, contrast, and structure between two grid data,as shown in Eq.(4) :
whereμ̂r(μr) is the mean of̂r(r),σ̂r(σr) is the corresponding standard deviation, andσ̂rrrepresents the covariance of the two data (ris the true observation).We seta,b, andcto 1 to fairly measure each component of SSIM, andc1,c2, andc3are tiny constants that prevent the denominator from being zero.

Table 2 The ablation study for our proposed dynamics penalty ( ↓means smaller is better; ↑ means bigger is better; the unit for MSE is °C2 ; SSIM is a percentage).
3.Experimental results and analyses
3.1.Ablation study for the physics-informed dynamics penalty term
We have determined the optimal model structure under our computing resource (see the supplemental material for more detailed parameter setting).Subsequently, to verify the effectiveness of the dynamics penalty term customized for global SST, we conduct an ablation study for this loss function, i.e., comparing the optimal performance of the model with/without the dynamics penalty term, and the results are shown in Table 2.The experiment results show that incorporating the dynamics penalty term can effectively improve the accuracy by about 10% (MSE), and can improve the high-resolution downscaled spatial similarity by about three points, indicating that it can further maintain a high physical consistency during the whole process.
3.2.Refined skill for SST
We evaluate the well-trained model with respect to two extreme events during the validation period in our case study, containing the 2014/15 super El Niño event and the 2019/20 super Indian dipole event,and then quantitatively verify its refined skill, as shown in Figs.2 and 3.The comparison shows that the output of our model is consistent with the observed data.In contrast, the high-resolution data can capture the pattern of ENSO and IOD events more accurately than the low-resolution data.This is especially evident for the appearance and westward propagation of local warm anomalies at the beginning of El Niño events.Moreover, Fig.4 shows line plots of the Niño3.4 index and IOD index calculated from the output of the GFDL SPEAR model, the observation data, and the output of our model.From the line plots, the differences between the original outputs of the numerical model and the real observations are so large that it can barely predict the two events accurately,while the results after processing by our model can accurately reflect the evolutions of these two extreme events.Besides, for the whole validation period, the MAE of the numerical models is 1.56 °C per grid, and the MAE of our model (4 ×downscaling) is 0.15 °C per grid, i.e., it effectively reduces about 90.4% of the global SST forecast errors of the GFDL SPEAR ensemble results, which improves its forecasting results.Meanwhile, the SST patterns by 16 ×downscaling from our model can exhibit the dynamic details of climate evolutions more accurately, which fully reflects the excellent performance in operational prediction.
As mentioned above, we analyze the ability of the model to capture the features of ENSO and IOD events only in the 0.25° results.Because both events are large-scale ocean events, it is not necessary to analyze them in higher-resolution results.As for the refined results at the 0.625° resolution, we analyze them in sub-mesoscale heatwave events.As shown in Fig.5 , we select two heatwave events in May 2010 and August 2014 and compare the refined results of 0.0625° (top row)with those of 0.25°(bottom row).It can be seen that the high-resolution results portray the details of the heatwave patterns more clearly, are smoother at the land–sea interface, and have fewer singular values in the prediction results that do not conform to physical laws.Moreover,the high-resolution prediction results can better show the initial position and development direction of the heatwave events.The evolution of the heatwave events can be portrayed more continuously and smoothly.
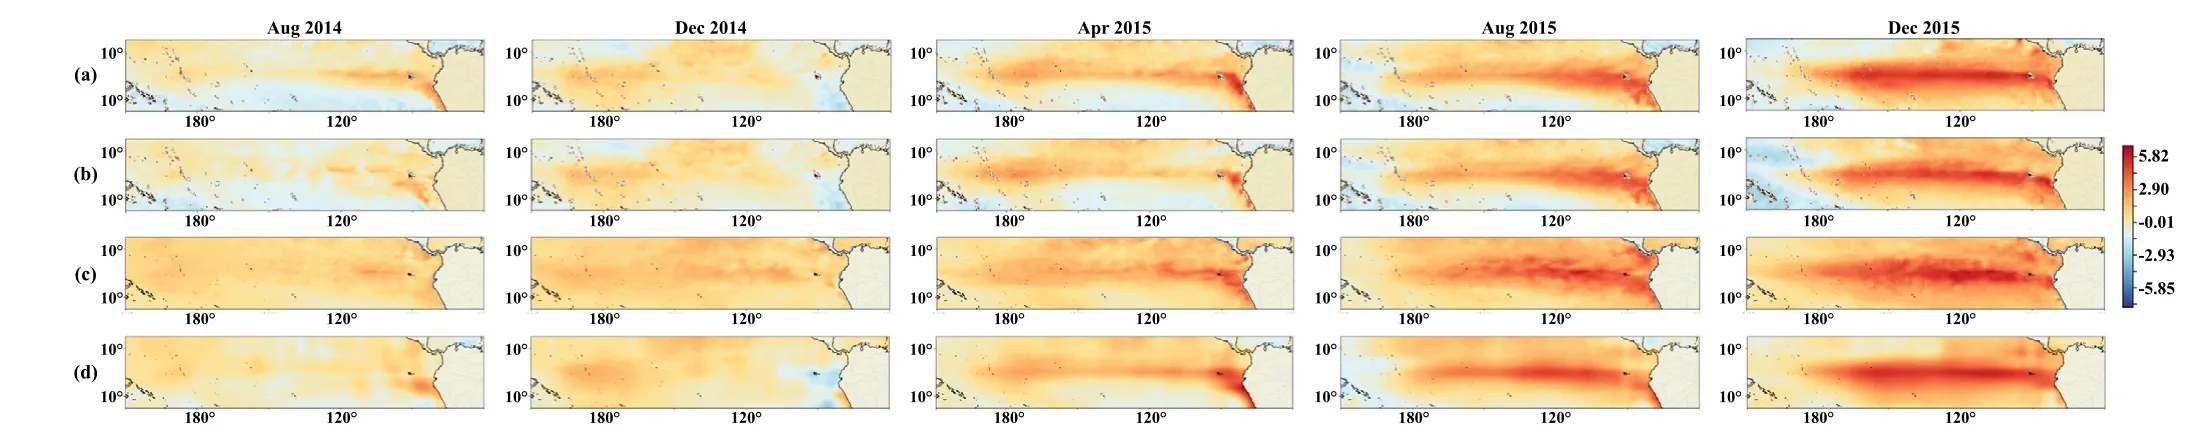
Fig.2.The SST patterns of the 2014/15 El Niño event (Apr 2014, Aug 2014, Dec 2014, Apr 2015, and Aug 2015): (a) the observation data of 0.25° in the Remote Sensing System dataset; (b) the 0.25° output of our model; (c) the observation data of 1° in the EN4 (Hadley centre subsurface temperature and salinity objective analyses, https://www.metoffice.gov.uk/hadobs/en4/ ) dataset; and (d) the observation data of 0.5° in the CODC-GOSD (CAS Ocean Data Center –Quality Control system, http://www.ocean.iap.ac.cn/pages/dataService/ ) dataset.
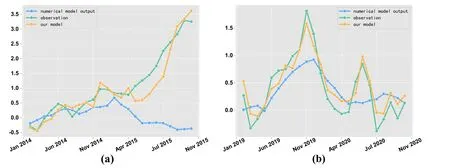
Fig.4.Line plots of the evolution of (a) Niño3.4 index and (b) DMI for the numerical model output (blue), observations (green), and our model (yellow) (units: °C;note that the observations are calculated by our dataset, and small differences with official records may exist).
In addition, we visualize the correlation coefficient distribution of the model.Fig.6 shows that low correlation coefficients are mainly concentrated near the equator, with the most significant low correlation coefficients in the equatorial West Pacific.This may be due to the more significant influence of solar radiation and Walker Circulation near the equatorial equator, so the climate activity is more intense.Also, atmospheric teleconnection exists between the equatorial West Pacific and several regions, such as the IOD and the North Pacific Meridional Mode, so the SST variation in this region is more active.In addition, the increased frequency of Central Pacific–type El Niño events in recent years has also intensified the SST variability in the equatorial West Pacific.
Additionally, to demonstrate the superiority of our proposed model,we also compare the model with other advanced deep learning models as shown in Table 3 , including (1) a normal CNN (6-layer convolutional network), (2) SRCNN ( Dong et al., 2016 ), (3) SRGAN ( Ledig et al.,2017 ), and (4) RCAN ( Zhang et al., 2018 ).Note that all models use the same training set and loss function, and are all tuned to their optimum (these models cannot be generalized to finer resolution, so we compare the 2 × and 4 × downscaling results).We can see that our proposed model performs significantly better than the other models, especially at 4 ×downscaling (0.25° × 0.25°), indicating that our model can be used as a reliable tool for refining the global ocean.
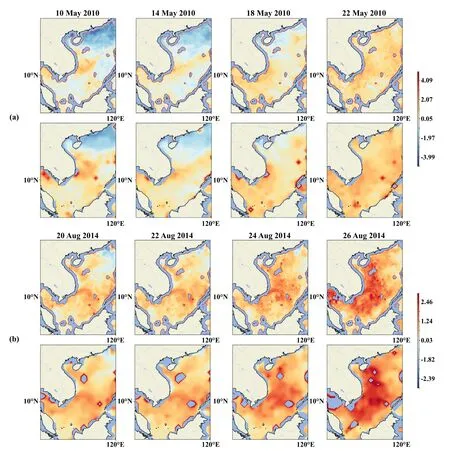
Fig.5.The SST patterns of the (a) May 2010 and (b) August 2014 heatwave event.

Fig.6.Model correlation coefficient distribution heat map: (a) global correlation coefficient distribution; (b) correlation coefficient distribution in the Indian Ocean;(c) correlation coefficient distribution in the Atlantic Ocean; (d) correlation coefficient distribution in the Pacific Ocean.
4.Conclusion
SST change is a key source for global climate variabilities, which means that more accurate SST predictions are always pursued.In this paper, we construct a universal deep learning model that unifies bias correction and downscaling procedures for refining the global SST of any numerical model via GAN, which can provide more accurate results at integer-multiple resolution.Specifically, its generator is a well-designed encoder–inferer–decoder skeleton, RRDB modules and pixel shuffle layers, which incorporate dense connections in the residual connections and can extract multi-scale features with different frequencies, thus better capturing the evolution of SST.Meanwhile, the shared structure in the inferer can be reused to double the shape of climate data in any size without limiting the size of the input data, so we downscale the numerical output up to 16 times to the resolution of 0.0625°×0.0625°Its discriminator is a convolutional model to distinguish the accuracy and reliability of results.Additionally, we propose a physics-informed dynamics penalty term integrating multiple SST key modal indices to guide the adversarial training, which can maintain physical consistency to a large extent.We carry out a representative case study on GFDL SPEAR ensemble forecasts to fully validate our model performance.The main points of this paper are as follows:
• This is the first universal deep learning model that unifies bias correction and downscaling procedures for global SST analyses from any numerical model simulation, which can provide more accurate results at integer-multiple resolution.
• This model originates from GAN.The structure of its generator and discriminator is more suitable for producing detailed results, focusing on the concurrent coupling of low and high frequencies.The case study (1°→0.0625°) shows the results are very similar to the highresolution observations.The SSIM of 4 ×downscaling reaches up to 96.46%, which is about two points higher than other advanced models.
• A dynamics penalty term, which incorporates multiple SST key mode indices, is proposed for adversarial training.The case study shows that it can enhance the accuracy remarkably, by about 10%.Overall, our model reduces the MSE of the GFDL SPEAR model forecast results from 4.43 to 0.43, reducing the forecast error by 90.3%.
Based on the refined data obtained through our model, we select three events (ENSO, IOD, and heatwave), for analysis and comparison.The results show that the highly refined data provide a more accurate and detailed view of the pattern and evolutionary processes of climate events.This is important for researchers to enhance their understanding of ocean processes and to study the mechanisms of climate events.
Our model can be used for post-processing operational numerical models to carry out refined forecasting of various weather and climate phenomena.At present, the calculation resources required for the model to perform higher multiple downscaling are still relatively large.In the future, we will carry out more lightweight and physics-informed work in pursuit of more accurate predictions.
Funding
This study was supported by the National Key Research and Development Program of China [grant number 2020YFA0608000 ], the National Natural Science Foundation of China [grant number 42075141 ], the Meteorological Joint Funds of the National Natural Science Foundation of China [grant number U2142211 ], the Key Project Fund of the Shanghai 2020 “Science and Technology Innovation Action Plan ”for Social Development [grant number 20dz1200702], and the first batch of Model Interdisciplinary Joint Research Projects of Tongji University in 2021[grant number YB-21-202110].
Supplementary materials
Supplementary material associated with this article can be found, in the online version, at doi:10.1016/j.aosl.2023.100407.
杂志排行

Atmospheric and Oceanic Science Letters的其它文章
- Slowing down of the summer Southern Hemisphere Annular Mode trend against the background of ozone recovery
- Comparison between ozonesonde measurements and satellite retrievals over Beijing, China
- Decadal prediction skill for Eurasian surface air temperature in CMIP6 models
- Ascending phase of solar cycle 25 tilts the current El Niño–Southern oscillation transition
- The Tibetan Plateau bridge: Influence of remote teleconnections from extratropical and tropical forcings on climate anomalies
- Anthropogenic influence on the extreme drought in eastern China in 2022 and its future risk