Ascending phase of solar cycle 25 tilts the current El Niño–Southern oscillation transition
2024-03-04WenjuHuoZiniuXioLingZhoFeiLiu
Wenju n Huo , , , Ziniu Xio , Ling Zho , Fei Liu c
a GEOMAR Helmholtz Centre for Ocean Research, Kiel, Germany
b State Key Laboratory of Numerical Modeling for Atmospheric Sciences and Geophysical Fluid Dynamics, Institute of Atmospheric Physics, Chinese Academy of Sciences,Beijing, China
c School of Atmospheric Sciences, Sun Yat-Sen University, Key Laboratory of Tropical Atmosphere–Ocean System, Ministry of Education, and Southern Marine Science and Engineering Guangdong Laboratory, Zhuhai, China
Keywords:
ABSTRACT A La Niña condition in the equatorial Pacific began in the early summer of 2020 and has lasted more than two and a half years (referred to as the 2020 La Niña hereafter).Predicting its temporal evolution had attracted a lot of attention.Considering the possible phase-locked impact of the 11-year solar cycle on the tropical Pacific variability, in this study the authors present the possible modulations by the solar cycle 25 (SC25) started from December 2019, on the future temporal evolution of the 2020 La Niña.Based on statistical features of historical solar cycles, the authors propose three possible scenarios of the timing of the SC25 maximum year and discuss its possible impacts on the temporal evolution of the 2020 La Niña in the next two years.The ongoing ascending phase of SC25 dampens the development of a super El Niño condition to some extent in 2023.
1.Introduction
El Niño–Southern Oscillation (ENSO), one of the most important climate phenomena in the tropical Pacific, has broad teleconnections and hence a global impact ( Taschetto et al., 2020 ).The oscillation of its two opposite extreme phases, i.e., El Niño (warm event) and La Niña (cold event), is referred to as the ENSO cycle, which has an irregular period of 3–7 years ( Wang et al., 2016 ).This natural interannual tropical Pacific variability can be internally generated by atmosphere–ocean coupling( Jin, 1997a,b ; Suarez and Schopf, 1988 ) or produced by external forcings, such as increasing greenhouse gases ( Cai et al., 2021 ), volcanic eruptions ( Khodri et al., 2017 ; Liu et al., 2022 ), and the 11-year solar cycle ( van Loon et al., 2007 ; Meehl et al., 2009 ; Huo and Xiao, 2017a ).
In our previous work, we found significant 11-year solar cycle footprints in the central equatorial Pacific, which then maintain and extend into the eastern Pacific via air–sea interactions and oceanic dynamical heat transport processes ( Huo et al., 2021 ).The responses to the 11-year solar cycle are confined to the upper ocean layers above the main thermocline ( Wang et al., 2019 ; Huo et al., 2021 ), which can modulate the variability of tropical Pacific ocean heat content (OHC) ( Huo and Xiao, 2017b ; Huo et al., 2023 ), Pacific Walker circulation ( Xiao et al.,2016 ; Misios et al., 2019 ), and the Central Pacific El Niño ( Huo and Xiao, 2017b ; Lin et al., 2021 ).A phase-locked decadal covariation between tropical Pacific OHC anomalies and the 11-year solar cycle has been found in previous studies ( Huo and Xiao, 2017b ; Wang et al.,2015 ; Wang et al., 2020 ; Huo et al., 2023 ).In the solar cycle’s ascending (declining) phase, La Niña-like (El Niño-like) OHC anomalies show up ( Huo et al., 2023 ).Therefore, the 11-year solar cycle has been noted in several studies as a potential source of decadal prediction skill( Zanchettin, 2017 ; Misios et al., 2019 ; Huo et al., 2023 ).
Due to the worldwide influence of ENSO phenomena, its skillful prediction holds considerable public interest and has appreciable impacts on the predictability of global climate anomalies ( Luo et al., 2016 ).However, predicting ENSO events effectively is a challenge because of their diversity, asymmetry, irregularity, and interactions with physical processes on other temporal and spatial scales (e.g.the Pacific Decadal Variability ( Deser et al., 2012 ; Power et al., 2021 )).Considering the phase-locked impact of the 11-year solar cycle on the tropical Pacific,the phases of the solar cycle could also modulate ENSO’s temporal behavior, especially its phase transition.Therefore, in this work, we carry out a case study of the impact of the current solar cycle, i.e., solar cycle 25 (SC25), on the ongoing La Niña event that began in September 2020(referred to as the 2020 La Niña hereafter).The 2020 La Niña is the first“triple-dip ”La Niña of the 21st century ( Jones, 2022 ) and has been gradually weakening in 2023 ( https://www.cpc.ncep.noaa.gov ; accessed 6 April 2023).Meanwhile, SC25 started in December 2019 and is currently still in its ascending phase ( https://www.sidc.be/silso/home , accessed 6 April 2023).The phase transition of SC25 could influence the current ENSO evolution to some extent.In this context, the present case study,along with a detailed discussion, may provide some hints for predicting the remaining evolution of the current ENSO state, as well as related seasonal predictions.
2.Data and methods
The observed monthly sunspot number (SSN) from 1850 to the present is used as an index of solar activity, which can be obtained from the World Data Center’s Sunspot Index and Long-term Solar Observations (WDC-SILSO) dataset via their website ( https://www.sidc.be/silso/datafiles ).The monthly sea surface temperature (SST) from NOAA’s ERSST.v5 dataset (1854–present;Huang et al.(2017) ) and monthly OHC from the Institute of Atmosphere Physics ocean analysis dataset (1940–present; Cheng et al.(2017) )are used to estimate changes in the ocean thermal state according to the phases of the solar cycle.Note that, because the 11-year solar cycle signals are observed in the upper ocean layers(above 300 m) ( Wang et al., 2019; Huo et al., 2021), the OHC integral from the surface to a depth of 300 m is used here.Besides, the surface zonal winds from the NCEP–NCAR Reanalysis-1 project (1948–present) are also used in this study, as provided by NOAA PSL, Boulder, Colorado, USA, available via their website at https://psl.noaa.gov/data/gridded/data.ncep.reanalysis.html.
Following the method used in WDC-SILSO, the dates of the minimum and maximum of each solar cycle are determined by the 13-month smoothed monthly SSN (cyan line in Fig.S1(a)).We take the year of the minimum (maximum) as the beginning of the ascending (declining)phase for each solar cycle.The ascending (declining) phase ends one year before the maximum (the following minimum).As the solar cycle has a predominant period of 11 years on average, we define the phases of the 11-year solar cycle based on the mean values (blue line in Fig.S1(b)) of all the historical solar cycles since 1850, to estimate averaged climate responses to the solar cycles in the past.Therefore, on average,the ascending phase includes 4 years (i.e., indicated by A(0)–A(3)) and the declining phase includes 7 years (i.e., indicated by D(0)–D(6)).Here,the phase evolution of the averaged 11-year solar cycle just presents the gradual change in the solar irradiance strength, not the real temporal evolution.It is important to note that the length of solar cycles can vary between 9 and 13 years.The years included in the phases of individual solar cycles could be different from the averaged 11-year solar cycle.Therefore, for the case study of SC25, its ascending phase starts from the minimum year of SC25 (2020-DJF (December, January, February))and continues in the following years until the present.The phase evolution of SC25 can be identical to the real temporal evolution.
In this study, we performed a composite analysis based on the 11-year solar cycle and estimated the 90% statistical confidence level of composites via a 1000-fold bootstrapping test with replacement( Diaconis and Efron, 1983 ).Niño3.4 is used as the ENSO index in this study, which was calculated based on the SST anomalies (from ERSST here) averaged in the Niño3.4 region (5°N–5°S, 170°–120°W).Note that,different from the ENSO events defined by the Climate Prediction Center (CPC), NOAA (i.e., a threshold of ± 0.5°C), here we take the positive(negative) seasonal mean Niño3.4 as an El Niño (La Niña) event to facilitate discussion.A similar result can be achieved based on the CPC Niño3.4 index (not shown).Considering the observational reliability of the climate data, we use the data from 1950 onwards for composite analysis.The seasonal means (i.e., DJF-mean, MAM (March, April,May)-mean, JJA (June, July, August)-mean, and SON (September, October, November)-mean) are calculated from the monthly data, and the anomaly is defined as the departure from the deseasonalized mean value of the period 1950–2014.In this study, we took the winter season (DJFmean) as the first season of the year.
3.Results
Fig.1 (a) shows the annual mean SST anomalies and the anomalous SST zonal gradient during the 11-year solar cycle in the past(1950–2019).Consistent with previous studies ( Huo and Xiao, 2017a ;Huo et al., 2023 ), significant SST anomalies appear in the central equatorial Pacific, resembling a La Niña event in the ascending phase (A(0)–A(3) in Fig.1 ) and an El Niño event in the declining phase (D(0)-D(6) in Fig.1 ).It is worth noting that the negative (positive) SST anomalies in the far eastern Pacific (east of 120°W) during the ascending (declining)phase can be interrupted by the SST annual variability (e.g., the positive SST anomalies in A(1) and negative SST anomalies in D(2) in Fig.1 ).The negative SST anomalies in the central equatorial Pacific reduce (increase) the westward SST zonal gradient in the eastern (western) Pacific(contours in Fig.1 (a)), leading to anomalous westerly (easterly) winds over the eastern (western and central) Pacific (contours in Fig.1 (b)).The positive SST zonal gradient anomalies as well as the easterly wind anomalies extend into the central and eastern Pacific around the solar maximum (A(3)–D(0) in Fig.1 (a, b)).Similar to the surface anomalies,La Niña-like OHC anomalies appear in the upper ocean layers above 300 m (color shaded contours in Fig.1(b)) in the solar cycle ascending phase, showing maximum positive (negative) anomalies around 150°E(150°W).Along with the positive OHC anomalies extending into the central equatorial Pacific around the solar maximum (D(0)–D(1) in Fig.1 ),the thermal zonal gradient in the western and central Pacific is reduced.As a result, anomalous westerly winds appear over the western and central Pacific and provide positive feedback to the El Niño-like SST and OHC anomalies during the solar cycle declining phase (D(1)–D(5) in Fig.1 ).
We performed the same analysis on the current SC25 (since December 2019), as shown in Fig.2.The 2020 La Niña SST anomalies (color shaded contours in Fig.2 (a) first appear in 2020-JJA (summer of A(0))and sustain until the present (A(1)–A(3)).The westward SST zonal gradient anomalies increase in the western and central equatorial Pacific(contours in Fig.2 (a)), accompanied by anomalous easterly winds prevailing across almost the entire equatorial region (contours in Fig.2 (b)).As a result, the warm water volume builds up in the western Pacific by the strengthened trade winds and leads to positive OHC anomalies in the western equatorial Pacific (color shaded contours in Fig.2 (b)).These anomalies of the ocean thermal state and surface zonal wind in SC25 are consistent with the averaged anomalies during past solar cycles.Therefore, here, we anticipate the possible evolution of the 2020 La Niña event based on the evolution of SC25.
The Niño3.4 index, as one of the most popular ENSO indexes, can capture ENSO’s temporal evolution in the simplest way.We calculated the seasonal mean Niño3.4 index during the 11-year solar cycle in history and during SC25, as shown in Fig.3.A La Niña (El Niño) event exists in most of the years during the solar cycle ascending (declining)phase.Except for the end year of the ascending phase (A(3)), the La Niña event is very weak in most of the summer (JJA) and close to a neutral state in autumn (SON).The La Niña event achieves its maximum in the winter of the solar maximum (DJF of D(0)) and decays in the subsequent seasons.An El Niño event appears in the second year of the ascending phase and maintains in the following years ( Fig.3 (a)).
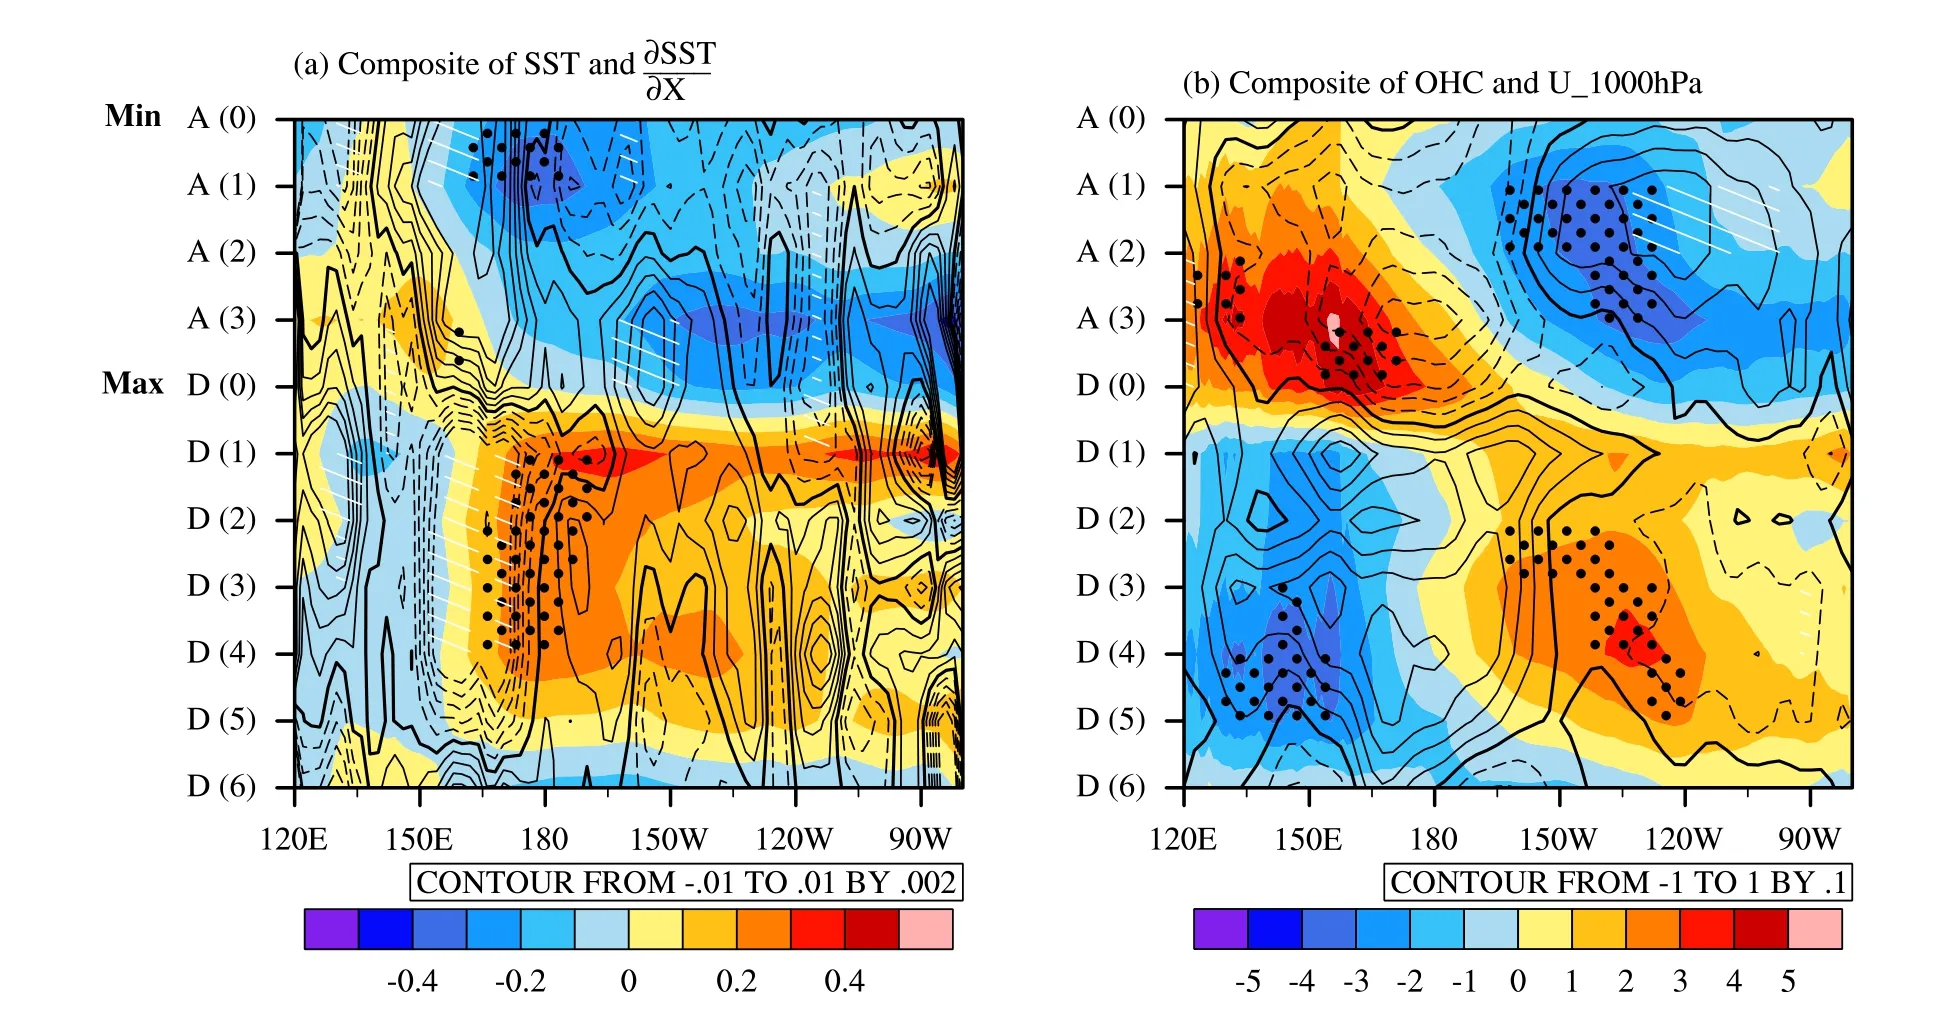
Fig.1.Ocean thermal state and surface zonal wind anomalies during the 11-year solar cycle in history (1950–2019): (a) composite annual mean SST anomalies(color shaded contours; units: °C) and SST zonal gradient anomalies (contours; units: °C/100 km; westward is positive) averaged within 10°S–10°N; (b) composite annual mean OHC (color shaded contours; units: 108 J m- 2 ) and surface zonal wind anomalies (contours; units: m s- 1 ) averaged within 10°S–10°N.The black-dotted regions are above the 90% confidence level based on bootstrapping for (a) SST anomalies and (b) OHC anomalies.The regions with white hatching are above the 90% confidence level for the SST zonal gradient.
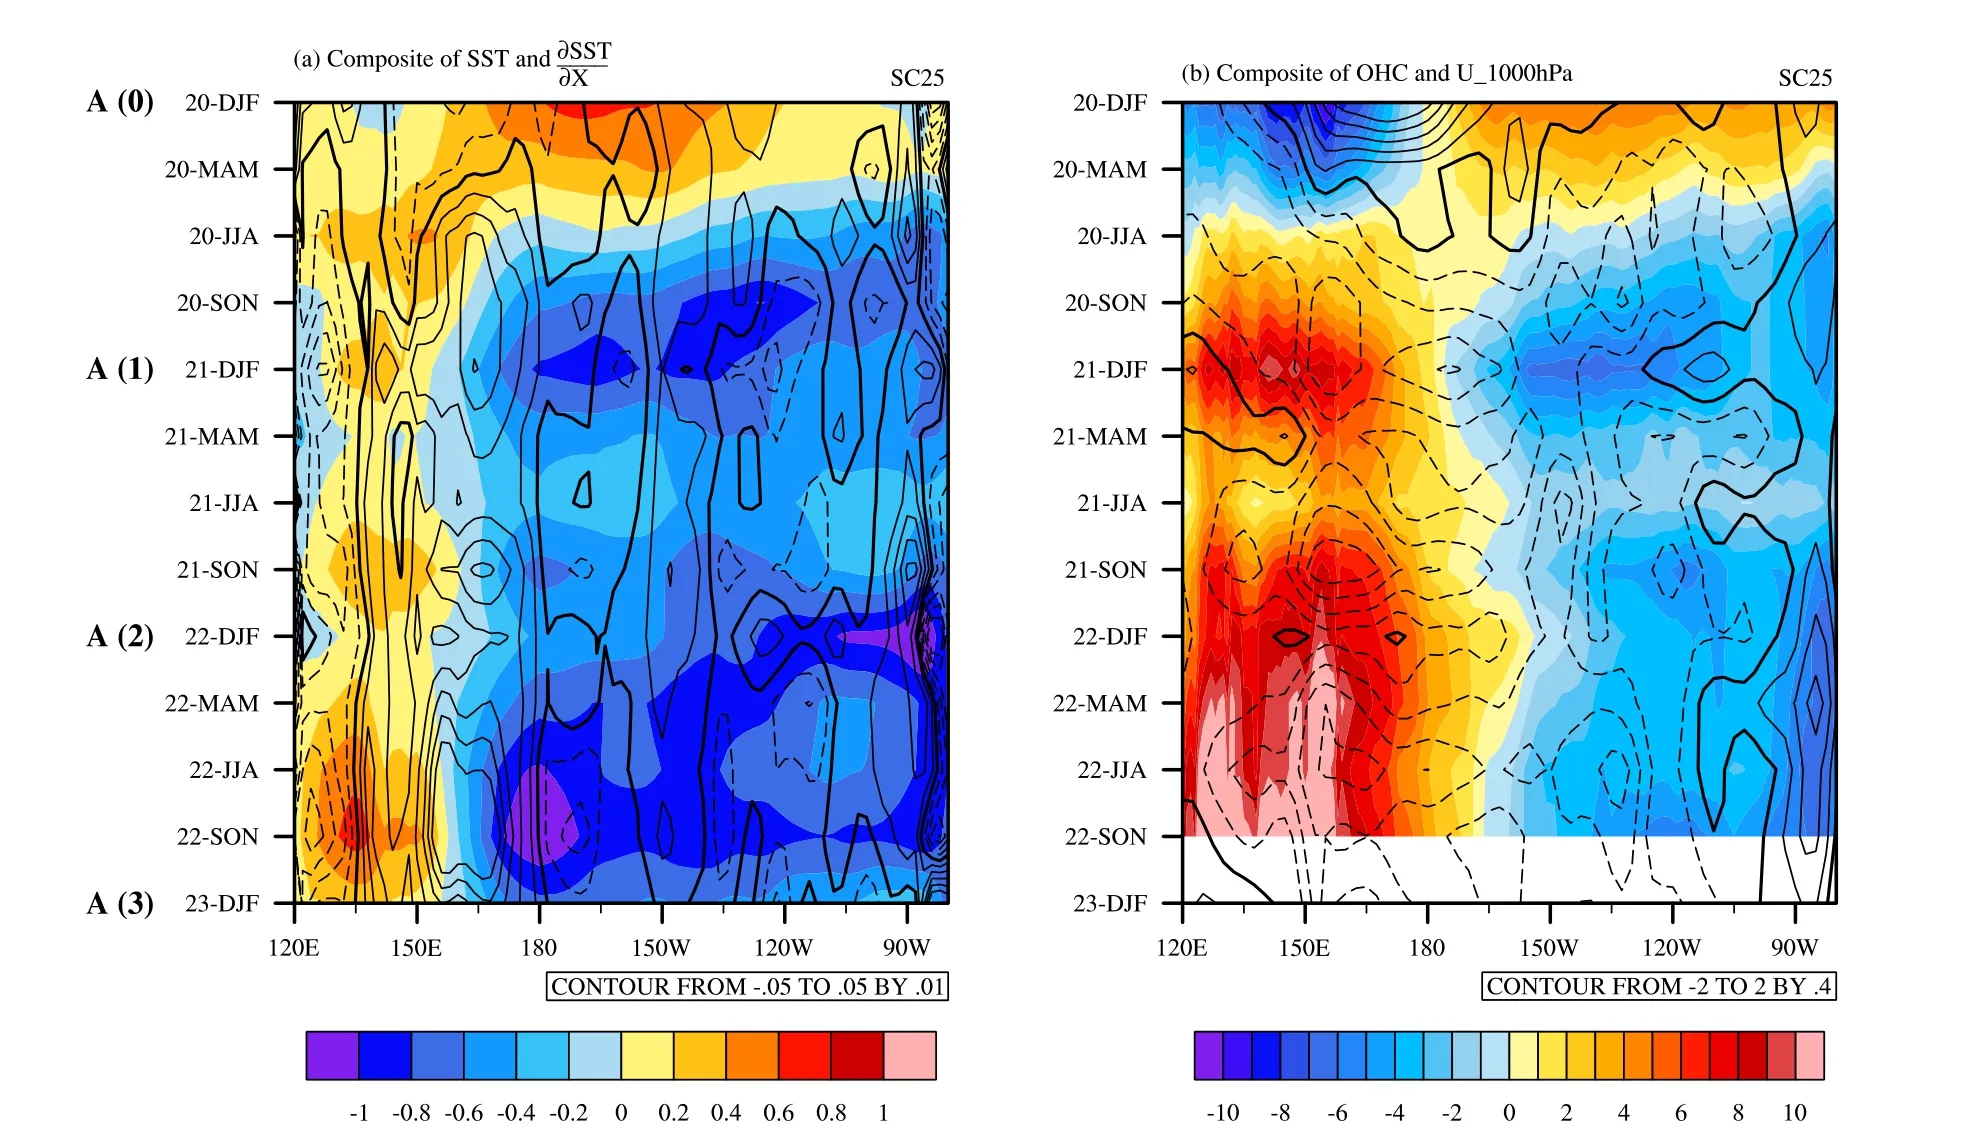
Fig.2.(a) Composite of seasonal mean SST anomalies (color shaded contours; units: °C) and SST zonal gradient anomalies (contours; units: °C/100 km; westward is positive) averaged within 10°S–10°N during the ongoing solar cycle 25 (from 2020-DJF).(b) As in (a) but for the OHC and zonal wind anomalies.
According to ENSO’s evolution during the “average ”11-year solar cycle ( Fig.3 (a)), the current 2020 La Niña event will continue in 2023 and decay in 2024 ( Fig.3 (b)).However, the duration of the ascending phase of SC25 could be shorter (or longer) than the average value.As summarized in Table S1, the duration of the ascending phase is between 38 to 64 months and approximately 50 months on average.Based on current predictions of SC25 and the statistics of historical solar cycles,we put forward three possible scenarios of the SC25 ascending phase to discuss its possible modulation of the current ENSO evolution, i.e.,the shortest, longest, and averaged duration.A detailed discussion is presented in the next section.
4.Discussion
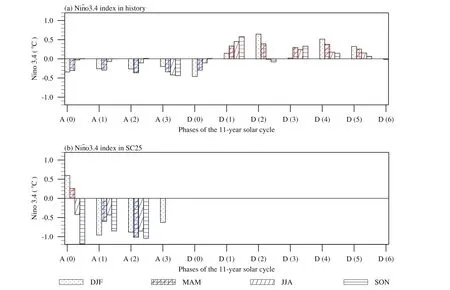
Fig.3.Seasonal mean Niño3.4 index during the 11-year solar cycle in (a) historical records (1950–2019) and (b) the ongoing solar cycle 25 (from 2020-DJF).
In this study, we investigated the possible impacts of SC25 on the temporal evolution of the 2020 La Niña event based on a statistical analysis of the historical connections between the 11-year solar cycle and anomalies in the equatorial Pacific.On average, a La Niña condition exists in the solar cycle’s ascending phase and changes into an El Niño condition after the solar cycle phase transition into a declining phase.Although this phase-locked covariation happens on the decadal time scale, it can tilt the ENSO phase transition to some extent.For example, the negative SST anomalies in the central equatorial Pacific in the solar cycle ascending phase can dampen the appearance and development of an El Niño condition during this period.It is worth noting that the maximum SST response to the solar cycle forcing (about 0.5°C) is smaller than half of the internal variability, and thus we cannot expect a dominant role of the solar cycle forcing in ENSO’s evolution.However, it may have a significant impact on ENSO’s phase transition when the internal variability (or anomalies) is (are)relatively small.We carried out a case study on the 2020 La Niña event based on the same statistical method and summarize the influence of SC25 on the evolution of the 2020 La Niña under three possible scenarios.
The current ascending phase of SC25 is expected to achieve its maximum between September 2023 and January 2025 ( Dani and Sulistiani, 2019 ; Zhu et al., 2023 ).Based on solar cycles in the past, what is now the Space Environment Prediction Center, Center for Space Science and Applied Research, Chinese Academy of Sciences ( http://www.sepc.ac.cn/SCF\_chn.php ; accessed 7 April 2023),and WDC-SILSO ( https://www.sidc.be/silso/forecasts ; accessed 7 April 2023) both predicted the maximum SSN will be achieved around February of 2024.The current forecasts of the SC25 ascending phase indicate its variation is among the historical values.Therefore, we propose the following three scenarios of the SC25 ascending phase to discuss its possible impacts on the near-future ENSO state:
(1) With a similar duration as the historical shortest ascending phase (i.e., SC22), SC25 would reach its maximum around the summer of 2023.Under this scenario, the westward SST zonal gradient and the trade winds would continue to relax in the summer of 2023.As a result, the 2020 La Niña condition would decay into a neutral state in the autumn of 2023 and El Niño could show up in the winter of 2024.
(2) With a similar duration as the averaged value, SC25 would reach its maximum in the spring of 2024.Under this scenario, the current prevailing trade winds would last for the rest of 2023 but with a reduced speed.The OHC in the western Pacific would reach its maximum and slowly migrate into the central equatorial Pacific in the second half of 2023.As a result, the SST in the central Pacific would increase, and an El Niño condition (or Central Pacific El Niño condition) could be expected in the summer of 2024.
(3) With a similar duration as the longest ascending phase (i.e.,SC24), SC25 would reach its maximum in the spring of 2025.The persistence of the SC25 ascending phase in 2023 and 2024 would dampen the chance of an El Niño event occurring, or reduce its strength to some extent, in these two years.
In terms of predicting the 2020 La Niña event, the World Meteorological Organization’s Global Producing Centres of Long-Range Forecasts predicts that there is a 90% chance for a transition to ENSO-neutral during March–May 2023, with just a small chance of about 10% that La Niña will continue further.A following El Niño developing gradually during JJA carries a chance of around 55% ( https://public.wmo.int/en/our-mandate/climate/el-niñola-niñaupdate ; accessed 6 April 2023).We should point out here that the solar effect is small but not negligible compared to the large interannual variability in the tropical Pacific.Based on a spectral analysis of the detrended historical Niño3.4 index (figure not shown), the variance of the Niño3.4 SST anomaly at the decadal time scale (periodicity of 12 years)is approximately half of its maximum interannual variance, which includes both the response to external forcing and the internal variability.In addition, with the prediction of the SC25 maximum having at least a one-year uncertainty, roughly, it is impossible to predict the 2020 La Niña event accurately based on SC25.Nevertheless, our study shows that the ongoing ascending phase of SC25 may inhibit the emergence of a super El Niño this year, and the solar cycle could be a potential source for ENSO prediction skill.
Funding
This work is supported by the National Natural Science Foundation of China [42075040 and 42274217 ].
Acknowledgments
Here we are grateful to all the anonymous reviewers and all the reanalysis datasets providers.
Supplementary materials
Supplementary material associated with this article can be found, in the online version, at doi:10.1016/j.aosl.2023.100397.
杂志排行

Atmospheric and Oceanic Science Letters的其它文章
- Slowing down of the summer Southern Hemisphere Annular Mode trend against the background of ozone recovery
- Comparison between ozonesonde measurements and satellite retrievals over Beijing, China
- Decadal prediction skill for Eurasian surface air temperature in CMIP6 models
- The Tibetan Plateau bridge: Influence of remote teleconnections from extratropical and tropical forcings on climate anomalies
- Anthropogenic influence on the extreme drought in eastern China in 2022 and its future risk
- Effect of different cold air intensities and their lagged effects on outpatient visits for respiratory illnesses in Handan in different seasons