Anthropogenic influence on the extreme drought in eastern China in 2022 and its future risk
2024-03-04YinjunZhangLinChenYuqingLiZiAnGe
Yinjun Zhang,Lin Chen ,Yuqing Li,Zi-An Ge
Key Laboratory of Meteorological Disaster, Ministry of Education (KLME)/Joint International Research Laboratory of Climate and Environmental Change
(ILCEC)/Collaborative Innovation Center on Forecast and Evaluation of Meteorological Disasters (CIC-FEMD), Nanjing University of Information Science and Technology, Nanjing, China
Keywords:
ABSTRACT
1.Introduction
Eastern China is an economically developed and densely populated area in China, which is also particularly susceptible to unprecedented climate extremes.For example, the region experienced an extreme drought in July–August 2022, which, according to the Chinese government, affected 38.3 million people in 21 provinces, including Sichuan and Chongqing.It caused the destruction of more than 4.1 million hectares of crops and a direct economic loss of over 32.8 billion yuan( https://www.sohu.com/a/588296523_121374282 ).In addition to the severe drought, long-lasting heat waves swept over the region throughout the whole summer ( Sun et al.2023 ; He et al.2023 ; Wang et al.2023 ;Chen et al.2023 ; Jiang et al.2023 ).Due to its severe social and economic impacts, numerous efforts have been devoted to understanding the physical cause of this drought extreme.
It has been documented in numerous studies that anthropogenic forcing can provide favorable conditions for the occurrence of extreme climatic events in China, especially drought extremes.Zhang et al.(2020)proposed that anthropogenic influences increased the likelihood of the observed 2018 spring drought over south China by 17 times.Chen and Sun (2017) revealed that anthropogenic influence is the main cause of the rising trend in hot droughts across China.Notably, during autumn 2019, an extreme drought event hit the eastern China region, which has since received wide attention in the scientific literature.For instance,Ma et al.(2020) concluded that anthropogenic warming was conducive to the extreme drought events like the 2019 drought (2019Drought-like events), inducing a twofold increase in the likelihood of concurrently dry and hot events analogous to the 2019 event.Li et al.(2022) also analyzed the anthropogenic effects on the 2019 drought extreme and found an eightfold increase in the occurrence probability of 2019Droughtlike events.In short, anthropogenic forcing indeed plays a key role in drought extremes.Therefore, it is essential to detect the unique influence of anthropogenic forcing on the extreme drought event in summer 2022 in eastern China.
During the past few decades, the severity and persistence of drought extremes have enhanced ( Zhang et al., 2013 ; Spinoni et al., 2014 ),and this change is expected to continue under human-induced global warming ( Chen and Sun, 2017 ).Feng and Fu (2013) pointed out that global drylands continuously expanded in the last 60 years, and this trend will continue throughout the 21st century.Global drylands are projected to be 10% larger than in the climatological period of 1961–1990.Pascale et al.(2016) investigated the change in dry spells over Mediterranean-type regions under global warming based on the RCP8.5 warming scenario in CMIP5 models.They found that the number of dry days may increase to one month per year by the end of the 21st century.Drought extremes over eastern China may also change significantly in the future.Chen et al.(2023) provided a future projection of the 2019 drought extreme based on CMIP6 models, from which they found that the probability of such extreme drought will be 20% higher (40%–50%lower) under the SSP5-8.5 (SSP1-2.5–SSP2-4.5) emission scenario compared to the current climate, which implies a nonlinear response to a warming world.From this perspective, further investigations are needed into the prospective changes of such extremely persistent drought events in response to different warming scenarios.
The rest of this paper is organized as follows.Section 2 introduces the observational and model data, as well as the methods applied.Section 3 analyzes the anthropogenic impact on the occurrence probability of a 2022Drought-like event.Section 4 provides the projected changes in a 2022Drought-like event under various emission scenarios.
2.Data and methods
2.1.Data
2.1.1.Observationaldatasets
The observed daily precipitation dataset used in this study was composed of gauge observations from 824 national stations in China for the period 1951–2022.This dataset was interpolated onto a horizonal grid of 1°×1°using Cressman’s objective analysis method ( Cressman, 1959 ).
2.1.2.Modeldatasets
Outputs from 18 CMIP6 models ( Eyring et al., 2016 ) were utilized in the present study.Specifically, to detect the anthropogenic influences,we employed two specific simulations: (1) the historical simulation,which involves both natural forcing and anthropogenic forcing; and (2)the hist-nat simulation, which only involves natural forcing.The difference between these two simulations (historical minus hist-nat) was regarded as the human activity–induced change.For these two simulations, the period of 1950–2014 was analyzed.Further, to estimate the future projections, the SSP1-2.6, SSP2-4.5, and SSP5-8.5 emission scenarios were used, based on the period 2015–2100.All model outputs were regridded to 1° × 1°for further analysis.For more detailed information about the available variables of the CMIP6 models, please refer to Table S1.
2.2.Methods
The minimum accumulated precipitation of the N-day window (hereafter RxNday) was selected as the magnitude of a persistent drought extreme (e.g., Chen et al., 2023 ; Ge et al., 2022 ).The generalized extreme value (GEV) distribution and the risk ratio were also applied.For more details, please refer to Text S1.
3.Observational characteristics of the 2022 persistent drought extreme
As documented in various studies ( Sun et al., 2023 ; He et al., 2023 ;Wang et al., 2023 ; Jiang et al., 2023 ; Chen et al., 2023 ), the eastern China region was hit by an extreme drought in summer 2022, which caused severe economic and agricultural damage.To understand the persistence of this drought extreme, we show the daily precipitation anomalies averaged over the eastern China region (24°–33°N, 102°–122°E) from 1 June to 31 August 2022 ( Fig.1(a) ).It can be clearly seen that the dryness persisted in July and August (hereafter, JA) 2022,lasting for approximately 50 days.The JA mean precipitation anomaly over eastern China ( Fig.1(b) ) shows a rainfall deficit of 2.4 mm d-1in 2022, exhibiting a record-breaking dip.Fig.1(c) shows the horizontal pattern of JA mean precipitation anomalies.Clearly, rainfall deficits dominated the eastern China region (red box in Fig.1(c) ), with maximum reductions of precipitation reaching up to 3.6 mm d-1.To further quantify the extreme duration and intensity of this drought event,the minimum accumulated precipitation anomaly during a consecutive seven-week period during JA (Rx49day) was selected.The time series of the normalized Rx49day from 1951 to 2022 ( Fig.2(a) ) shows that the 2022 extreme drought was 57.5% dryer than the climatological mean state, which broke the record since 1951.The GEV distribution fitted to the time series of the observed Rx49day ( Fig.2(b) )shows that there is only a very slight chance for a persistent drought extreme resembling the JA 2022 eastern China event happening in the present day.Further, the corresponding return period ( Fig.2(c) ) indicates that the 2022Drought-like event is a 1-in-73-year event (once in 73 years).
In short, the extreme drought event over eastern China in JA 2022 exhibited a record-breaking rainfall deficit during the observational period of 1951–2022, with a significant feature of exceptionally long persistence.Based on Rx49day and the GEV distribution, this extreme event can be deemed as a 1-in-73-year event.
4.Anthropogenic impacts on 2022 Drought-like events
Under anthropogenically forced climate change, various extreme climate events occur more frequently and with high intensity, especially drought extremes ( Zhang et al., 2020 ; Chen and Sun, 2017 ).Therefore,understanding how anthropogenic forcing influences the likelihood of a 2022Drought-like event is necessary.To achieve this goal, numerical simulations were employed for further investigation.
Firstly, we computed the GEV distribution fitted to the simulated Rx49day by the multi-model ensemble (MME) of CMIP6 models involved in DAMIP (Detection and Attribution Model Intercomparison Project, Table S1).Next, to determine whether or not the MME is capable of reproducing the variability of the observed Rx49day, the Kolmogorov–Smirnoff(K-S) test was used.It was found that the simulated GEV distribution was indistinguishable from the observation(p= 0.18 > 0.05; Fig.3 (a, b)).This result indicates that the CMIP6 MME can simulate the observed Rx49day variability reasonably, demonstrating great robustness in anthropogenic forcing runs.Based on the DAMIP simulations, we investigated the anthropogenic impacts on a 2022Drought-like event.

Fig.1.Time series of the (a) daily precipitation anomaly (units: mm) from 1 June to 31 August 2022 and (b) July–August mean precipitation anomaly (units: mm d- 1 )from 1951 to 2022 averaged over eastern China.The solid and dashed lines in (a) denote the raw and 7-day running mean precipitation anomaly, respectively.(c)Spatial distribution of July–August mean precipitation anomalies (shading; units: mm d- 1 ) relative to the climatology.The red box in (c) denotes the eastern China region (24°–33°N, 102°–123°E).
The GEV distributions of Rx49day for the historical and hist-nat simulations are shown in Fig.3 (c, d).It can be seen that the GEV fitted to the historical runs (black curves) moves towards a dryer condition compared to that fitted to the hist-nat runs (blue curves), demonstrating more frequent occurrence of extreme drought events under the presentday climate, which involves human activities.This result shows that anthropogenic forcing makes a 2022Drought-like event more likely to happen.Based on the GEV distribution, we further computed the specific occurrence probability of a 2022Drought-like event under different simulations and the corresponding risk ratio.As shown in Fig.3(e) , its occurrence probability was 0.03% (0.01%–0.08%) under the natural-only forcing, which increased to 0.05% (0.02%–0.11%) when anthropogenic forcing was involved.Accordingly, the likelihood of a 2022Droughtevent increased by 56% under anthropogenic forcing, based on the risk ratio ( Fig.3(f) ).The intermodel spread was minor, which demonstrates robustness in the projection results.
The physical reasons responsible for anthropogenic forcing inducing a higher risk of a 2022Drought-like event are worth investigating.To this end, we show the change in JA mean precipitation, vertical motion at 500 hPa, and low-level mean winds induced by anthropogenic forcing (historical minus hist-nat; Fig.S1).The anthropogenic forcing–induced mean precipitation change showed a dryer condition over most of eastern China, accompanied by strengthened northerly winds.Moreover, strengthened descending motion dominated the region.Collectively, anthropogenic forcing–induced changes in mean state may stunt convective activity, providing a favorable condition for the formation of drought extremes.
5.Future projections of 2022 Drought-like events
Under anthropogenic forcing–induced warming in the future,extreme rainfall deficits are projected to occur more frequently over eastern China, which may bring devastating consequences( Huang et al., 2016 ; Chen and Sun, 2017 ).Therefore, it might be of particular interest to decision-makers as to how frequently a 2022Droughtlike event is likely to happen under continuous global warming.
In order to understand the changing likelihood of a 2022Drought-like event in response to global warming, we utilized the SSP1-2.6, SSP2-4.5,and SSP5-8.5 emission scenarios provided by the CMIP6 dataset.The GEV distributions fitted to the normalized Rx49day for the historical and three warming scenarios are shown in Fig.4 (a, b).As can be seen, there is a lower chance of a 2022Drought-like event happening under SSP1-2.6 (cyan curve) compared to that under the present-day climate (gray curve).Surprisingly, this kind of event is projected to happen more frequently under the SSP5-8.5 scenario (purple curve); and in terms of the medium-emissions scenario of SSP2-4.5, the change is relatively minor(blue curve).Specifically, as shown in Fig.4(c) , the occurrence probability of a 2022Drought-like event is 0.038% (0.021%–0.11%) in the present day (gray bar), which falls to 0.003% (0.001%–0.008%) under SSP1-2.6 (cyan bar) but returns to 0.037% (0.012%–0.076%) under SSP2-4.5 (blue bar).Surprisingly, it increases to 0.068% (0.023%–0.12%) under SSP5-8.5 (purple bar).The risk ratio is also chosen to highlight the probability change ( Fig.4(d) ).The risk ratio is 0.089 (0.002–0.18) for SSP1-2.6, indicating an exceptionally small likelihood for a 2022Drought-like event to occur under a low-emissions scenario; it is 0.96 (0.30–1.8) under the medium-emissions scenario, which is comparable to the present-day climate; and for high-emissions scenario (SSP5-8.5), the risk ratio increases to 1.7 (0.92–2.6).Notably, the intermodel spread is minor, demonstrating robustness in the future projections.Overall, this result indicates a nonlinear response of 2022Drought-like events to a warmer world.
Similar to the approach in Section 4 , we also studied the change in mean background states between the historical simulation and different emission scenarios.The change in mean state precipitation, vertical motion at 500 hPa, and low-level winds are shown in Fig.S2.For the warming scenario of SSP1-2.6, both the mean precipitation and upward motion are significantly enhanced (Fig.S2(a, d)), ranking first place among the three emission scenarios.Meanwhile, strengthened southerly winds are prevalent over the eastern China region.All these mean background state changes provide a favorable condition for convective activity, decreasing the occurrence probability of a 2022Drought-like event.For SSP2-4.5, the changes in mean background state are similar to those under SSP1-2.6, but with lower magnitude (Fig.S2(b, e)).The small alteration in the mean background state is also consistent with the minor change in the occurrence probability under the SSP2-4.5 scenario.Regarding SSP5-8.5, notably, the descending motion is significantly enhanced over the eastern China region (Fig.S2(f)), with a slight increase in mean precipitation (Fig.S2(c)).This indicates that the higher risk of a 2022Drought-like event under SSP5-8.5 may be associated with a change in vertical motion, which would be unfavorable for convective activity.
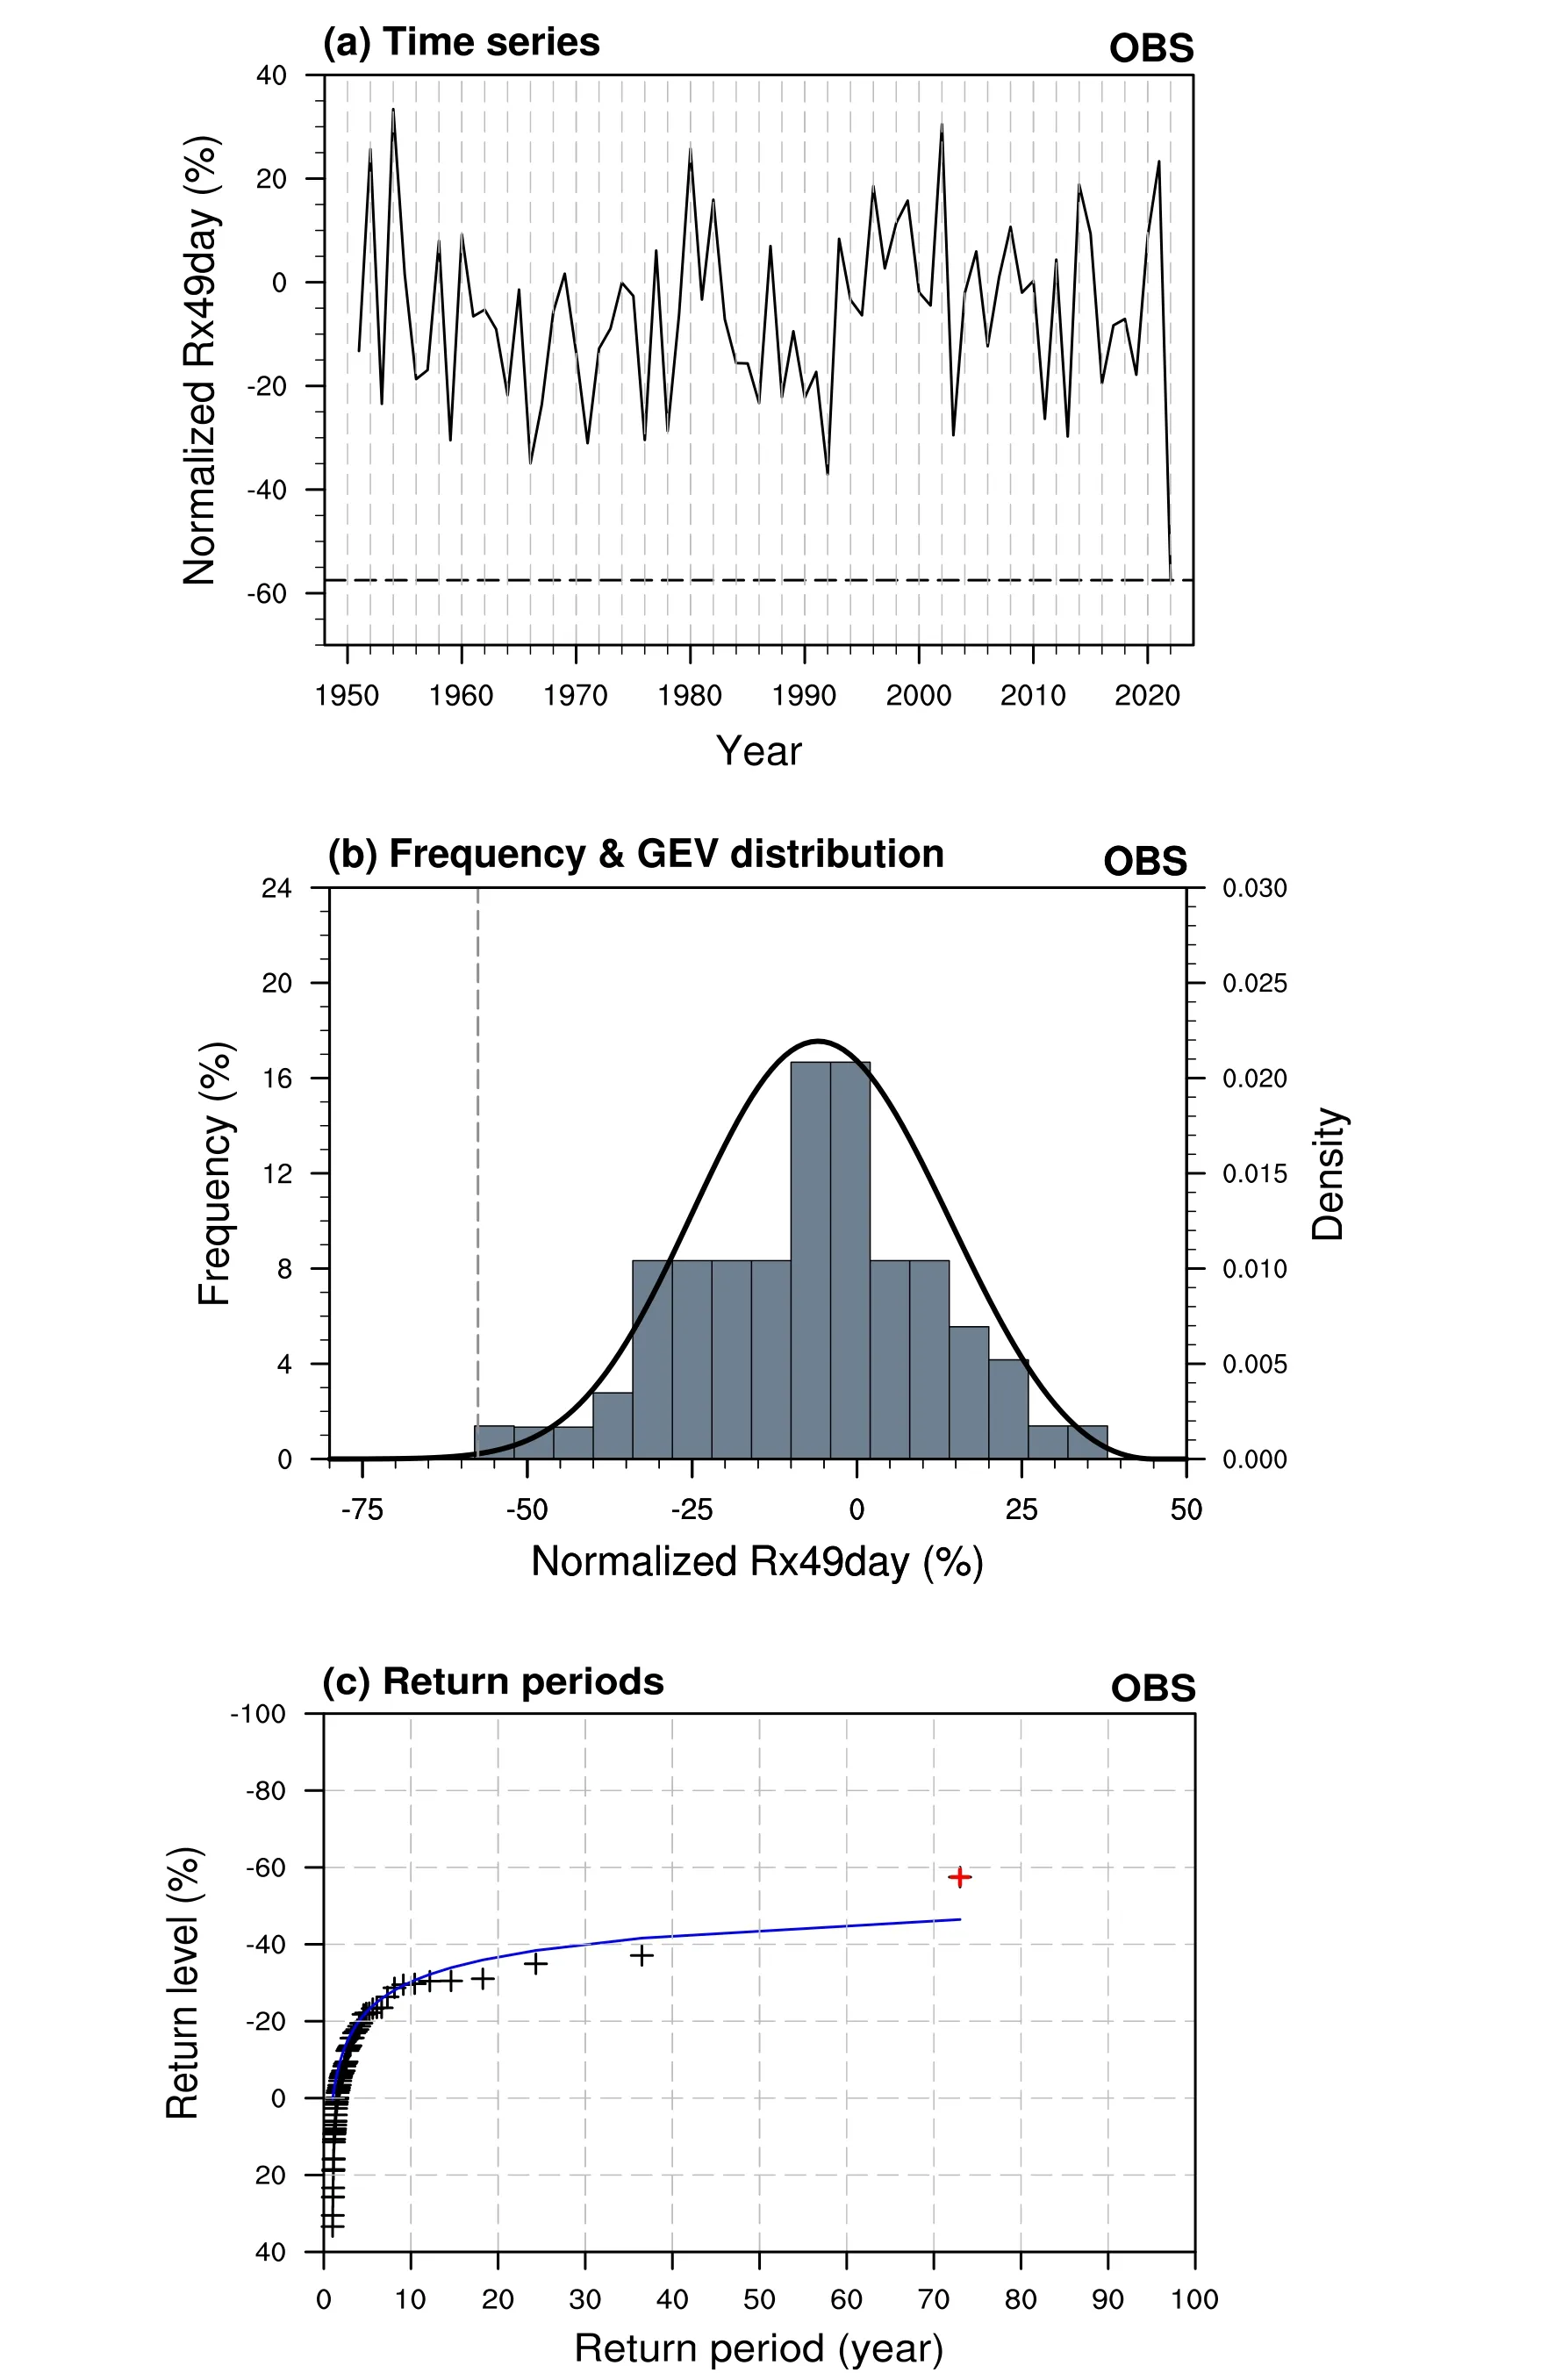
Fig.2.(a) Time series of the normalized Rx49day.The dashed line denotes the intensity of the Rx49day of the 2022 extreme drought.(b) Frequency of occurrence(bars) and GEV fitted distribution (curves) of the normalized Rx49day.(c) Return periods of the normalized Rx49day with 95% confidence intervals.The crosses in(c) are the observed Rx49day, and the red marker denotes the 2022 event.

Fig.3.(a, c) Distribution of occurrence frequency and (b, d) GEV fitted distribution of the normalized Rx49day.The black dashed lines in (a, b) denote the observation, and dark red solid lines denote the MME mean of 18 CMIP6 models.The black and blue solid lines in (c, d) denote the historical and hist-nat simulation,respectively; the curves are derived from the MME mean; and the vertical line denotes the guide of the observed Rx49day in 2022.(e) Occurrence probability and(f) risk ratio of a 2022Drought-like event for the historical (black) and hist-nat (blue) simulation.The box-and-whisker plots in (e, f) indicate the corresponding percentiles, with the yellow parts indicating the influence of anthropogenic forcing.
Overall, the MME of 18 CMIP6 models projects that the risk of a 2022Drought-like event will drop by 92% under a low-emissions scenario, due to enhanced background precipitation, southerly winds,and upward motion.The background mean state under a mediumemissions scenario is similar to that under the present-day climate,and thus the likelihood of a 2022Drought-like event is virtually unchanged.In sharp contrast, the occurrence probability of this kind of extreme event exhibits a pronounced increase (by 79%) under a high-emissions scenario, which is probably caused by the strengthened mean state descending motion.The results indicate a nonlinear change in 2022Drought-like events in response to a warmer world.

Fig.4.(a) Distribution of occurrence frequency and (b) GEV fitted distribution of the normalized Rx49day for historical (gray), SSP1-2.6 (cyan), SSP2-4.5 (blue),and SSP5-8.5 (purple) simulations.The curves are derived from the MME mean; and the vertical line denotes the guide of the observed Rx49day in 2022.The (c)occurrence probability and (d) risk ratio of a 2022Drought-like event for historical (gray), SSP1-2.6 (cyan), SSP2-4.5 (blue), and SSP5-8.5 (purple) simulations.The box-and-whisker plots in (c) and (d) indicate the corresponding percentiles.
6.Summary and conclusions
Eastern China suffered an extreme drought throughout July–August 2022, characterized particularly by its extraordinarily long persistence.Some studies have reported that anthropogenic forcing may contribute to a more frequent occurrence of climate extremes, and this trend is expected to continue under continued greenhouse gas emissions ( Chen and Sun 2017 ).From this perspective, we studied the contribution of anthropogenic forcing to 2022Drought-like events and estimated how frequently a 2022Drought-like event is likely to happen under global warming.
In summer 2022, a pronounced negative precipitation anomaly dominated the eastern China region and persisted throughout July–August 2022.A persistent drought index, defined as the minimum accumulated precipitation over seven consecutive weeks in JA (Rx49day), indicates that the 2022 extreme drought was 57.5% dryer than the climatological mean state.Further, the GEV distribution and return period that were fitted to the normalized Rx49day demonstrate that a persistent extreme drought event over eastern China like that in 2022 is expected to occur only once in every 73 years.
We utilized CMIP6 models (historical and hist-nat simulations) to investigate how human activities influence the risk of a 2022Droughtlike event.The MME mean GEV distribution was examined using a K-S test, and results showed that the CMIP6 MME can reproduce the characteristics of the observed Rx49day reasonably.Based on historical and hist-nat runs, we concluded that, due to anthropogenic forcing, the risk of a 2022Drought-like event rises by 56%.This increase is probably connected with the human activity–induced change in mean states, including the reduction in mean moisture as well as the strengthening of descending motion over eastern China.
To explore the changing likelihood of a 2022Drought-like event in response to global warming, we utilized three different warming scenarios released by CMIP6 –namely, SSP1-2.6, SSP2-4.5, and SSP5-8.5.The projected results demonstrate that, under a low-emissions scenario, the risk of a 2022Drought-like event declines by 92%, probably because of the increase in background moisture and enhanced upward motion.In sharp contrast, a high-emissions scenario gives a 79% higher chance of a 2022Drought-like event happening than under the present-day condition, probably because of the significantly enhanced background descending motion.In terms of a medium-emissions scenario, the change in the occurrence probability of this kind of event is basically negligible.These results demonstrate a nonlinear response of persistent drought extremes over eastern China resembling the 2022 event to continuous global warming.More in-depth investigations are needed for a more comprehensive understanding of the physical mechanism causing this nonlinear response.
Funding
This work was jointly was supported by the National Natural Science Foundation of China [grant number 42088101 ] and the National Natural Science Foundation of China [grant number 42005020 ].
Acknowledgment
We thank the reviewers for their insightful suggestions and comments.
Supplementary materials
Supplementary material associated with this article can be found, in the online version, at doi:10.1016/j.aosl.2023.100390.
杂志排行

Atmospheric and Oceanic Science Letters的其它文章
- Slowing down of the summer Southern Hemisphere Annular Mode trend against the background of ozone recovery
- Comparison between ozonesonde measurements and satellite retrievals over Beijing, China
- Decadal prediction skill for Eurasian surface air temperature in CMIP6 models
- Ascending phase of solar cycle 25 tilts the current El Niño–Southern oscillation transition
- The Tibetan Plateau bridge: Influence of remote teleconnections from extratropical and tropical forcings on climate anomalies
- Effect of different cold air intensities and their lagged effects on outpatient visits for respiratory illnesses in Handan in different seasons