Climate‑change habitat shifts for the vulnerable endemic oak species (Quercus arkansana Sarg.)
2024-01-26SureshChandraSubediSethDrakeBinayaAdhikariMarkCoggeshall
Suresh Chandra Subedi · Seth Drake ·Binaya Adhikari · Mark V. Coggeshall
Abstract Quercus arkansana (Arkansas oak) is at risk of becoming endangered,as the total known population size is represented by a few isolated populations.The potential impact of climate change on this species in the near future is high,yet knowledge of its predicted effects is limited.Our study utilized the biomod2 R package to develop habitat suitability ensemble models based on bioclimatic and topographic environmental variables and the known locations of current distribution of Q. arkansana.We predicted suitable habitats across three climate change scenarios(SSP1-2.6,SSP2-4.5,and SSP5-8.5) for 2050,2070,and 2090.Our findings reveal that the current suitable habitat for Q. arkansana is approximately 127,881 km2 across seven states (Texas,Arkansas,Alabama,Louisiana,Mississippi,Georgia,and Florida);approximately 9.5% is encompassed within state and federally managed protected areas.Our models predict that all current suitable habitats will disappear by 2050 due to climate change,resulting in a northward shift into new regions such as Tennessee and Kentucky.The large extent of suitable habitat outside protected areas suggests that a species-specific action plan incorporating protected areas and other areas may be crucial for its conservation.Moreover,protection of Q. arkansana habitat against climate change may require locally and regionally focused conservation policies,adaptive management strategies,and educational outreach among local people.
Keywords Biomod2 · Climate change · Conservation ·Habitat loss · Habitat shift · Species distribution modeling ·Oak species
Introduction
Oaks (QuercusL.) have significant ecological,economic,and aesthetic importance in North America (see Bocsi et al.2021).They play a critical role in maintaining the health and function of forest ecosystems by providing essential habitat and food for multiple species.However,many oak species are threatened with extinction in the wild (Gómez-Mendoza and Arriaga 2007;Beckman et al.2019) due to habitat loss,climate change,diseases,and other anthropogenic stresses.Among them,climate change is the major threat for most of the oak species of concern (Beckman et al.2019).Out of 28 species of conservation concern in the IUCN Red List,Arkansas Oak (Quercus arkansanaSarg.) is listed as a vulnerable species at high risk of extinction due to its population being subject to widespread declines (NatureServe 2022).Historically,Q.arkansanahad a wide distribution across the southeastern U.S.but is now restricted to isolated populations (Beckman et al.2019).As most of its remaining habitats with large populations are unlikely to contribute to the long-term sustainability of the species,Q.arkansanais at risk of becoming endangered.
One high impact threat to the species in the near future will be climate change.The red oak group (QuercussectionLabiatae),includingQ.arkansanarequires low temperatures (chilling effect) and high moisture for seed germination (Bonner 1987).In the southeastern United States,nighttime minimum temperatures have increased in past decades,resulting in higher average temperatures (Powell and Kiem 2015).In addition,increased variability in summer precipitation has been documented in the Southeastern United States (Wang et al.2010).Precipitation has decreased in dry summer months recently and increased in wet summer months creating periods of extreme drought (Wang et al.2010).Subsequently,dry seasons in the Southeastern United States have lengthened by 12 to 156 days (Fill et al.2019).It has been reported that,in some populations ofQ.arkansanain Alabama,extensive dieback has been attributed to localized drought patterns (Jerome et al.2017a).Moreover,Q.arkansanawas the top-ranked among the North American tree species vulnerable to climate change (Potter et al.2017).Therefore,assessment of current habitats and information on potential changes in the range of this endemic species is vital for their conservation.
Despite the potential risks posed by climate change forQ.arkansanapopulations (e.g.,drought),which will likely intensify in the future (McDowell et al.2020;Subedi et al.2015),no specific research exists on projecting how climate change will impact this species.With its limited and isolated populations,and habitat specificity,Q.arkansanacould face significant challenges to future recruitment and population stability within a changing climate (Beckman et al.2019).Moreover,current habitats that support wild populations may not be suitable in the future due to rapidly changing climate conditions (Hawkins et al.2008).In this regard,species distribution modeling (SDM) can be used in the identification of sites appropriate for conservation (Vincent et al.2019;Gaisberger et al.2020).Predicting existing and future suitable habitats in different projected scenarios using SDM can provide valuable insights into the potential impacts of climate change on species and groups of species (Coetzee et al.2009;Bladon et al.2021;Sierra-Morales et al.2021).According to the Conservation Gap Analysis of North American Oaks (Beckman et al.2019),research related to SDM under variable climate change scenarios should be prioritized for the conservation ofQ.arkansana.As the distribution of plant species is mostly linked to topographic factors and climatic fluctuations (e.g.,Williams et al.2009;Adhikari et al.2012;Sousa-Silva et al.2014;Syfert et al.2014),it is crucial to evaluate the influence of these variables onQ.arkansanadistribution and to identify the extent of range change under future climate scenarios.Utilizing SDM by incorporating the effects of topographic and global climatic variables could effectively address the information gap regarding the extent ofQ.arkansanadistribution and conservation practices.In this study,there were two objectives: (1) evaluate the currentQ.arkansanadistribution and variables influencing it;and,(2) investigate how the range of this vulnerable species would vary under future climate change.The distribution ofQ.arkansanais largely concentrated in the southeastern United States and we hypothesized that its distribution would decline with climate change.
Materials and methods
Occurrence data
Q.arkansanaoccurs from southwestern Georgia to eastern Texas and from southwestern Arkansas to the Florida Panhandle (Fig.1).Occurrence records ofQ.arkansanawere acquired from current populations and historical collections,representing 741 records.Current populations were sampled in 89 locations (Fig.S1).Historical data were collected from multiple herbaria through the Southeast Regional Network of Collections (https:// serne cport al.org/ portal/),encompassing 130 herbarium records from 22 herbaria,and the Global Biodiversity Information Facility (GBIF.org 2022).Any duplicate,cultivated,and questionable records (hybrids or recordings outside their natural habitats) were removed from the historical data and geolocated using the geolocation tool(https:// www.geo-locate.org/ web/ defau lt.html).
Environmental data
A combination of bioclimatic and topographic variables was used to predict the current and future habitats forQ.arkansanaof 16 states in the southeast United States (Arkansas,Oklahoma,Alabama,Florida,Georgia,Kentucky,Kansas,Louisiana,Missouri,Mississippi,North Carolina,Tennessee,Texas,South Carolina,Virginia,and West Virginia)(Fig.1).Twenty-two environmental variables (19 bioclimatic and three topographic) variables were initially considered (Table S1;https:// www.world clim.org/ data/ biocl im.html).Three scenarios,SSP1-2.6,SSP2-4.5,and SSP5-8.5,were used to model suitable habitats forQ.arkansanaconsidering low,medium,and high climate change scenarios.EC-Earth3 (Earth System Model)-Veg data for present-day(historical) and future emission scenarios were used,which are relevant for evaluating the impact of model resolution on future low to high projections.
Environmental variables were checked for multi-collinearity,and those with correlation coefficients >0.7 and variance inflation factors (VIF) >5 were excluded (Dormann et al.2013;Table S2;Fig.S2).After removal,eleven variables remained for further analysis (Table 1).All variables were projected to WGS84 at a spatial resolution of 1 km2.Bioclimatic data for the current (1970–2000) and future(2040–2060,2060–2080,and 2080–2100) were downloaded from Worldclim Global Climate Data (https:// www.world clim.org/).For topographic data,elevation data were downloaded from the United States Geological Survey Digital Elevation Model (DEM) database,~ 3 m resolution (https://earth explo rer.usgs.gov/).Slope and aspect data were then calculated from the DEM in ArcGIS Pro software (esri.com).
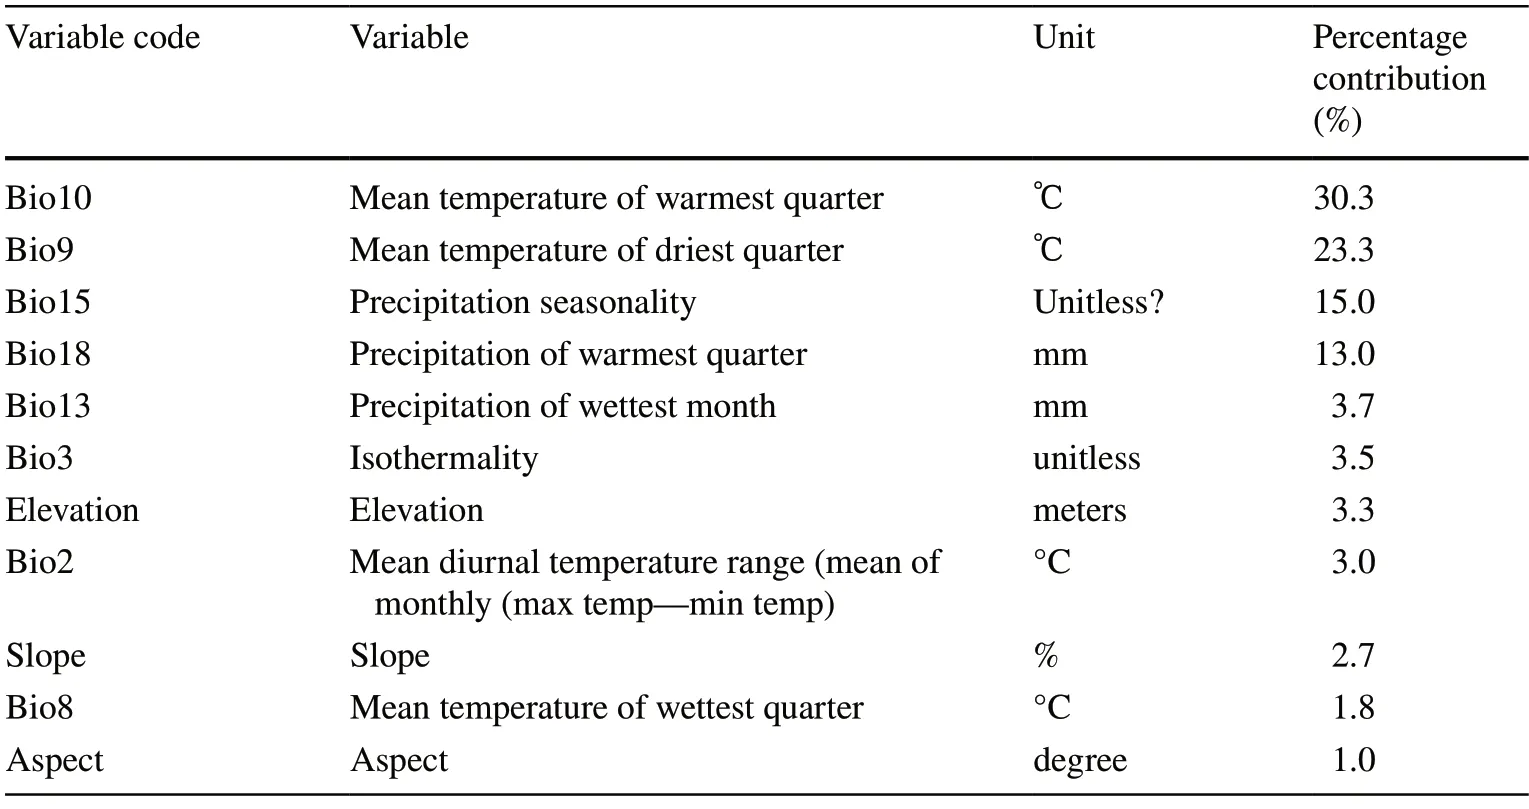
Table 1 Percentage contribution by environmental variables in model prediction of suitable habitat
Species distribution modelling
First,sampling bias and spatially autocorrelated occurrence data were addressed through spatial rarefaction or filtering (Kramer-Schadt et al.2013;Boria et al.2014;Aiello-Lammens et al.2015).Because current only data in collections are typically biased as most records are samples of convenience and occur near roads with a lack of full representation of any systematic sampling (Graham et al.2004).Thinning artificially reduces the number of occurrence points within a set distance to reduce the effects of spatial autocorrelations (i.e.,one record retained for 1 km radial distance).Since thinning is a random process,100 iterations will allow the creation of multiple datasets to find the maximum number of records that can be retained.After occurrence thinning,one dataset with the highest number of retained occurrences for modelling was randomly selected.As a result,328Q.arkansanapresent locations were retained with only one data point at each grid cell (1 km2),thereby reducing spatial autocorrelation,sample bias,and improving predictive performance of the SDMs.
The prediction accuracy of nine algorithms were checked:artificial neural network (ANN),classification tree analysis(CTA),flexible discriminant analysis (FDA),generalized additive model (GAM),generalized boosting model (GBM),generalized linear model (GLM),maximum entropy (MAXENT),random forest (RF),and surface range envelope(SRE).Only three SDMs were used to predictQ.arkansanadistribution,including maximum entropy (MAXENT) and random forest (RF) suggested by Williams et al.(2009) for rare species,plus gradient boosting model (GBM) based on their predictive accuracy,true skill statistics (TSS) and area under curve (AUC) values of >0.90.
Because absence data for the species was not recorded in original field surveys,randomly selected pseudo-absences were used in lieu of actual data.Pseudo-absences were generated by randomly assigning unoccupied grid cells within a polygon containing the collective known distribution ofQ.arkansanawithin the region based on field sampling,which used presence data and information about the background matrix where the species was absent.We randomly generated 10,000 background samples for model training.
Once SDMs were fitted with optimized parameters(TSS >0.9),all were run three times using a randomly chosen 80% of the presence data,with the remaining 20% used to cross-validate model results.Altogether,27 models were run,using three model algorithms (GBM,MAXENT,RF),three pseudo-absence selections,and three evaluation runs.Models were calibrated to generate habitat suitability maps.True Skill Statistics (TSS) were used (from -1 to+1) as a model evaluation criterion with models having a TSS value >0.90 to build an ensemble model through a weighted mean approach (Marmion et al.2009).The built-in BIOMOD2 function was used to compute the relative variable importance and response curve,which determines the role of predictor variables in explaining species distribution.BIOMOD2 uses a randomization procedure that measures the correlation between the predicted values and predictions where the variable under investigation is randomly permutated.If the contribution of a variable to the model is high,then the prediction is more affected by a permutation and therefore the correlation is lower (Thuiller et al.2009;Kunwar et al.2023).A low correlation score,i.e.,randomized variable,has more influence on the prediction making and is considered important for the model in its prediction.In the variable importance output,the values given correspond to 0–1,the correlation score.High values will therefore reveal a high importance of the variable,whereas a value close to 0 will indicate little or no importance.To calculate the percentage contribution of each environmental variable in the model,the variable importance value was converted into a percentage (divided by a total,i.e.,a sum of all the variable values in the model).All analyses were run in R v4.0.0 (R Development Core Team 2020) using the ‘biomod2’ package (Thuiller et al.2020).Biomod2 is a species distribution modeling platform developed for multi-model ensemble modeling.By combining predictions from multiple models,ensemble SDMs account for the strengths and weaknesses of each modeling technique and produce more accurate and robust predictions.To calculate range shifts under different climate scenarios,the ‘range size’ function within the BIOMOD2 package was used.
Protected area calculations
A shapefile was downloaded for protected areas of the United States (PAD-US database),managed in part by the US Geological Survey and Gap Analysis Project (USGS 2022).Attribute information contained in the database for each protected area boundary include,but are not limited to,agency names,protected area names,size of the protected area,and area manager type (USGS 2022).Prior to calculating the area of suitable habitat within protected boundaries,predicted habitat suitability raster images were reclassified to suitable habitat (>80% suitability),as present (value=1),and as not suitable (<80% suitability) as “NODATA”.Using the zonal statistics as table tool in ArcGIS Pro v3.0.2,the area of predicted suitable habitat within protected areas was calculated for all states under the three climatic scenarios for 2050,2070,and 2090.Zone type setting was set to manager type of the protected area.When calculating total area of suitable habitat that is protected,only state and federally managed lands were considered due to uncertainty of management practices by other organizations.
Results
Contribution of environmental variables in the model.
Mean temperature of the warmest quarter (bio10,30.3%),mean temperature of the driest quarter (bio9,23.3%),seasonal precipitation (bio15,15%),and precipitation of the warmest quarter (bio18,13%) contributed the most to the model (Table 1).Topographic factors (elevation,aspect,and slope) contributed <7% to the model,relatively low (Fig.2,Table 1).Temperature-related variables contributed~ 60%(Table 1).The mean temperature of warmest quarter (bio10)contributed the highest,with habitat suitability peaking at 25–27 ºC (Fig.2).Similarly,increasing the mean temperature of the driest quarter increased habitat suitability.Precipitation-related variables (bio13,15,18) contributed~ 30% to the model (Table 1).Both precipitation of the warmest quarter (bio 15,13%) and seasonal precipitation (bio 15,15%) were important for the distribution ofQ.arkansana.Areas with high precipitation (~ 250 mm) during the warmest quarter and low seasonal precipitation were highly suitable forQ.arkansana(Fig.2).
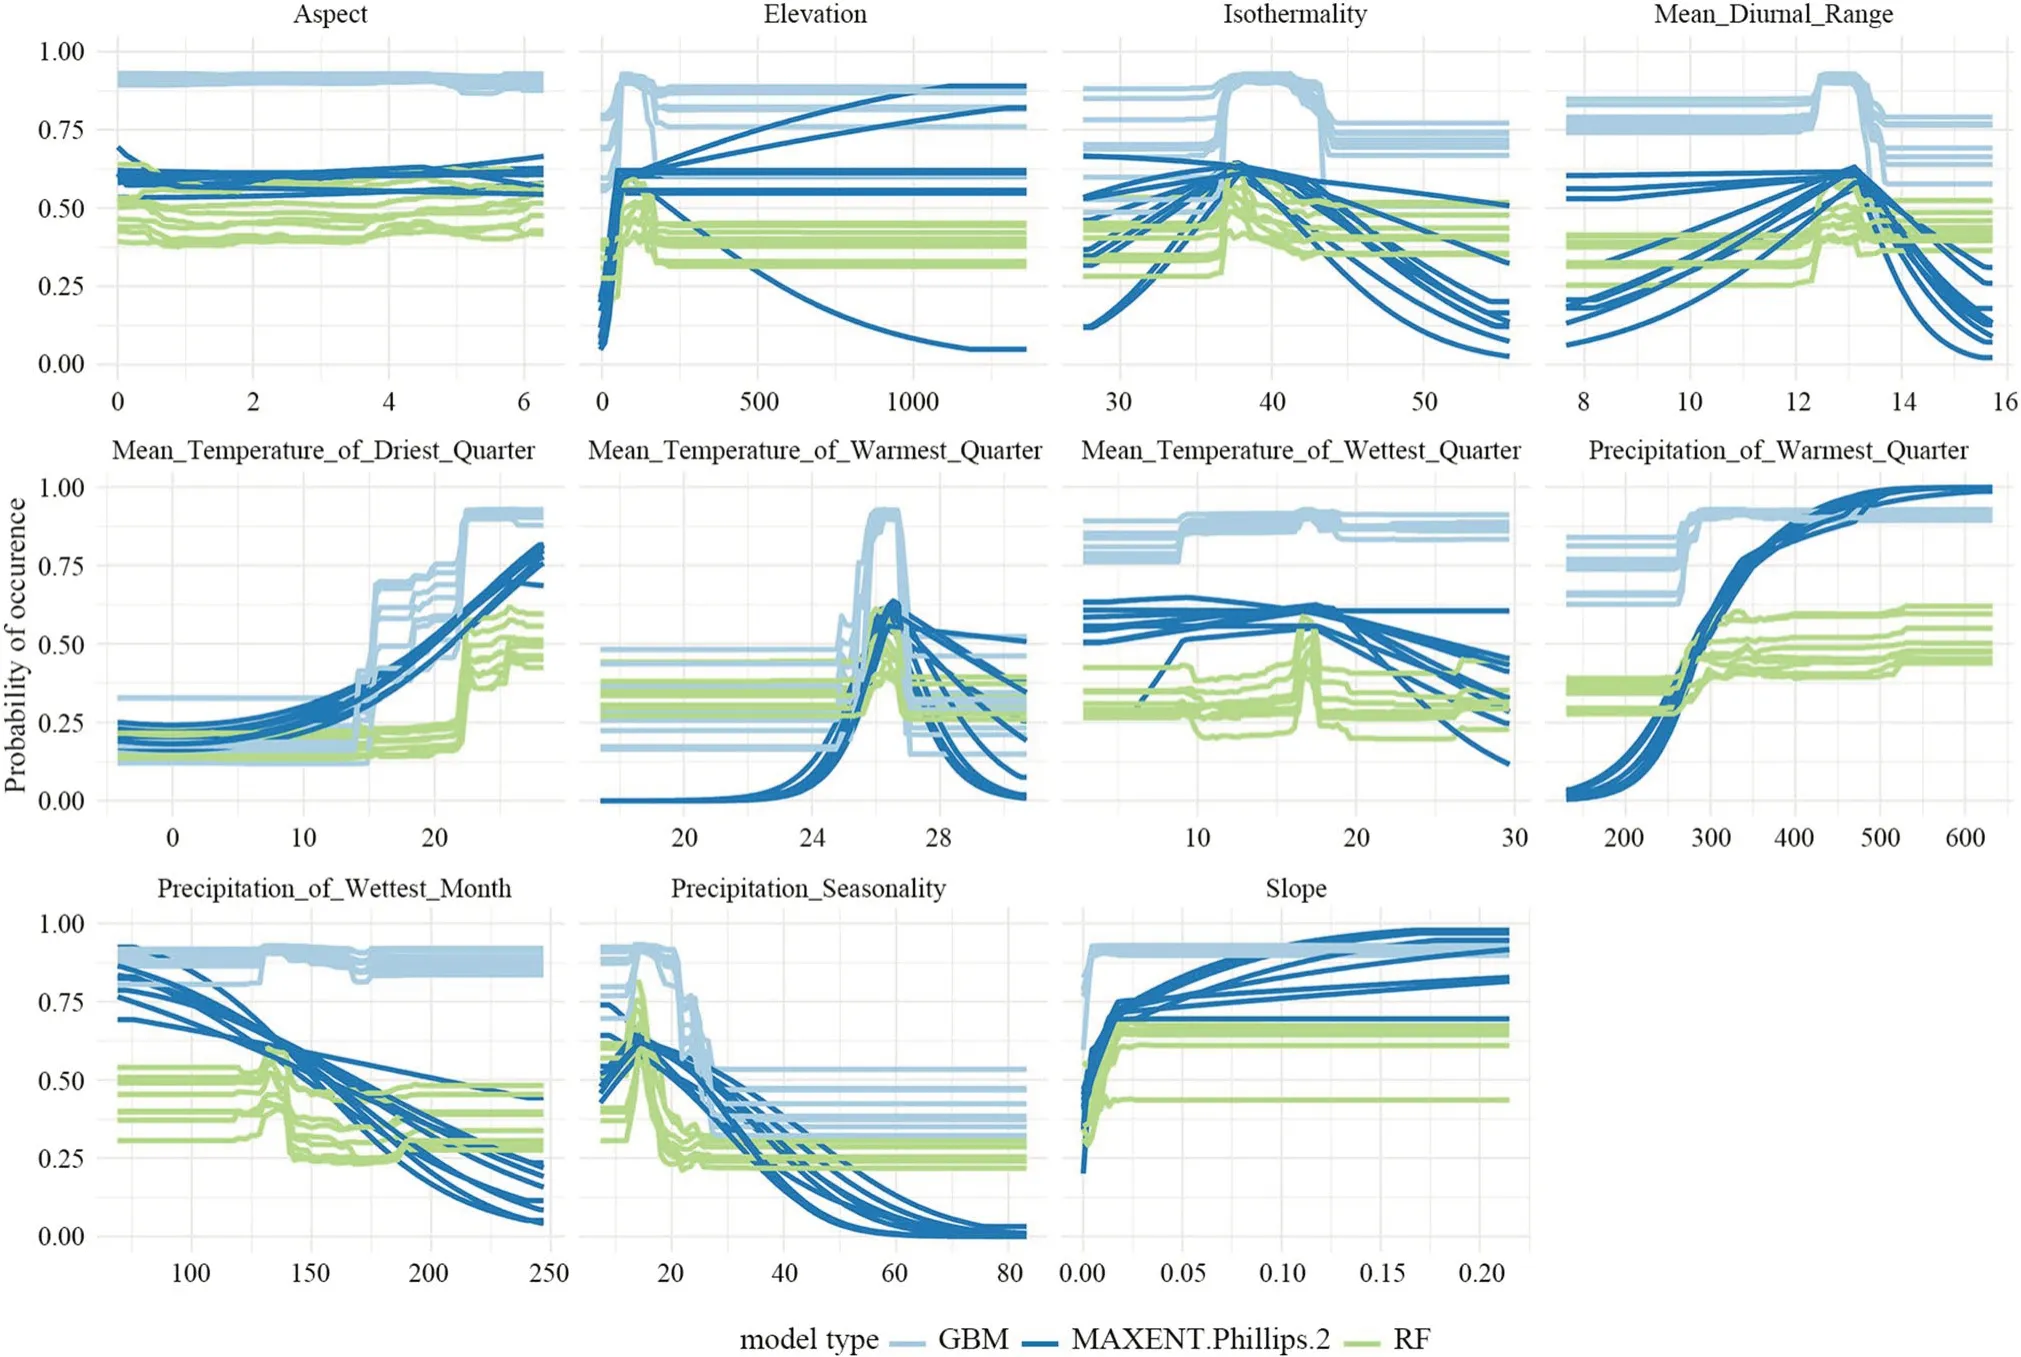
Fig.2 Response curves for environmental variables for the three models,GBM (light blue),MAXENT (dark blue),and RF (green)
Current suitable habitat
The predicted habitat forQ.arkansanais over 127,000 km2(Fig.3).Currently,12,147 km2or approximately 9.5% is within state and federally managed protected areas (Table 2).Among the 16 states included in this study,the model predicted that only seven states (Texas,Arkansas,Alabama,Louisiana,Mississippi,and Florida) currently have suitable habitats forQ.arkansana.Among these states,the largest suitable habitats was predicted in Arkansas (34,490 km2) followed by Alabama (31,571 km2),Mississippi (22,768 km2),Louisiana (17,194 km2),Georgia (13,828 km2),Florida(4,663 km2),and Texas (3,367 km2) (Fig.3).States with the highest suitable areas within the current protected areas are Mississippi (3,040 km2),Alabama (2,209 km2),Florida(2,171 km2),Arkansas (1,248 km2),Texas (1,256 km2),Georgia (1,016 km2),Louisiana (914 km2),and Oklahoma(293 km2) (Table S1).

Table 2 Projected suitable habitat for Q. arkansana under future climate change scenarios;protected habitat only includes state and federally managed land

Fig.3 Predicted current occurrence probability distribution of Q. arkansana across 16 states with blue-green areas representing a high occurrence probability and white representing low probability
Future suitable habitat

Fig.4 Projected habitat changes for Q. arkansana by 2050,2070,and 2090 under the SSP1-2.6 climate scenario

Fig.5 Projected habitat changes for Q. arkansana by 2050,2070,and 2090 under the SSP2-4.5 climate scenario
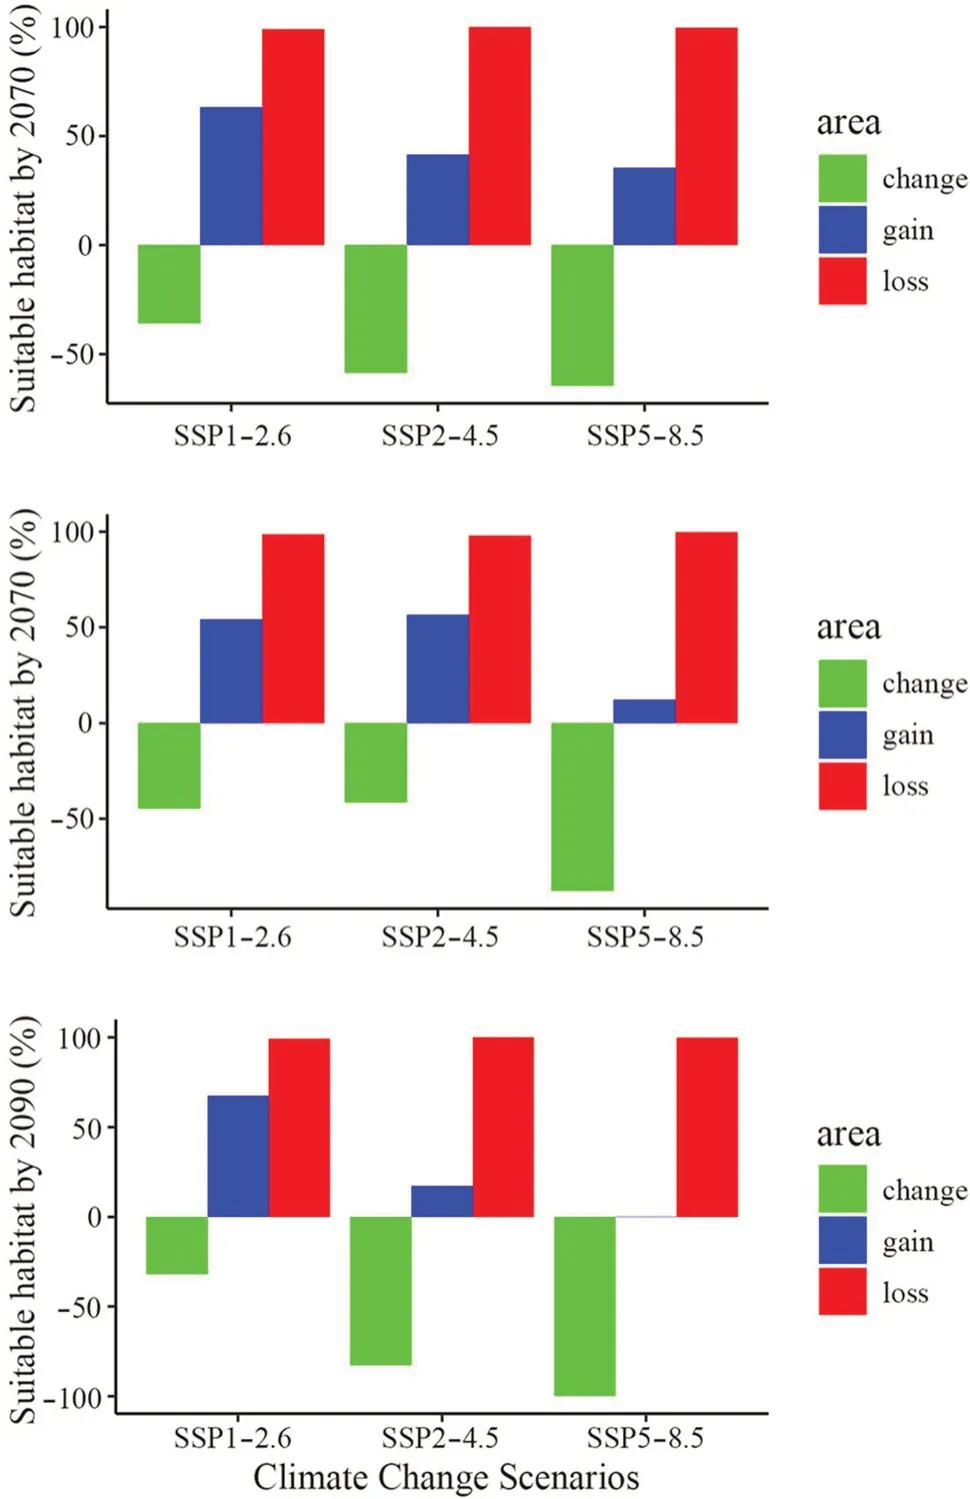
Fig.7 Projected habitat changes for Q. arkansana under three climate change scenarios by 2050,2070,and 2090
Discussion
The SDM approach provides a realistic picture of the potential distribution ofQ.arkansanawithin its native range in the southeastern U.S.that can be used to guide conservation strategies for this endemic and vulnerable species.Our results highlight suitable habitat across seven states,including both current known observations as well as additional areas where the species potentially exists.Among the bioclimatic and topographic factors used in the model,distribution ofQ.arkansanawas influenced primarily by four temperature and precipitation related variables with approximately 90% contribution to habitat prediction.The inclusion of these four variables in combination effectively described the most favorable climatic and topographic environment for this species.Under climate change scenarios,by 2050,2070,and 2090,all current suitable habitats forQ.arkansanaare predicted to shift northward into new areas,mainly in Tennessee and Kentucky.
Mean temperature of the growing season (typically June to August),was the most influential variable describing the distribution ofQ.arkansana,which may limit its local survival and long-term population persistence.The response curves generated from our model suggested thatQ.arkansanamay require a mean temperature between 24–28 °C (Fig.2) during the growing season.This requirement might be related to the long-term sustainability of populations,as it is restricted to the southern edges of southeastern states and extending along the coastal plain of the Gulf of Mexico.On the other hand,during this quarter,it may need large amounts of rainfall (>300 mm).Precipitation deficit during the wettest month might prevent fruit from maturing over the 18 months required for the species(Löf et al.2019).In addition,a certain minimum amount of precipitation and warm temperatures during early spring are also required to satisfy multiple regeneration-centric phases,including the completion of winter seed dormancy requirements,initiation of both vegetative bud development and flower bud differentiation (Johnson et al.2019).The topography of some of the habitats ofQ.arkansanafrom southwestern Arkansas is diverse,consisting of low hills and sharp ridges dissected by deep ravines on the slopes to sandy barrens,and dry to mesic woodlands (Palmer 1925;Ogle et al.2020).The ability ofQ.arkansanato maintain colonies on such diverse sites might represent evidence of present relics of a former wider distribution that have managed to persist in these more favorable diverse areas.
Our estimation of suitable areas mainly occurs on the Gulf Coastal Plain in southern Arkansas,as well as in scattered locations in South Georgia,northwest Florida,northwest Louisiana,and eastern Texas.The model also predicted the existence of suitable habitat in Mississippi,which was expected,although it has yet to be documented in the state(NatureServe 2022).However,there are numerous historic occurrences from the 1900s along the Gulf Coastal Plain which very well may be still in existence,but unconfirmed without surveys.Although it was predicted for the species to occupy a larger ecological niche,they are mostly fragmented and isolated.More commonly,they are often distributed in local,discontinuous patches in Alabama,Arkansas,Georgia,Florida,and Texas.Due to the patchiness of this species,Q.arkansanahas been poorly recorded and may be more widespread than is currently understood.It may be present in unknown habitats within its native range,and may be overlooked or mistaken for the common blackjack oak (e.g.,Q.marilandicaMuenchh.) due to its cryptic nature (see Beckman et al.2019).Surveys in the species western range have located populations in Texas (Hunt et al.1995) and it may be present in other locations based on our predictions in this study that have not been surveyed.It is recognized that SDM only predicts the species climatic niche (climatically suitable habitats) (Pearman et al.2008),rather than its actual niche;other biotic factors (e.g.,competition among species),geographical barriers,and natural and anthropogenic disturbances may influence the species distribution in predicted suitable habitats.
According to our predictions of suitable habitat,only 9.5% is currently incorporated within protected areas.The southeast is one of the most rapidly urbanizing areas of the United States (Alig et al.2004),and the U.S.Census Bureau(2020) reports that the number of people there has grown quickly over the past few decades.Currently,the southeast experiences high levels of landcover disturbance and change,primarily due to timber harvest,agriculture,disease,and urbanization (Homer et al.2015).Urbanization in this region is predicted to increase by 63% to 71% from 2001 to 2051(Lawler et al.2014).As such,with urbanization comes the loss of forest habitat due to deforestation (Drummond and Loveland 2010),and the increasing use of forestry practices(Lawler et al.2014).Increased urbanization will result in the loss of suitable habitat forQ.arkansana.Further,urbanization is expected to increase by 2051 in close proximity to protected areas such as national parks and forests,resulting in an estimated 30% decline in plant cover,thus most likely increasing the fragmentation of suitable habitats under future climate scenarios (Martinuzzi et al.2015;Subedi et.al.2022).
The predicted estimates of suitable habitat support the hypothesis that climate change will shiftQ.arkansanadistribution to the more northernly states of Tennessee and Kentucky.This indicates a positive response ofQ.arkansasnato the projection of increased temperatures and rainfall in North America.CurrentQ.arkansanadistribution occurs in warmer and moist areas in southeastern states as well as in coastal areas (Jerome et al.2017b;Beckman et al.2019;NatureServe 2022).Models projected that the effects of climate change would effectively shift the species by increased temperature and rainfall in places whereQ.arkansanacurrently does not occur.Because it currently is found in warm,moist areas,suitable habitat forQ.arkansanais expected to expand into more northern and north-eastern parts of the country with increases in temperature and moisture.Our model predicted a significant contraction in habitat suitability for this oak species under medium and high climate scenarios for 2050,2070,and 2090.Current habitats will become unsuitable and current unsuitable areas will show higher climatic suitability.Overall,all future climatic scenarios showed a significant contraction of suitable habitats across all scenarios and time periods.Under an extreme future climate change scenario (SSP5-8.5),the climatically suitable habitat forQ.arkansanawas predicted to be zero by 2090.
Plant species may respond to climate change by expanding their habitats,being restricted to refugia,or disappearing(Iverson and McKenzie 2013).Species with a wide ecological niche can benefit from future climatic conditions and may likely expand their range.However,species with limited geographical distribution,sensitivity to exposure to new environments such as drought,and low adaptive capacity will become more threatened (Westoby and Burgman 2006).Our model projected thatQ.arkansana populationswould shift significantly northward.At present,Q.arkansanais represented by a number of restricted populations,vulnerable to extinction by extreme environments due to climate change (Kluza et al.2007;Kliejunas 2010).Moreover,considering the need for several weeks of a moist and cold environment for seed germination in red oak group species,prevailing conditions may not support such broad migration of all localized populations (Bonner 1987;Löf et al.2019).
Conclusions
Our results indicate thatQ.arkansanawill face a considerable decrease in habitat suitability over the next 30 years.With a predicted loss of nearly 100% of current habitat by 2050,even under a low climate change scenario,a complete loss of suitable habitat is predicted by 2090 under the highest greenhouse gas emission scenario.Q.arkansanawill experience extreme vulnerability due to climate change.The large geographic shifts projected under very low to extreme climate change scenarios constitute a major threat forQ.arkansanasurvival.Our analysis contributes to the prediction of future distribution ofQ.arkansana,a species of conservation concern,and can be utilized as a valuable management and conservation planning tool for this threatened species.
Q.arkansanais already critically imperiled in Arkansas,imperiled in Georgia,and Louisiana,and vulnerable in Arkansas,Alabama,and Florida (NatureServe 2022).The large extent of suitable habitat outside of protected areas suggests that a species-specific action plan incorporating protected areas and other areas is crucial for its sustainable conservation.To reduceQ.arkansanaextinction risk due to climate change,one option would be to identify current and future suitable habitats,and to establish new,viable populations.Similarly,this species may be present in numerous unknown habitats;more surveys in suitable areas are warranted.Moreover,protection ofQ.arkansanahabitat against climate change requires locally and regionally focused sustainable conservation policies,adaptive management strategies,and educational outreach among local populations.One important aspect of the conservation of rare species is to enhance the genetic diversity of the remaining populations,and conserve plants in situ and ex situ.Similarly,public education is urgently needed because most suitable habitats,including current populations,are within non-protected areas.
AcknowledgementsWe thank the undergraduate students at Arkansas Tech University for their help during the field and laboratory work,especially Hannah Bridges,Jonathan Aguirre-Lopez,and Boone Ruston.We are also thankful to the Arkansas State Parks and the National Park Service for allowing access to the sites.
Open AccessThis article is licensed under a Creative Commons Attribution 4.0 International License,which permits use,sharing,adaptation,distribution and reproduction in any medium or format,as long as you give appropriate credit to the original author(s) and the source,provide a link to the Creative Commons licence,and indicate if changes were made.The images or other third party material in this article are included in the article’s Creative Commons licence,unless indicated otherwise in a credit line to the material.If material is not included in the article’s Creative Commons licence and your intended use is not permitted by statutory regulation or exceeds the permitted use,you will need to obtain permission directly from the copyright holder.To view a copy of this licence,visit http:// creat iveco mmons.org/ licen ses/ by/4.0/.
Hao T,Elith J,Lahoz-Monfort JJ,Guillera-Arroita G (2020) Testing whether ensemble modelling is advantageous for maximizing predictive performance of species distribution models.Ecography 43:549–558
McDowell NG,Allen CD,Anderson-Teixeira K,Aukema BH,Bond-Lamberty B,Chini L,Clark JS,Dietze M,Grossiord C,Hanbury-Brown A,Hurtt GC (2020) Pervasive shifts in forest dynamics in a changing world.Science 368:eaaz9463.https:// doi.org/ 10.1126/scien ce.aaz94 63
杂志排行

Journal of Forestry Research的其它文章
- New indices to balance α-diversity against tree size inequality
- Climate-growth relationships of Pinus tabuliformis along an altitudinal gradient on Baiyunshan Mountain,Central China
- Nitrogen mineralization in the oldest climax communities in the eastern Mediterranean region
- Physiological and psychological responses to tended plant communities with varying color characteristics
- Impact of cattle density on the structure and natural regeneration of a turkey oak stand on an agrosilvopastoral farm in central Italy
- Peat properties of a tropical forest reserve adjacent to a fire-break canal