Nitrogen mineralization in the oldest climax communities in the eastern Mediterranean region
2024-01-26FatmaSelcenSakarrcanlery
Fatma Selcen Sakar · Gürcan Güleryüz
Abstract In this study,we investigated how tree species affect N mineralization in connection to some soil properties and seconder metabolite levels of litter,in the soil of the oldest native forest communities.In the oldest pure communities of Pinus nigra (PN),Fagus orientalis (FO),and Abies bornmuelleriana (AB) in the mountain range of Mount Uludağ,Bursa,Turkey,annual net yield and N mineralization in the 0–5-and 5–20-cm soil layers were determined in a field incubation study over 1 year.Sampling locations were chosen from 1300 to 1600 m a.s.l.,and moisture content (%),pH,water-holding capacity (%),organic C,total N,and C/N ratio,and annual net mineral N yield of the soil and hydrolyzed tannic acid and total phenolic compounds in litter were compared for these forest communities.F. orientalis had the highest annual net Nmin yield (43.9 ± 4.8 kg ha–1 a–1),P. nigra the lowest (30.5 ± 4.2 kg ha–1 a–1).Our findings show that in the oldest forest ecosystems,the seasonal soil moisture content and tree species play an essential role in N cycling and that hydrolyzed tannic acids and total phenolic compounds effectively control N turnover.Tannic acid and total phenolics in the litter were found to inhibit nitrification,but total phenolics were found to stimulate ammonification.
Keywords Oldest forest communities · Nitrogen mineralization · Nitrification · Tannic acid · Total phenolic · Litter
Introduction
In forest ecosystems,the above-and belowground components,litter,and soil are four major sources that are responsible for the flux of nutrients (Persch et al.2015;Awasthi et al.2022a,b).Among these,belowground factors have a pivotal role in the functioning of a forest ecosystem and contribute more than 30% of the net primary productivity of the terrestrial ecosystems (Mikieleko et al.2021;Karki et al.2022;Pandey et al.2023a).Generally,in terrestrial ecosystems,the availability of soil N restricts primary production (Chapin et al.2002;LeBauer and Treseder 2008),and N availability is a key factor in ecosystem productivity(Vitousek and Howard 1991;Bonito et al.2003).Many studies of N transformation processes have shown that soil pH,temperature,moisture,soil organic matter quality,and quantity,in particular,total N and C/N values can great affect N mineralization (Owen et al.2003;Knoepp and Vose 2007).Changes in land-use modify the physicochemical properties of soil and thus,have a great influence on the soil N mineralization processes (Bargali et al.2019;Manral et al.2022;Pandey et al.2023b).However,changes in soil N concentration and the process of N mineralization in different landuse systems are not well characterized and may vary with site quality,species composition,and management practices(Karki et al.2021;Manral et al.2023).N mineralization by microbes mainly depends on the N levels in the soil in any system and the nature of the nutrient inputs (Padalia et al.2018;Ullah et al.2019;Manral et al.2020).
Soil organic matter is typically the principal source of N in mature forests (Nadelhoffer et al.1999a,1999b).The amount of organic matter that plants produce and the rate at which it decomposes vary greatly among plant species(Lovett et al.2004;Chapman et al.2006;Güleryüz and Everest 2010).The prevailing consensus is that deciduous tree species provide higher quality litter than coniferous tree species do (Bauhus et al.1998;Aerts and Chapin 2000;Berendse and Scheffer 2009).In relation to this hypothesis,N mineralization rates are higher in soils with deciduous species than in those with coniferous species.However,other studies have shown the opposite situation (Hackl et al.2004;Zhang et al.2011).Vegetation type and tree species greatly impact both soil C and N dynamics (Hobbie et al.2007).The lignin/N and C/N ratios in the litter also directly impact decomposition rates (Taylor et al.1989;Hobbie 2008).Soil C/N ratio has been shown to be negatively correlated with nitrification and N mineralization (Lovett et al.2004;Venterea et al.2003).
Many studies have addressed the effect of changes in species diversity on N cycling in plant communities that have been designed and established by research groups (e.g.,Tilman et al.1996).However,the effects of natural communities on key ecosystem functions such as N cycling and its relationship to the factors affecting the communities are not as well studied.According to Arslan et al.(2010),a natural oak stand and a thinned oak stand had higher yearly net accumulation of nitrates than in pine plantations,demonstrating the significance of species of tree and forest management approaches on N cycling in forest ecosystems.
Phenolic compounds in the litter also affect the microorganisms that degrade soil organic matter and thus influence soil processes such as N and C mineralization (Kanerva 2007;Smolander et al.2012;Adamczyk et al.2018;Smolander and Kitunen 2021).Several studies have indicated that tannin and/or polyphenol content in litter are good indicators of decomposition,net N mineralization,and N immobilization rates (Campbell and Fuchshuber 1995;Kalburtji et al.1999;Driebe and Whitham 2000).In general,plants growing in low pH and low soil fertility conditions tend to have high concentrations of phenolic compounds,including tannins (Northup et al.1998;Thoss et al.2004).Phenolic compounds have also been shown to provide a C source for microbial populations in forest soil (Schmidt 1988;Souto et al.2000),but high tannin content in the litter is generally associated with low decomposition rates (Kalburtji et al.1999;Kraus et al.2003).In addition,phenolic compounds in leaf litter or humus may inhibit nitrification (Baldwin et al.1983;Kraus et al.2004;Kanerva et al.2006).
As natural areas are shrinking in the world and in Turkey,land-use changes and degradation also affect global nutrient cycles.Studies that have focused on predicting the effect of biodiversity change on the global cycle by determining the changes that occur in the N cycle when the species composition changes in natural (i.e.,anthropogenically undisturbed) areas.A significant part of the forest areas in Turkey are natural ecosystems.Anatolia has a high biodiversity with 20.76 million hectares (about 27% of the country) of forest cover (Kaya and Raynal 2001).Climax forests,composed ofCedrus libanicommunities and three endemicsAbiescommunities [A.cilicica(Antoine et Kotschy) Carrière,A.nordmanniana(Stev.) Spach,A.bornmuellerianaMattf.],are of considerable significance to Turkey in terms of being natural ecosystems.There are also pure or mixed compositions of the oldest native climax forests such asAbies bornmuelleriana(AB),Fagus orientalis(FO),andPinus nigra(PN) on Uludağ Mountain,Bursa,Turkey.These forests occur in natural communities on the northern slopes of this mountain.The objective of this study was to investigate how tree species affect N mineralization in the soil of the oldest native forest communities in relation to various soil properties and the total phenolic and tannin content in the litter.
Material and methods
Study area
The study area on Uludağ Mountain in Bursa in northwestern Turkey (40°4′ N,29°13′ E) constitutes the western end of the Pontic mountain range.It has granitic slopes in the northwest and steep calcareous rock slopes in the south,with a variety of metamorphic and plutonic granodiorites making up the nucleus (Ketin 1983).The mountain has a mediterranean-type climate at lower elevations,which are close to the city of Bursa on its northwestern side,and a rainy,partially moderate microthermic climate,with freezing winters at higher elevations.Climate diagrams,according to Walter and Lieth (1960–1967),show climatic differences between Bursa city and Uludağ Zirve station (Fig.1).The mountain’s climate has been categorized as belonging to the East Mediterranean climate group’s first family (Akman 1990).At Uludağ’s top,the maximum snow depth is 430 cm,and there are on average 66.7 snow days each year,and 179.2 days with snow cover (Güleryüz 1992).
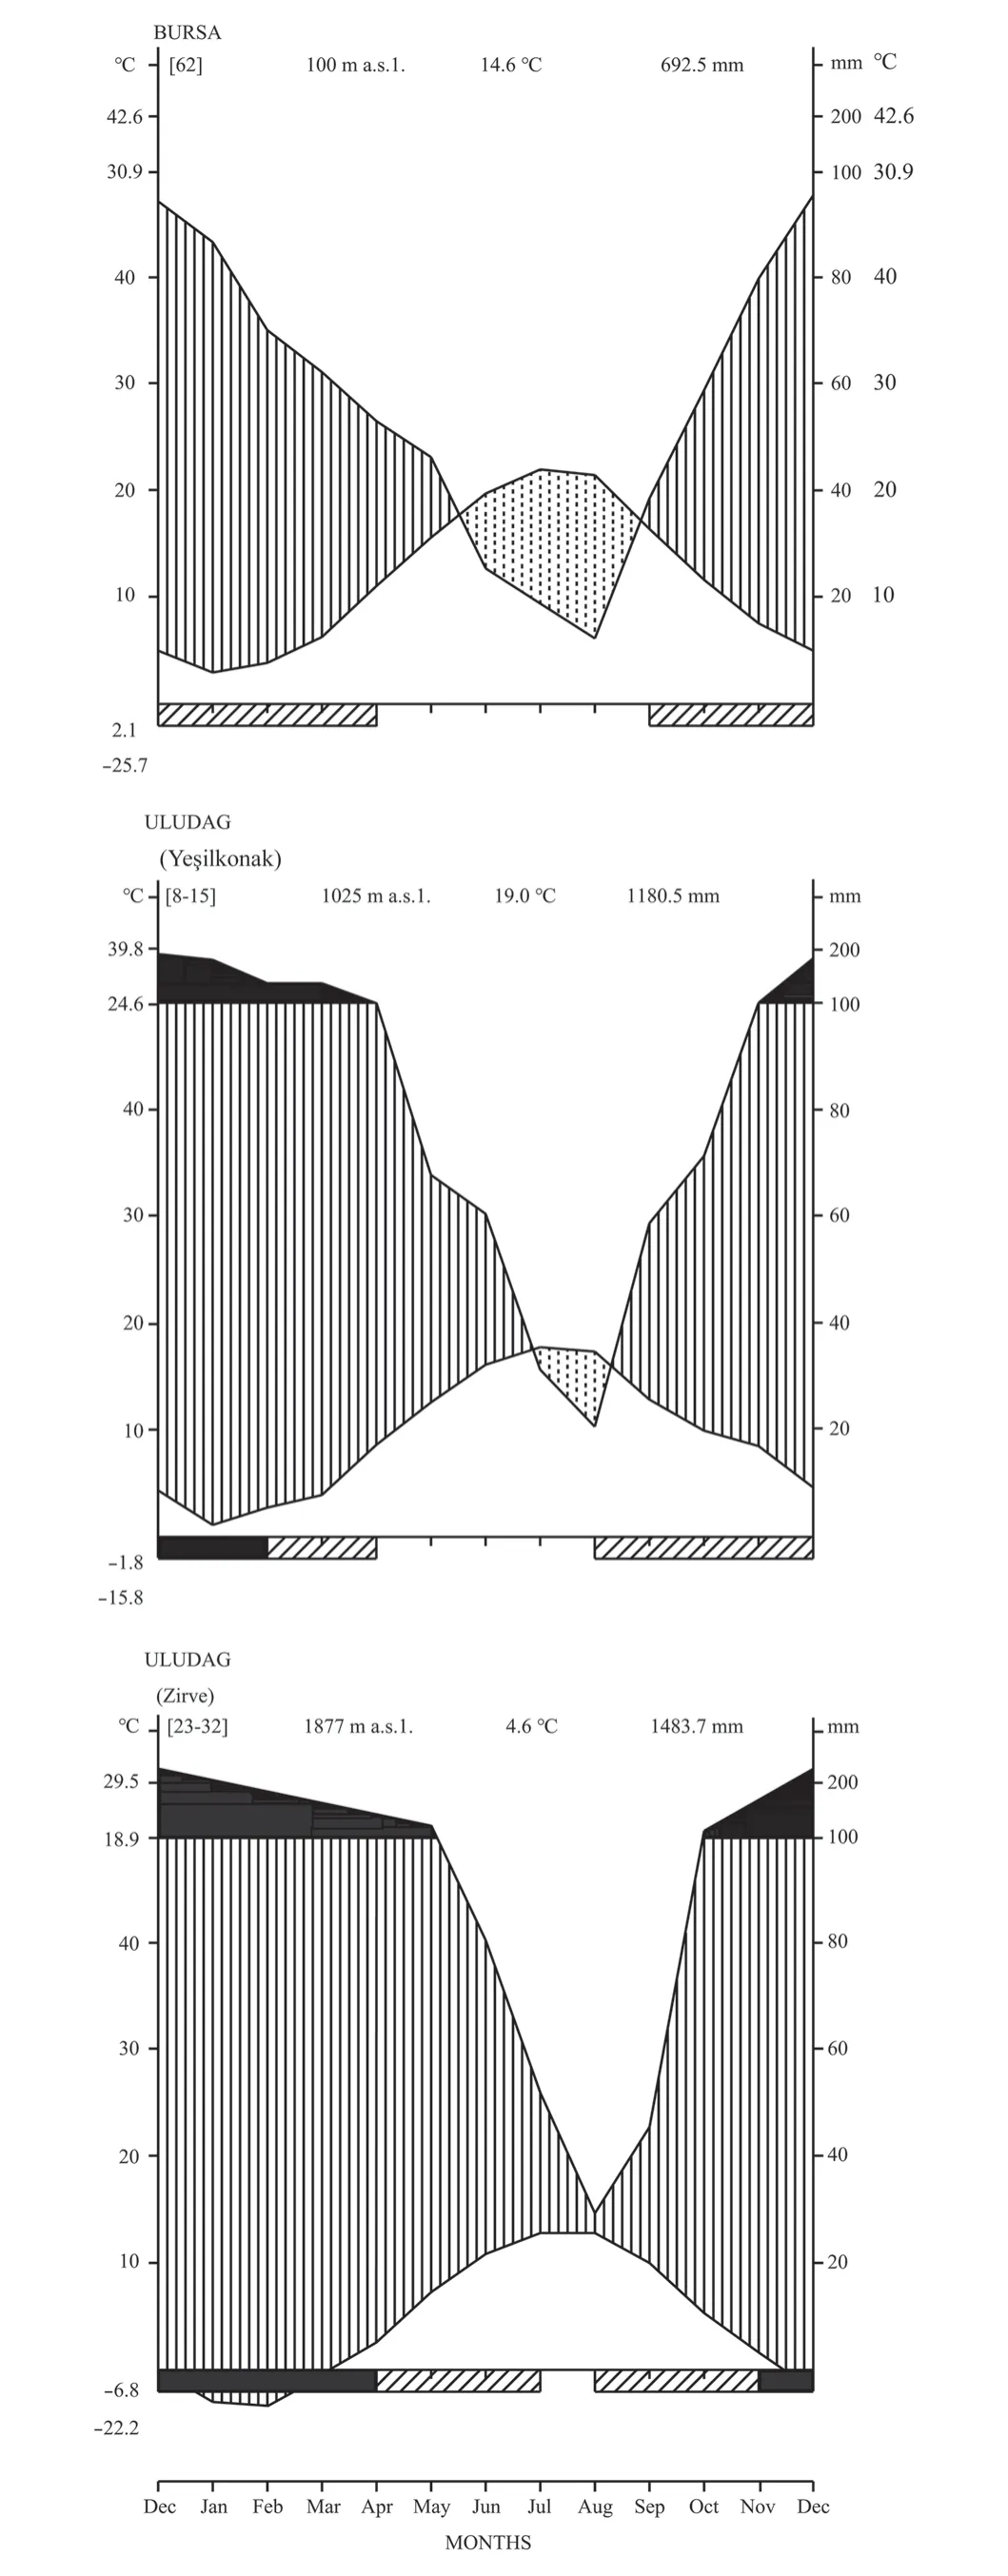
Fig.1 Climate diagrams for Bursa,Yeşilkonak,and Uludağ,Turkey (from Güleryüz [1992] and Ergül [1987] after Walter and Lieth [1960–1967]).Curve of average monthly precipitation corresponding to curve of average monthly temperature in relation of 20 mm=10 °C=1 unit of scale.Humide period vertically hatched,arid period dotted
The 11,338-ha Uludağ National Park,one of Turkey’s first national parks,was established in 1961.Because of its elevation (2543 m a.s.l.) and geologic features,it has a diverse range of endemic species that constitute many distinct vegetation types.For example,there are pure or mixed compositions of the oldest native climax forests such asAbies bornmuelleriana,Fagus orientalis,andPinus nigra.Uludağ is therefore considered to be one of Turkey’s Important Plant Areas (IPAs) (Güleryüz et al.2010a).
Soil sampling and field incubation
One sampling site (100 m × 100 m) for each community(pureA.bornmuelleriana,P.nigra,andF.orientalis) was selected from the mountain belt between 1300 and 1600 m a.s.l.Our study sites in the northwest have a substratum of granitic rock.Details for each site are given in Table 1.
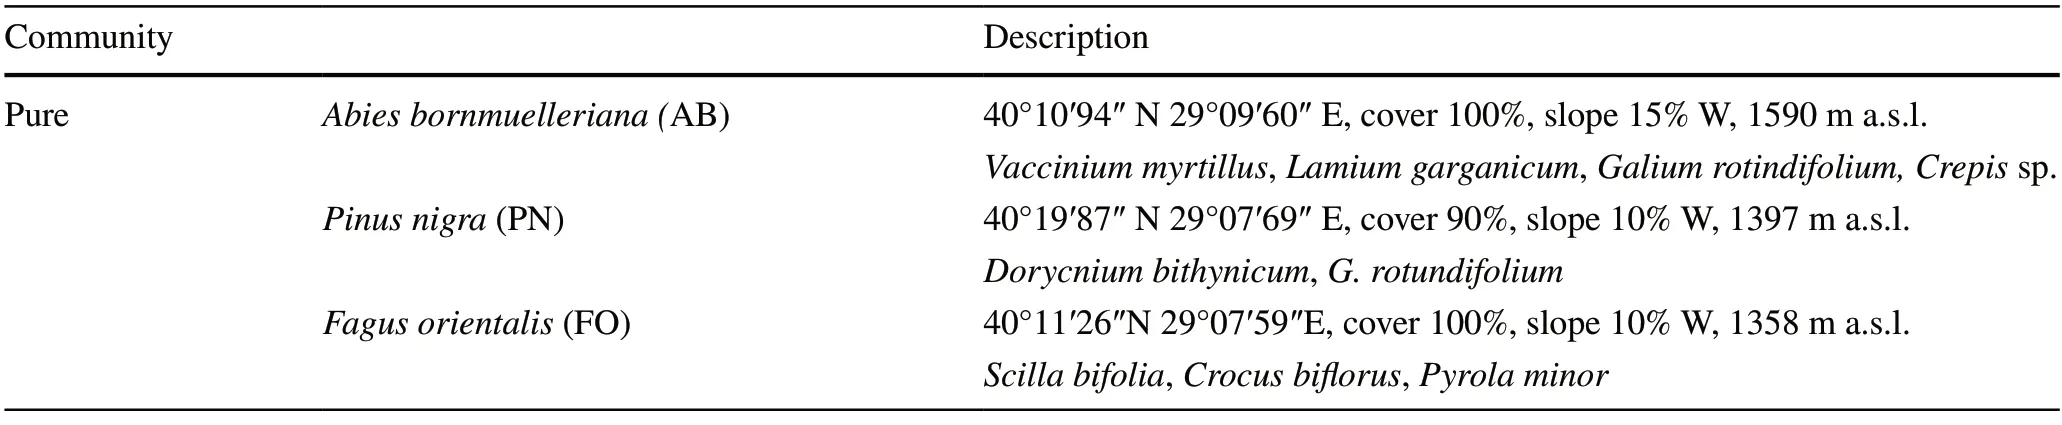
Table 1 Description of sampling sites for each plant community
Soils were collected and buried for different periods of incubation at the sites using the “buried bag method”(Eno 1960) from May 2013 to May 2014.Three mineral soil layer samples (0–5 cm and 5–20 cm) were collected to determine the bulk density (20 cm × 20 cm × 20 cm) from random locations inside the sampling site of each forest type (Bulk density is calculated with incubating and collected soil samples).Roots and the gross fraction of the soil were separated from the samples using a 4-mm mesh sieve,and they were then mixed separately.After then,each soil sample was subdivided into two samples.In order to determine the initial mineral N contents (Actual Nmin) in the soil solution,one sample (about 100-200 g) was taken to the laboratory (three soil samples collected at each forest type).The other sample (about 100–200 g) was reburied in a polyethylene bag at the same depth it was taken (Incubated Nmin) (Three bags buried at each forest type) (Güleryüz et al.2008).Soil samples were transported in ice boxes and kept at+4 °C in the laboratory for short periods of time until analysis.From 3 May to 26 October 2013 at 6-week intervals (first four incubation period) and during a snowcovered incubation period in winter from 26 October 2013 to 1 May 2014 (fifth incubation period,about 32 weeks),soil moisture,mineral N concentration,and pH were measured (1.incubation period: 03.05.2013-22.06.2013,2.incubation period: 22.06.2013-02.08.2013,3.incubation period: 02.08.2013–15.09.2013,4.incubation period: 15.09.2013–26.10.2013,5.incubation period:26.10.2013-01.05.2014).In September 2013,litter samples were collected to measure total phenolic compounds and hydrolyzed tannic acid.
Soil extraction and chemical analyses
Soil moisture and the water-holding capacity (%) were measured volumetrically,total soil N (%) was determined using the Kjeldahl method,and the wet incineration method was used to determine total organic C (%) in the soil (Steubing 1965).The pH of the fresh soil materials was measured using a 1:2.5 mixture of soil to water (in saturated mud;Steubing 1965).The microdistillation technique was used to determine the soil mineral N (Bremner and Keeney 1965;Gerlach 1973).The total phenolics and hydrolyzed tannic acid concentration of the litter were determined spectrophotometrically using the Folin–Ciocalteu method (Makkar 2000).
Calculations and statistical analyses
The net N mineralization (Nmin) yield for each sampling(incubation) period was determined by subtracting the actual Nmin from the Nmin in the incubated sample (kg Nmin ha–1).The annual total mineral N yield (kg Nmin ha–1a–1)for each soil layer and community was calculated by adding the net yield values from each incubation period.Because the incubation periods were different durations,the net N mineralization yield for each period was transformed into daily yields.The net N mineralization per week (kg Nmin ha–1week–1) was then calculated using the daily yields.The seasonal fluctuation of the net N mineralization was determined using the weekly yields (Güleryüz et al.2008;Arslan et al.2010).
The soil pH,moisture,water-holding capacity (WHC%),organic C (% and kg/ha),total N (% and kg/ha),and C/N ratio,and annual net mineral N yield and the hydrolyzed tannic acid and total phenolic compounds of litter were compared for significant differences between the forest communities using a one-way ANOVA.In addition,the seasonal fluctuations of actual Nmin,net mineral N yield (kg Nmin ha–1week–1) and soil moisture content for each community were analyzed.The significance among means was determined by the Tukey HSD test.A simple correlation test was also used to analyze the relationship between each soil property (soil moisture,pH,maximum water holding capacity,organic C,total N,and C/N ratio) and the net mineral N yield and the relationship between the concentration of hydrolyzed tannic acid and total phenolic compounds in the litter and the annual net NH4+-N and NO3––N yield in soil(0–5-cm layer).Statistica Ver.6.0 (SAS/STATICA) was used for all tests with significance levelα<0.05.
Results
Soil properties
Table 2 shows the results of the comparison of soil properties between the sample sites.All soil properties differed significantly between the communities except for moisture,pH,and C (% and kg/ha) in the 0–5-cm layer (α<0.05).For soil properties in the 5–20-cm layer,except for organic C,differed significantly (α<0.05).Total N levels were lower in the AB community than in other communities in the layer of 0–5-cm,but organic C levels were similar among the communities.The C/N ratio was highest in the AB community.All communities had a similar mean pH,but the pH was highest in the PN community,which also had a relatively high soil WHC% in the 0–5-cm layer(Table 2).

Table 2 Mean ± SD values for soil properties at depths of 0–5 and 5–20 cm.Different letters indicate significant differences in a specific soil property at a specific soil depth among the communities according to Tukey’s HSD test (α <0.05);N=15
In addition,seasonal fluctuation of soil moisture (0–5-cm layer) during the year was significant in all communities,it is found significant in all communities except the AB community in the layer of 5–20-cm (α<0.05).In all communities,soil moisture was highest in May 2013 and lowest in September 2013 (Fig.2).

Fig.2 Mean (± SD) soil moisture (%) at soil depths 0–5 and 5–20 cm in three old climax forest communities in 2013–2014.Different letters indicate significant differences in moisture at a specific soil depth in the community among sampling periods dates in Tukey’s HSD test (α <0.05);N=3
Actual mineral N
Actual NH4+–N did not differ among the sampling dates in the 0–5-cm soil layer of the PN community (α>0.05),in other communities it differed significantly (α<0.05).However,in the soil of 5–20-cm layer of all communities,the actual NH4+–N values differed significantly between sampling dates (α<0.05) (Fig.3).Actual NO3––N values for the soil in the 0–5-cm layer of all communities also differed significantly between sampling dates (α<0.05).While actual NO3––N values in the 0–5-cm soil layer in the AB community increased in May (α<0.05),these rates were also observed in the FO community in September and October (α<0.05) and in the PN community in May and October (α<0.05).All communities but FO had an increase in nitrate content in the 5–20-cm soil layer in May(α<0.05) (Fig.3).
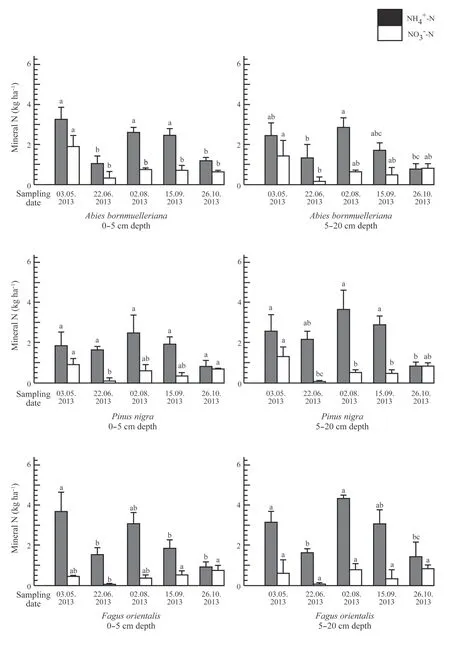
Fig.3 Mean (± SD) actual mineral N in soil depths 0–5 and 5–20 cm in old climax forest communities in 2013–2014.Different letters indicate significant differences in actual mineral N at a specific soil depth in the community among sampling periods dates in Tukey’s HSD test (α <0.05);N=3
Annual mineral N yield and seasonal fluctuation
As shown in Fig.4,seasonal fluctuations in net NO3-–N and NH4+–N yield (kg Nmin ha–1week–1) in the 0–5-cm soil layer of all communities differed significantly between sampling periods dates (α<0.05).In the 5–20-cm soil layer,net NO3-–N yield differed significantly among sampling dates for all situations (α<0.05) except in the AB community.In general,net NO3-–N yields in the AB and FO communities were highest in May and June.During the same period,the net NH4+-N yield was highest in the PN community.
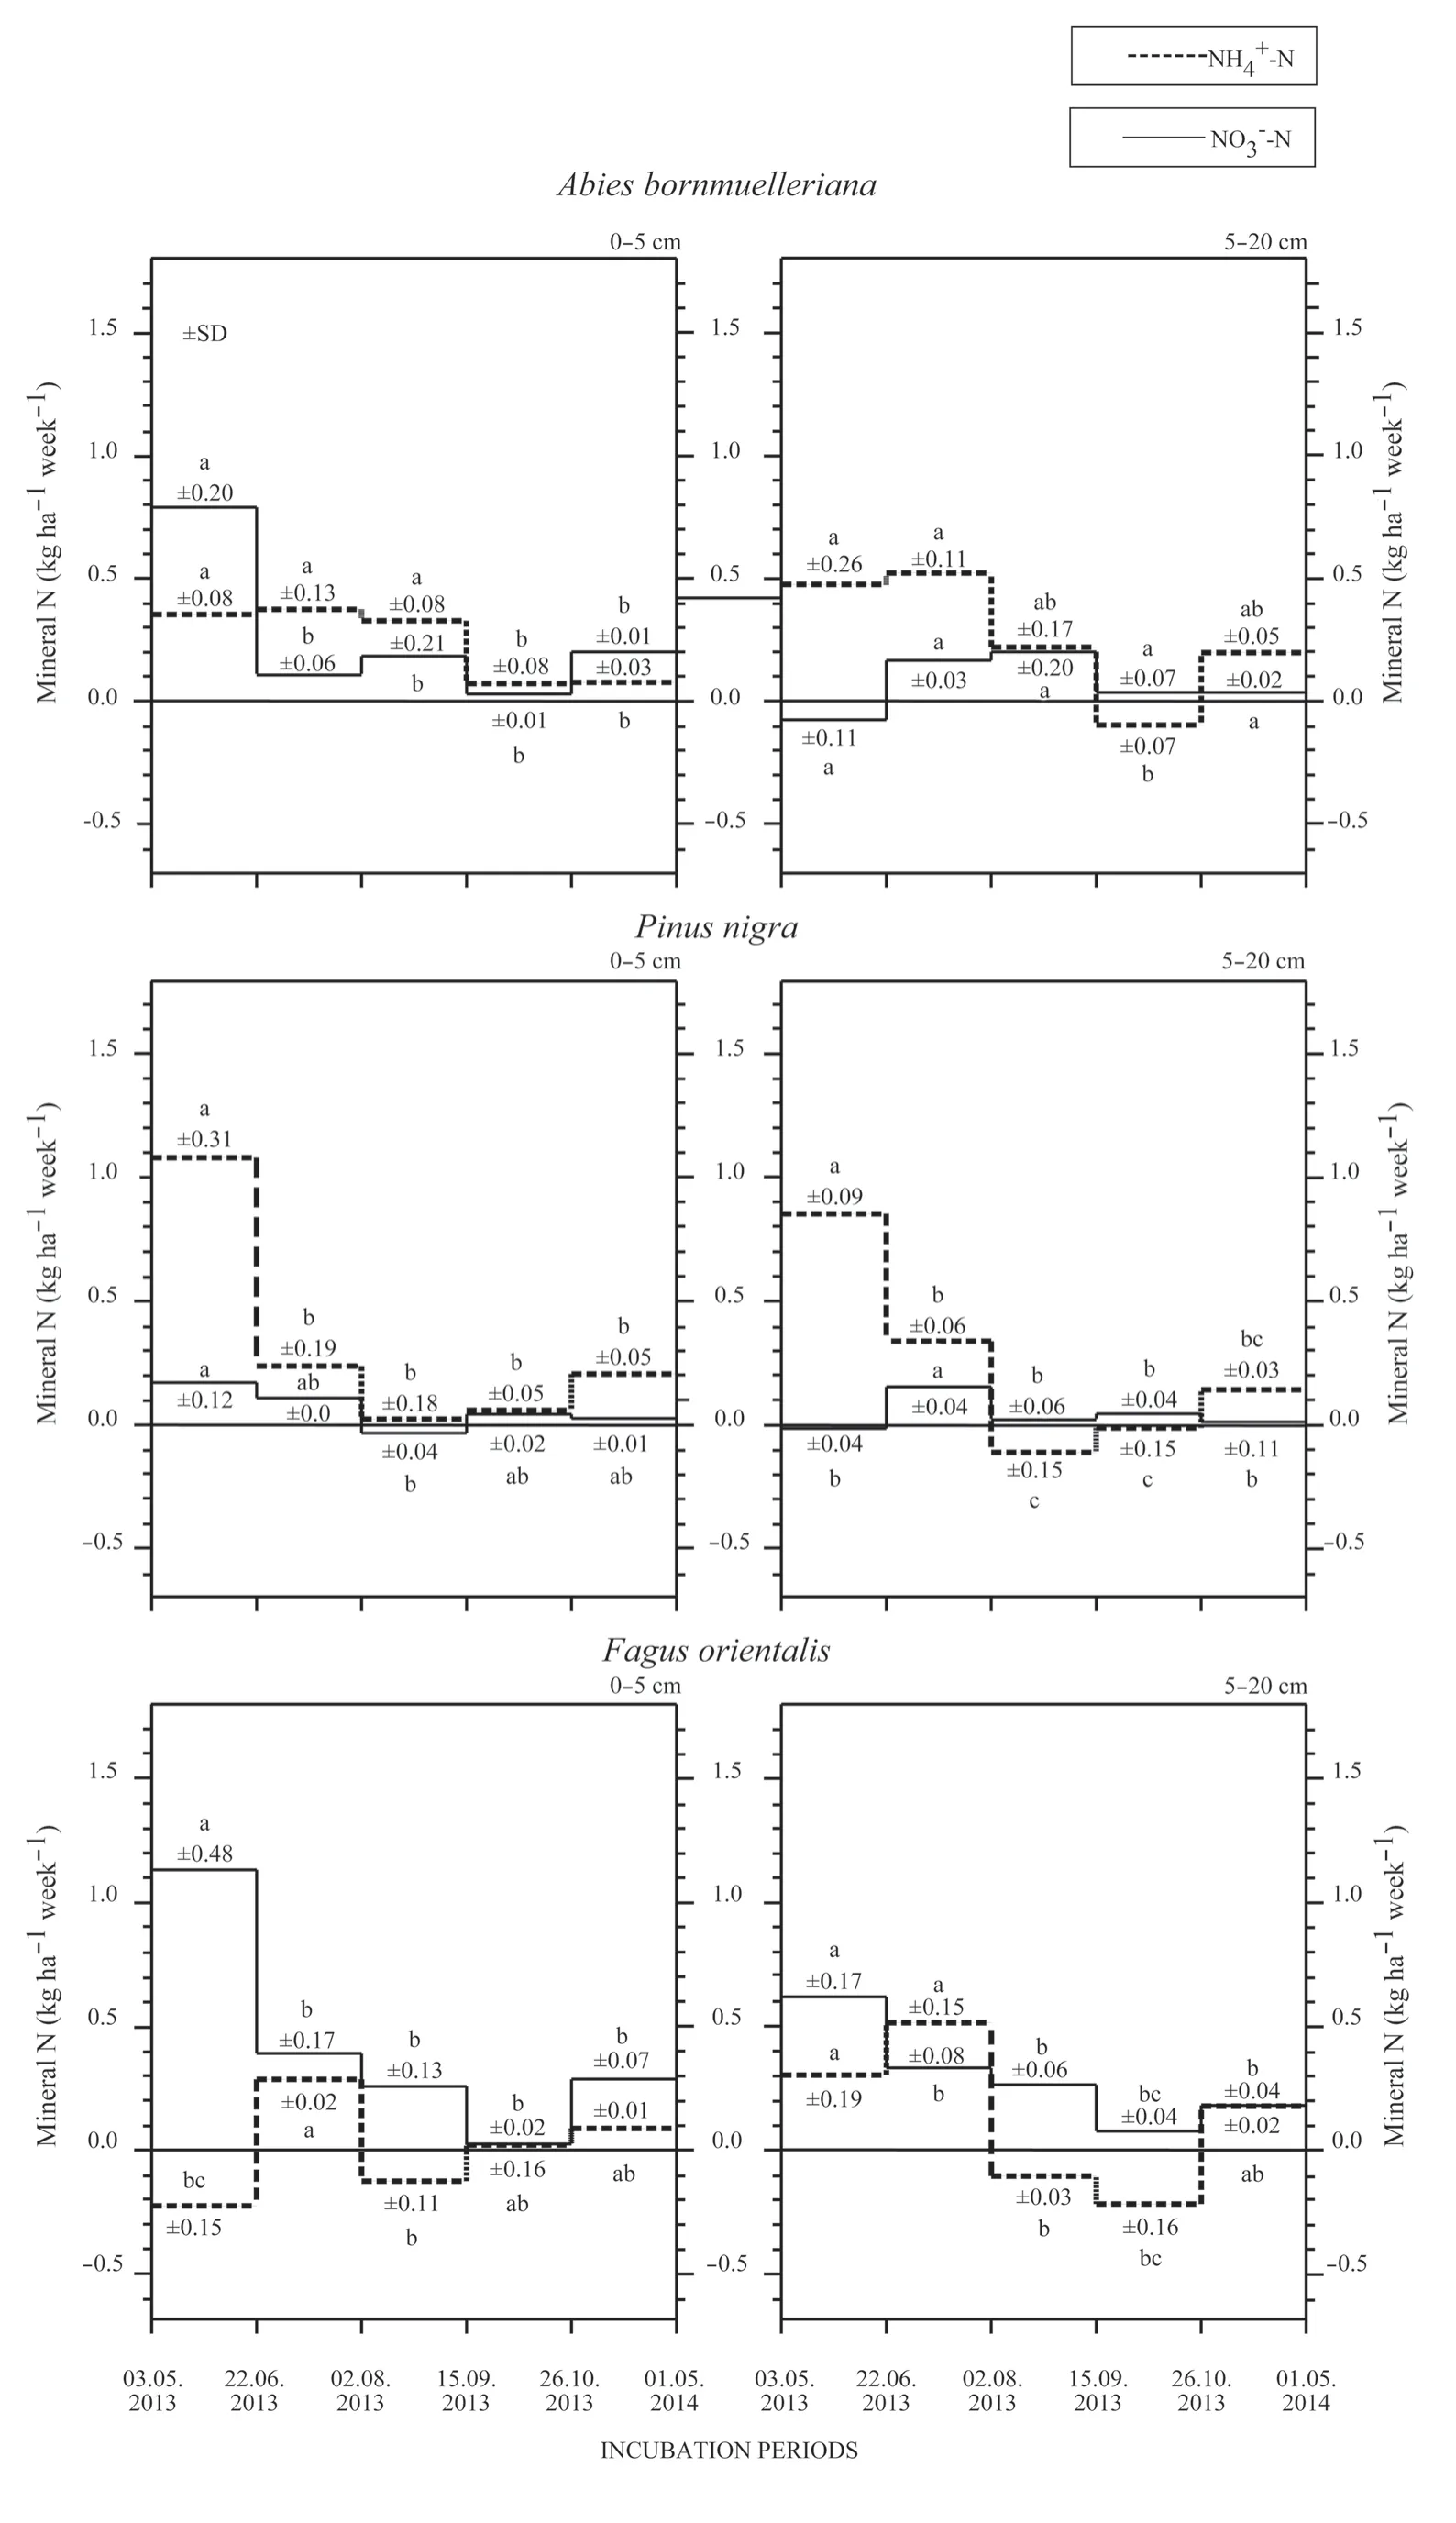
Fig.4 Mean (± SD) net mineral N yield (kg ha–1 week–1)at two soil depths in three old climax forest communities in 2013–2014.Different letters indicate significant differences in net mineral N at a specific soil depth in the community among sampling periods dates in Tukey’s HSD test (α <0.05);N=3
The annual net Nmin yields for the communities are shown in Table 3.Annual net NO3-–N yield in the 0–5-cm soil layer differed significantly between communities (α<0.05).The annual net NO3-–N yield in the 0–5-cm soil layer was higher in FO (19.8 kg ha–1a–1) than in the other two forest communities (AB: 12.9 kg ha–1a–1,for PN,2.5 kg ha–1a–1).The annual net mineral N yield(NH4++NO3-–N) differed significantly in the soil of 0–20 cm layer between the communities (α<0.05).FO had the highest annual net Nmin yield (43.9 ± 4.8 kg ha–1a–1),and PN had the lowest (30.5 ± 4.2 kg ha–1a–1).
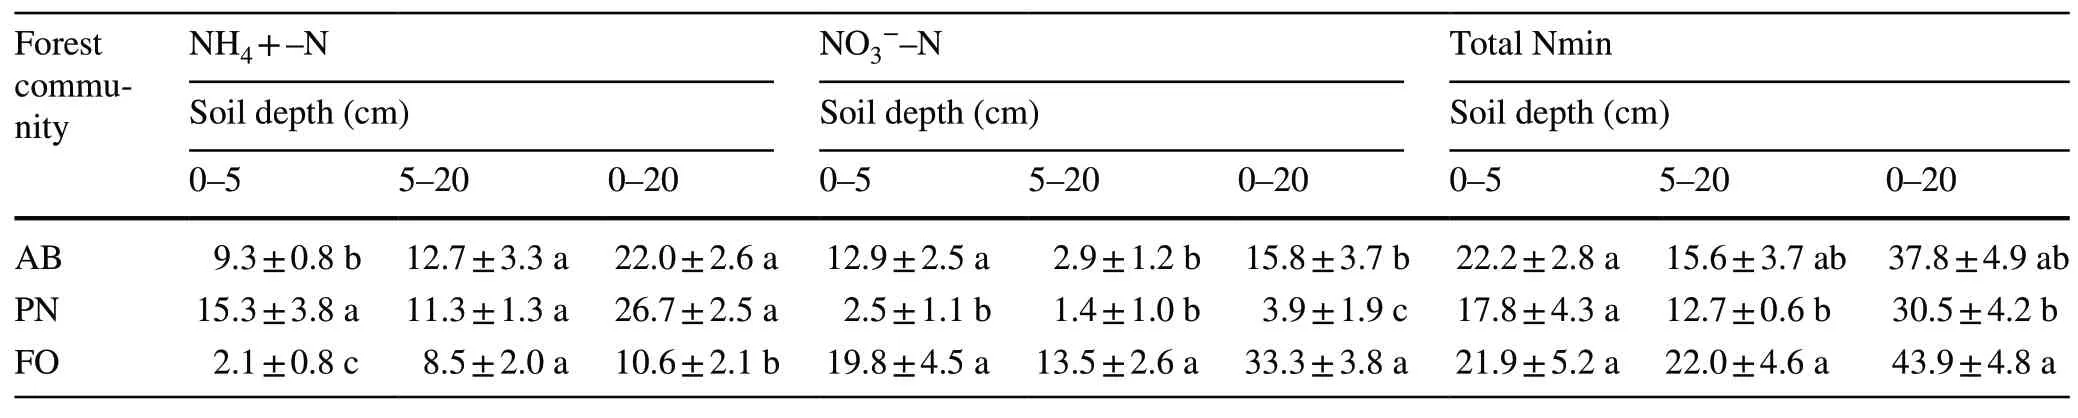
Table 3 Net annual mineral N yield (kg Nmin ha–1 a–1) in the three forest communities.Different letters indicate significant differences in net annual mineral N yield at a specific soil depth among the communities according to Tukey’s HSD test (α <0.05);means ± SD;N=3
Total phenolic compounds and tannic acid in the litter
The concentrations of secondary metabolites (total phenolic compounds and hydrolyzed tannic acid) in the litter layer differed significantly between communities (α<0.05)(Table 4).Hydrolyzed tannic acid and total phenolic compounds concentrations in the litter were low in the AB(53.2 ± 3.6 mg/L for total phenolics and 0.553 ± 0.2 mg/g organic matter for tannic acid) and FO (69.7 ± 13.6 mg/L for total phenolics and 0.783 ± 0.1 mg/g organic matter for tannic acid) communities and highest in the PN community(288.2 ± 41.5 mg/L and 1.833 ± 0.4 mg/g organic matter).

Table 4 Mean (± SD) total phenolic compounds and tannic acid content in litter layer in the three old forest climax communities
Correlation between soil characteristics and net mineral N yield
For both soil layers,only the relationship between soil moisture and net NO3-–N and NH4+–N yield was found to be significant (α<0.05).On the other hand,the correlation results for other factors were mixed (Table 5).

Table 5 The correlation coefficients between the soil annual net NH4+–N and NO3-–N nitrogen yield (kg Nmin ha–1 a–1) and soil characteristics in the 0–5 cm and 5–20 layer of soil,significance levels and regression equities [n=45;0.05]
Correlation between total phenolic compounds and tannic acid in the litter and soil net mineral N yield
Total phenolics concentrations in the litter was positively correlated with annual net NH4+-N yield (α<0.05) and negatively correlated with annual net NO3––N yield (α<0.05)in the top layer of soil (0–5-cm),respectively.Soil NH4+–N yield and tannic acid were not positively significantly correlated (α>0.05),but soil NO3-–N yield was significantly negative correlated with tannic acid (α<0.05) (Table 6).
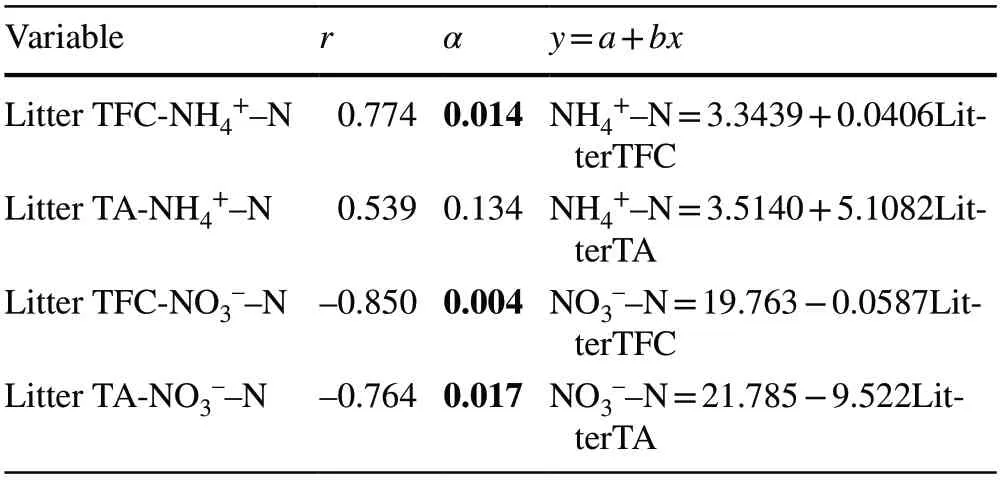
Table 6 Correlation coefficients between the annual net soil NH4+–N and NO3––N nitrogen production and total phenolic compounds (Litter TFC) and tannic acid (Litter TA) in litter,significance levels and regression equations (N=9)
Discussion
Physicochemical properties of soils vary in space and time because of variations in topography,climate,weathering processes,vegetation cover,and microbial activities (Paudel and Sah 2003;Manral et al.2020) and several other biotic and abiotic factors (Bargali et al.1993).In highly dissected mountainous landscapes,bioclimatic conditions change rapidly and may vary within short distances,resulting in a pronounced heterogeneity of soil types and their physicochemical properties (Baumler 2015;Bargali et al.2018).The soils on the Uludağ’s granite bedrock are located between 1300 and 2200 m above sea level and are generally loamy sand and sandy loam textures (Çepel 1978).These soils in northern aspect of Uludağ that made of granite bedrock have the highest sand content (78%–89%) and the lowest clay content (5%–17%) compared to other bedrocks in Uludağ (Çepel 1990).Sarıyıldız et al.(2022) recorded 83% sand,10.4% silt,6.6% clay,and the 1.41 g/cm3bulk density for the soil in theAbies bornmuellerianacommunity with a northern aspect at 1500–1600 m a.s.l.The physicochemical properties of soil from the sample sites are given in Table 2.
Soil pH,which is generally between 6.0 and 8.0(Kyveryga et al.2004),increases nitrification,whereas lower soil pH can prevent nitrification (Page et al.2002;Ste-Marie and Pare 1999).Here we revealed a low nitrate yield in the soil of theP.nigracommunity,which has acidic soil,consistent with findings from prior studies on acidic forest sites(Priha and Smolander 1997;Zhong and Makeshin 2006;Nugroho et al.2007).The acidic soil in theA.bornmuellerianacommunity and its high nitrate yield supports previous findings of nitrate in acidic soils (Zöttl 1960;Runge 1974).According to Bauhus et al.(1998),although deciduous species enhance soil properties by raising pH levels and increasing nutrient cycling,conifers can significantly alter soil characteristics in a negative way.While we determined a low nitrate yield in thePinus nigracommunity and high nitrate yield in the deciduousFagus orientaliscommunity,coinciding with our hypothesis,nitrification rates forFagus orientaliscould not be explained solely by changes in pH.Indeed,our correlation analysis showed that in both soil layers,the nitrification rate did not depend mainly on pH.Our results are consistent with those of Booth et al.(2005) that suggest that soil pH does not influence nitrification.
In addition to microclimatic conditions such as soil moisture and temperature,the chemistry of the throughfall and litter of a specific tree species has an impact on ground vegetation and C and N transformations (Barbier et al.2008).Organic matter produced by different plant types and its rate of decomposition can vary significantly between species(Lovett et al.2004;Chapman et al.2006).Organic matter quantity and quality are considered primary soil characteristics (Chapin 2003).
Total N also differed significantly (α<0.05) among the communities,but they had similar amounts of soil organic C.In the Toros Mountains,theP.nigracommunity had mean of 3.4 ± 0.3% C in soil samples collected from the 0–10-cm soil layer (Güleryüz and Everest 2010).This value is close to the average of 3.3 ± 0.4 in the 0–5-cm layer of the same community in our study,but the mean of 12.32 ± 5.35 for the same community on Spil Mountain is much higher (Güleryüz et al.2010b).In our study,the soil in theA.bornmuellerianacommunity similarly had a mean organic C of 3.4 ± 0.3% in the same layer of soil (0–5-cm).Sarıyıldız et al.(2022) also reported an approximate mean of 3.573 ± 0.24% C for the same species of community (1600–1700 m a.s.l.,N aspect).In our study,there was no statistically significant relationship between organic C % and the yield of NH4+-N in mineral soil for the different plant communities (0–5-cm layer)(α>0.05,r=0.127;Table 5),similar to previous findings(Güleryüz and Everest 2010).The amounts of total N were lower in the AB community (0.3 ± 0.1%,1404 ± 382 kg/ha)than in other communities in the upper soil layer (0.4 ± 0.1% for PN and FO,1784 ± 433 kg/ha for PO,1936 ± 369 kg/ha for FO).Total N % was 0.3 ± 0.1 in the AB community in the 0–5-cm layer,higher than 0.218 ± 0.08% reported by Sarıyıldız et al.(2022) for AB soils at 1600–1700 m a.s.l. on the N aspect.The soils in this community have high C/N ratios due to the low total N content (A.bornmuelleriana:11.8).Considering that the N mineralization in the soil is inversely proportional to the C/N ratio (Li et al.2014;Zeller et al.2007;Leuschner 2006),the annual net nitrate yield in the soils of theA.bornmuellerianacommunity is expected to be high.In our study,the annual net nitrate yield in the soils ofA.bornmuellerianaandF.orientaliscommunities is indeed high.It should also be noted that N mineralization is not influenced only by the C/N ratio.The quality of litter (lignin/N) can be more effective at regulating N mineralization in both mineral and organic soil than climate and other factors (Scott and Binkley 1997).It has been reported that the quality and quantity of the foliar litter characterized by C/N ratios and lignin/N affect N mineralization,nitrification,and litter decomposition rate (Taylor et al.1989) and differs among tree species in forest ecosystems(Nugroho et al.2006).Consequently,tree species highly influence humus type.Nitrogen in litter with higher lignin or other compounds that are more resistant to decomposition mineralizes more slowly than in the litter with more-labile C compounds (Chapin 2003).It is generally accepted that litter that contains a high level of N shows more net N mineralization than litter that contains a low level (Prescott et al.2000;Chapin 2003;Laughlin 2011) and is supported by the fact that theF.orientaliscommunity had the highest soil N content and N transformation rates.Several reports indicate that the C:N ratio and total N content have a far greater impact than conventional soil properties such as microbial biomass N to total N,microbial biomass C to total C,and pH on the rate of mineralization (Prescott 1995;Vervaet et al.2002).An extensive number of studies have identified soil N concentration as the best predictor of N mineralization rates (Wang et al.2001;Booth et al.2005;Ros et al.2011).In our study,in the 0–5-cm soil layer,total N and nitrate yield were not significantly correlated (α>0.05),but they were in the 5–20-cm soil layer (α<0.05) (Table 5).Nitrate yield had no significant relationship with the C/N ratio,similar to the result of Andrianarisoa et al.(2010).Some basic properties of nitrification such as pH and C/N ratio may also be an indicator for humus rather than mineral soil (Perssonet al.2000).In addition,Lovett et al.(2004) reported that the regulatory mechanisms involved in the mineralization process are much more complicated than for basic soil and litter properties such as lignin:N ratio,polyphenol concentrations,and/or the C:N ratio.
Only the relationship between soil moisture and net NO3––N and NH4+–N yield in both soil layers was statistically significant (α<0.05) (Table 5).Soil moisture was a major factor controlling seasonal fluctuations in nitrification and net N mineralization within communities.Net N mineralization peaked earlier in the summer while the moisture of the soil was highest.Our results are consistent with studies indicating that moisture plays a significant role in attempts to control net N mineralization (Pérez et al.2004;Knoepp and Vose 2007;Güleryüz et al.2010b).
A seasonal fluctuation in mineral N accumulation was found during the field incubations.Differences in the weekly NH4+–N yield were significant for all communities (α<0.05) (Fig.4).A negative ammonium yield was recorded in theF.orientaliscommunity from May to June and from August to September.The highest nitrification rates in the 0–5-cm soil layer were observed in communities AB (0.79 ± 0.2 kg NO3––N ha–1week–1),PN (0.17 ± 0.12 kg NO3––N ha–1week–1) and FO (1.13 ± 0.48 kg NO3––N ha–1week–1) during May and June.Similarly,Xiao and Huang (2012) found that NO3––N and NH4+–N concentrations in soils of three different forest types in the subalpineAbies fabriforests of Gongga Mountain were higher in April and June and decreased in August and October.On the volcanic Karadivrit mountain (Kula,Manisa),the mineral N yield for thePinus brutiacommunity (750–850 m a.s.l.) was high in spring and autumn in parallel with the Mediterranean climate precipitation regime (Gökçeoğlu 1988).
The PN community had the highest yield of NH4+-N in the soil of 0–20-cm layer (26.7 ± 2.5 kg NH4+–N ha–1a–1),whereas the FO community had the lowest (10.6 ± 2.1 kg NH4+–N ha–1a–1) (Table 3) compared with 5.7 ± 4.3 kg NH4+–N ha–1a–1forP.nigrain Spil Mountain (Güleryüz et al.2010b) and 16 ± 0 kg NH4+-N ha–1year–1for pine plantations and 22 ± 2 kg NH4+–N ha–1a–1for natural oak communities on the Uludağ University campus (100 m) (Arslan et al.2010).
Nitrification rates were mostly significantly higher in soils of the FO community (33.3 ± 3.8 kg NO3––N ha–1a–1) than in the PN (3.9 ± 1.9 kg NO3––N ha–1a–1).Although the AB community is also a coniferous forest,its annual nitrate yield(15.8 ± 3.7 kg NO3––N ha–1a–1) was considerably higher than in the PN community.This result is similar to that of Güleryüz and Everest (2010) who used a standard incubation method to determine that theAbies cilicicacommunity had a higher nitrate yield than in two other communities (P.nigraandCedrus libani) in the Central Toros Mountains.They even reported a negative nitrate yield.However,Güleryüz et al.(2010b) estimated the annual nitrate yield of theP.nigracover at the high altitude on Spil Mountain to be 12.4 kg NO3––N ha–1a–1for the 0–15-cm layer soil.This value is higher than in our PN on Uludağ Mountain and is closer to that in the AB community.The differences in nitrification rates between tree species in this study agree with the finding that soils fromPicea abies,Pinus sylvestris,andBetula pendulain Tönnersjöheden;B.pendulaplots had higher nitrification rates than in the other plots (Olsson et al.2012) and soils underFagus sylvaticahad higher potential nitrification rates than underPicea abiesandPinus sylvestris(Zhong and Makeshin 2006).These results generally support the hypothesis that deciduous species promote the presence of more soil microflora compared with coniferous trees (Scheu and Parkinson 1995).
Annual net Nmin yield values in 0-20 cm soil layer were calculated as 43.9 ± 4.8 kg Nmin ha–1a–1for FO,37.8 ± 4.9 kg Nmin ha–1a–1for AB and 30.5 ± 4.2 kg Nmin ha–1a–1for PN community.In aPinus brutiaforest,annual net Nmin yield was similar to our finding (28 kg Nmin ha–1year–1) (Gökçeoğlu 1988).However,the ammonium yield was negative forP.nigraon Spil Mountain (Güleryüz et al.2010b).Arslan et al.(2010) reported an annual net mineral N yield of 40 ± 1 kg Nmin ha–1a–1for pine plantations and 47 ± 3 kg Nmin ha–1a–1for natural oak forests.The N cycle of forest ecosystems is greatly influenced by tree species and practices of forest management.Annual net mineral N yield inBetula pubescens,P.abies,andP.sylvestriscommunities on drained peatlands was estimated at 127.5 kg Nmin ha–1a–1,87.7 kg Nmin ha–1a–1,and 11.8 kg Nmin ha–1a–1,respectively (Becker et al.2018).In our forest communities,the annual mineral N yield was higher than in theirP.sylvestrisforest but lower than in their two other communities.Our result is similar to the findings of Stump and Binkley (1993),that the net N mineralization rate in the forest floor of lodgepole pine is much lower than that of trembling aspen (Populus tremuloides) or of an Engelmann spruce (Picea engelmannii)–subalpine fir (Abies lasiocarpa)community.Our results are also consistent with those of Prescott et al.(1992) who discovered that during a 1-month incubation,the N mineralization rate in the forest floor of lodgepole pine was lower rate than that of subalpine fir.The potential net nitrification is high in the soils of Douglas fir (Pseudotsuga menziesii),Corsican pine (P.nigra),and beech (F.sylvatica) plantations is high but low in spruce(P.abies) and Nordmann fir (A.nordmanniana) plantations as it is in native forest stands (Andrianarisoa et al.2010).The high nitrification rates in soils of theF.orientaliscommunity in this study were similar to those in soils ofF.sylvatica(Andrianarisoa et al.2010).In contrast,in our analysis,nitrate in soils ofA.bornmuellerianawas high but low in soils ofP.nigra.Differences in N transformation rates seemed to be related not only to plant type but also to soil properties.Also unlike our results,Hackl et al.(2004)stated that compared to beech and oak forests with smaller N pools,N mineralization potential is typically higher in pine,floodplain,and spruce–fir–beech forests with larger N pools.These results imply that differences in potential N transformation between forests are related to the total N pool size in the vegetation and soil.
Mineralization rates also differ significantly between deciduous and coniferous species.Birch soils have higher N transformation rates than soils of spruce and pine (Priha and Smolander 1999),and much higher net N mineralization than in a pine plot (Smolander and Kitunen 2002).In studies of the relationship between N cycles and various types of vegetation,areas with different vegetation types generally exhibit vary considerably in their C:N ratios and N concentrations in the forest floor and soil (Garten 2004;Ross et al.2004).Other studies have shown differences not only between deciduous and coniferous species but even among coniferous species (Fernandez et al.2000;Ross et al.2004).
In an evaluation of the soil of four broad-leaved forest communities–alder–maple–hornbeam–beech (Alnus glutinosa–Acer velutinum–Carpinus betulus–Fagus orientalis),maple–hornbeam–beech,hornbeam–beech,and pure beech–in the Caspian-Hyrkania ecoregion of Iran,the abundance of beech trees in pure beech and other mixed broadleaf forests affects the nutrient cycle through litter quality,turnover time,and the soil fertility in beech forests has increased as a result of incorporating broadleaf species(Haghverdi and Kooch 2019).According to Guckland et al.(2009),acidification levels and fertility of surface soil vary depending on the abundance of beech and tree species and the amount of nutrient cycling.In addition,in a study of the effects of tree cover on N mineralization throughout the development of a natural old-growth Norway spruce(P.abies) forest in the temperate belt,Bade et al.(2015)found that the more open stands at the decay and regeneration stages had lower rates of net N mineralization (and ammonification) than in the closed stands of the optimal and overmature stages.
In our study,the secondary compound concentrations were clearly varied among the litter from the three tree communities (Table 4).Total phenolic concentrations in litter for FO,AB,and PN varied from 53.2 mg/L to 288.2 mg/L and were five times higher in theP.nigralitter than in theA.bornmuellerianaandF.orientalislitter.Hydrolyzed tannic acids in the litter ranged from 0.553 ± 0.2 mg/g to 1.833 ± 0.4 mg/g for the three communities and was quite low inA.bornmuellerianaandF.orientaliscommunities compared toP.nigra.In fact,communities ofPinus nigrahad the highest concentrations of tannic acid and total phenolic compounds.Total phenolic concentrations in the litter had positive (r=0.774,α<0.05) and negative (r=–0.850,α<0.05) correlations with annual net NH4+-N yield and annual net NO3-–N yield,respectively,in the top layer of soil (0–5-cm).Tannic acid was not significantly correlated with soil NH4+-N yield (r=0.539,α>0.05),but was negatively correlated with soil NO3-–N yield (r=–0.764,α<0.05) (Table 6).
Plants are the primary source of phenolics in the soil(Swift et al.1979),and the tree species influences the composition and concentration of soil phenolic compounds.When comparingP.nigratoF.orientalisandA.bornmuellerianacommunities,total phenolics,and tannic acid have a different effect on N mineralization because of their structural differences.Higher yields of ammonium in theP.nigracommunity indicate that the high phenolic compounds in the litter have a positive effect on ammonification.This finding is consistent with the findings of Kanerva et al.(2008),who discovered that pine needles contained more total phenolic compounds than birch leaves.But,their concentrations are very similar.However,in comparison to birch leaves or pine needles,spruce needles had a significantly higher total phenolic content.In our study,net NO3––N yield was negatively correlated with phenolic compounds and tannins concentration for pure forest communities.Low rates of net N mineralization may be associated with higher concentrations of phenolic compounds and tannins in pine litter,consistent with the hypothesis that N mineralization may be inhibited by high concentrations of litter tannins and polyphenols(Schimel and Bennett 2004).The level of condensed tannins and plant decomposition rate were discovered to be strongly positively correlated in several plant species (Valachovic et al.2004).Talbot and Finzi (2008) reported that a decline in net N mineralization in the presence of low tannin levels is due to greater microbial immobilization and that the decline in mineralization when tannin levels are high is due to the formation of tannin–protein complexes.In contrast to our work,Kanerva et al.(2008) showed that there is no linear correlation between condensed tannins or total phenolic compounds and net N mineralization within the humus layer using information from various birch and coniferous stands.Our results do not agree with those of Norris et al.(2011),who investigated condensed tannins in six various species of plants,that tannins had no significant and noncontradictory impacts on soil C and N mineralization rates.
Several reports indicate that adding condensed tannins reduces N mineralization in litter and in soil (Schimel et al.1996;Fierer et al.2001;Kraus 2002;Schweitzer et al.2004;Kanerva et al.2006;Kraal et al.2009;Norris et al.2011;Zong et al.2018).Our results support these previous findings.Although some studies suggest that phenolic compounds inhibit nitrification (Kraal et al.2009),others do not (Fierer et al.2001;DeLuca et al.2002).
In the McCarty and Bremner study (1986),the addition of five different tannins to soils up to 250 μg g-1concentrations with ammonium sulfate did not affect nitrification.De Boer and Kester (1996) suggested that dwarf shrubs with considerably high polyphenolic content had no significant control over nitrification.Likewise,studies by DeLuca et al.(2002)found no correlation between nitrification rates and total sorbed polyphenolic compounds.However,polyphenols or condensed tannins had an inhibitory effect on nitrification in laboratory experiments.For example,Baldwin et al.(1983)found that purified condensed tannins inhibited nitrification.A study with several plant extracts containing condensed tannins showed a slight effect on nitrification but a decline in net N mineralization (Nierop et al.2006).In this study,the main trend was similar in the soil of all communities,tannins and total polyphenols in forest litter inhibited soil nitrification.But there is also the possibility that the soil is not affected by additional tannins as it is by the soil’s natural tannins.It is worth noting that the species of ground vegetation and the dominant trees affect phenolic composition and concentration in the soil.
Conclusions
Based on our results,soil moisture largely controls seasonal fluctuations in nitrification and net N mineralization.In forest ecosystems,tannins and total phenolics appear to be key regulators of N transformation.Different soil N transformations may be explained by secondary compound differences that are specific to different trees.There is a need to better understand how other secondary compounds in soils and significant communities of the eastern Mediterranean affect N mineralization.Consequently,our findings agree with the concept that tree species effectively control the N cycle (Lovett et al.2004;Olsson et al.2012),in particular nitrification (Zeller et al.2007).
AcknowledgementsThis study was a part of the PhD of F.S.Sakar(advisor G.Güleryüz).
Open AccessThis article is licensed under a Creative Commons Attribution 4.0 International License,which permits use,sharing,adaptation,distribution and reproduction in any medium or format,as long as you give appropriate credit to the original author(s) and the source,provide a link to the Creative Commons licence,and indicate if changes were made.The images or other third party material in this article are included in the article’s Creative Commons licence,unless indicated otherwise in a credit line to the material.If material is not included in the article’s Creative Commons licence and your intended use is not permitted by statutory regulation or exceeds the permitted use,you will need to obtain permission directly from the copyright holder.To view a copy of this licence,visit http://creativecommons.org/licenses/by/4.0/.
杂志排行
Journal of Forestry Research的其它文章
- Impact of cattle density on the structure and natural regeneration of a turkey oak stand on an agrosilvopastoral farm in central Italy
- Annual growth of Fagus orientalis is limited by spring drought conditions in Iran’s Golestan Province
- Climate‑change habitat shifts for the vulnerable endemic oak species (Quercus arkansana Sarg.)
- Plant growth and metabolism of exotic and native Crotalaria species for mine land rehabilitation in the Amazon
- Peat properties of a tropical forest reserve adjacent to a fire-break canal
- Climate-growth relationships of Pinus tabuliformis along an altitudinal gradient on Baiyunshan Mountain,Central China