Physiological and psychological responses to tended plant communities with varying color characteristics
2024-01-26SiyuanZhengYanzhenZhouHaiyanQu
Siyuan Zheng · Yanzhen Zhou · Haiyan Qu
Abstract Exposure to plants has been reported to promote health and reduce stress,and plant color has direct impacts on physical and mental health.We used images of common types of tended plant communities in Shenyang,China,with combinations of yellow,green,and red foliage,as experimental stimuli.A total of 27 images were used as visual stimuli.We used electroencephalography to measure α wave activity (8–13 Hz) in 40 subjects while they viewed visual stimuli.These data were combined with subjective questionnaire data to analyze the relaxing effect of images of tended plant communities with different color types and proportions on people.The results revealed that,although there were slight differences between the electroencephalography and psychological findings,women were significantly more relaxed than men after viewing the images.Physiological and psychological responses varied with the types and proportions of colors in the tended plant communities: those of foliage with combinations of two or three colors induced stronger responses than images with a single color.Specifically,(1) for one-color plant communities,green or yellow plant communities induced a stronger relaxation effect than red plant communities;(2) for two-color plant communities,the optimal color proportion was 55%+45%,and the green+yellow and green+red color combinations induced a stronger relaxation effect;(3) for three-color plant communities,the relaxation effect was strongest when the color proportion was 55% green+25% yellow+20% red.These data would provide a plant color matching in future plant landscape design,which may be helpful for creating healthy and relaxing environments.
Keywords Plant community · Color type · Color ratio ·Electroencephalography · Subjective questionnaire
Introduction
Vegetation is an important element of the environment and the presence of plants is vital for humans,non-human animals,and ecosystems.Numerous studies have reported that plants can improve the thermal comfort of human habitats (Abdi et al.2020;Chen et al.2021a,b;Narimani et al.2022).Besides,plants adsorb particulate matter from the environment,purify the air (Shi et al.2021),and can be used to detect the CO2concentration of the soil and control ecological balance (Lakkaraju et al.2010).With the rapid development of cities,there has been an increase in the prevalence of negative emotional states,such as stress,in daily life (Peen et al.2010).The impacts of environmental elements,such as plants,on humans and wildlife should receive more attention during urban construction.Athira et al.(2019) reported that humans and insects have different visual sensitivity to plants with different colors.The colors of plants have been reported to directly act on the human senses,producing physical and mental reactions (Berto 2007;Gao and Xin 2006).Several recent studies examined plant color in terms of aesthetic,psychological,and physiological effects on multiple scales,including plant organs(Hůla and Flegr 2016),monomers (Jang et al.2019),and groups (Zhuang et al.2021).Another studies have confirmed that plants with specific colors have unique effects on fatigue(Yao et al.2020),mood (Jonauskaite et al.2018),and emotion (Kexiu et al.2021).
To examine the effects of plant color,questionnaire survey and subjective scale evaluation methods have been widely used in previous studies.For example,Ulrich (1984),Behe et al.(1999),Kaufman and Lohr (2004),and Shibata and Suzuki (2004) used subjective evaluation to confirm that green plants exert a positive impact on the completion of creative tasks,and can improve mood and learning efficiency.Saito (1996) reported that the use of plants with yellow flowers in interior decoration can help people maintain focus.Sinkkonen (2006),Lev-Yadun and Holopainen(2009),and Wang et al.(2020) studied color preferences for autumn foliage in terms of both the plant leaf and crown,and revealed that brightly colored foliage was preferred for autumn plants.Hůla and Flegr (2016) investigated aesthetic preferences for plant color and shape among members of the public using a subjective rating method,revealing that blue flowers and symmetrical flower shapes were rated most positively.Tomitaka et al.(2021) conducted a questionnaire survey of plant communities in natural and urban parks.The results confirmed that flower color diversity was particularly important to visitors’ experiences of the park.
Subjective evaluation is a convenient and quick experimental method.However,cross evaluation using biological measurements and subjective evaluations can more comprehensively and accurately demonstrate the effects of plant color on humans.Common physiological measurement methods include brain electroencephalography (EEG),electrocardiography (ECG),galvanic skin response (GSR),blood pressure (BP),and fingertip pulse (FP).In one previous study,Jacobs and Hustmyer (1974) studied the effects of red,yellow,blue,and green stimuli using GSR and found that red had the greatest arousal to neural stimuli,followed by green and yellow,with blue having the lowest arousal.Serra et al.(2021) studied the architectural color preferences of students of different genders and found that male students preferred orange and red buildings,whereas female students preferred pink,green,or blue buildings.Brown buildings were found to be the least popular among students regardless of gender.Using subjective ratings in combination with eyetracking,Dupont et al.(2015;2016) studied students’ visual processing while viewing landscapes and buildings photographs.In a study of plant-related preferences,Heerwagen and Orians (1993) reported that petal shapes that were symmetrical on both sides were rated more positively.Jang et al.(2014) measured EEG in combination with a semantic questionnaire to investigate preferences for green,red,and yellow monochromatic plants,but did not systematically examine combinations of multiple plant colors.
The sampling rate of EEG can reach 2084 Hz,which represents a very high level of temporal sensitivity,and can reflect neural activity on the scale of milliseconds (Tucker et al.1999).EEG is used in many fields,including psychology,physiology,medicine,neuroscience,artificial intelligence,environmental science,health,sports,industrial applications,and military applications to examine a variety of neural activities,including cognitive processes.Different physiological and psychological conditions can stimulate neural oscillations at specific frequencies (Stevens and Zabelina 2019).In general,the frequency of human brain oscillations produced by neural activities ranges from 1 to 30 Hz,and can be divided into four types: δ,θ,α,and β (Lutz et al.2008;Galadí et al.2020) (Table 1).Kiloh(1982),Kamei et al.(2000),Stinson and Arthur (2013),and Bazanova and Vernon (2014) used α waves as an index in studies of human physical and mental state,revealing that α waves are related to mental relaxation as well as physical and mental calmness.
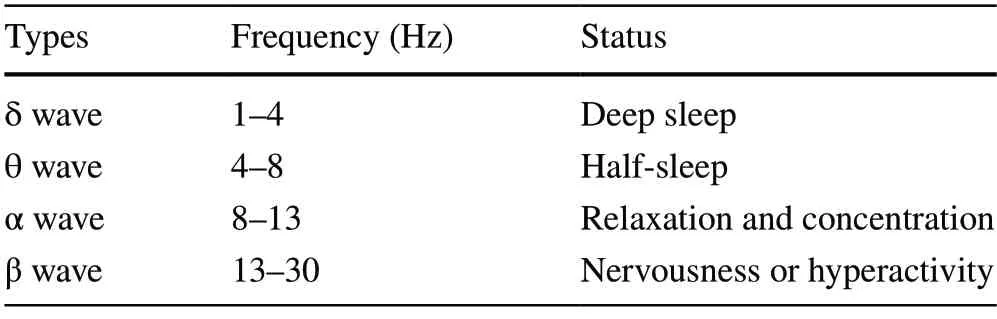
Table 1 Brain activity types and corresponding states
EEG has been used to examine differences in the effects of different plant colors and species on neural activity.For example,Jang et al.(2014) used EEG to monitor the effects of five different plant colors (green radish;white,yellow,pink,and red longevity flowers) on α and β wave activity in the brain.The results indicated that green plants elicited more α wave activity and less β wave activity compared with plants of other colors (Jang et al.2014).Fan and Niu (2014) further explored the effects of different flower colors on α and β waves in different study populations by combining subjective evaluation with EEG.The results indicated that pink,purple,and yellow flowers promoted the generation of α waves,which was associated with increased relaxation and concentration in all groups.Jap et al.(2009) conducted a driving fatigue test using EEG and found that α rhythms were often present when the driver was in a relaxed state and that the presence of β rhythms represented an increase in driver alertness.Additionally,the calculation of α/β can be used to evaluate the mental state of the driver.Because α waves are frequently used to study relaxation in humans (Kiloh 1982;Kamei et al.2000;Stinson and Arthur 2013;Bazanova and Vernon 2014),we selected α wave power (8–13 Hz) as an indicator of EEG measurement in the present study.
Previous studies that used subjective questionnaires and EEG methods to study the effects of plants on humans mostly examined the impact of a single plant color or a specific plant color system.However,plants appear in nature as communities comprising a wide variety of colors.In a study by Thorpert et al.(2018),red,yellow,and blue cardboards were used with a background screen of green vegetation to study the effects of plants on human perception.However,few studies have explored the effects of colors in tended plant communities,particularly in terms of the physiological effects of different color combinations,proportions,and positions.Therefore,we examined the effects of the colors of common plants in nature on physical and mental health using common types of plant community combinations in Shenyang as research stimuli.In accord with previous studies,we examined the effects of various numbers of colors,color proportions,and color position distributions when one,two,and three foliage colors were present in tended plant communities.We used a subjective questionnaire and α wave data as measures of human physiology and psychology.Our hypotheses were as follows: (1) there would be a significant correlation between subjective scale evaluations and α wave data;(2) plant communities with different color types and proportions would elicit different physiological and psychological effects.Our findings may be useful for extending current understandings of plant color as a visual attribute from a human perspective and providing direction regarding visual features for future approaches to conservation and biodiversity promotion.
Materials and methods
Stimuli
Previous studies examined the influence of plants on human participants using real plants or images of plants as visual stimuli (Ulrich et al.1991;Hull and Stewart 1992;Chang 2004;Chang and Chen 2005;Kreibig 2010).The content of the visual stimuli used in the present experiment was mainly based on common types of tended plant community in Shenyang.A Canon EOS 200D SLR camera was used to take outdoor photographs of plants between 10:00 and 14:00 while the weather was clear.The main color temperature of the plant leaves was kept relatively stable (Lee et al.2002).During shooting,we took photographs from a height of 1.5 m with a depth of field that was consistent with an average viewing angle.The photographs were captured on the basis of the expectation that an observer would be able to view the entire panorama from 1.5 m away (Wang et al.2018).The aspect ratio of each photograph was 3/2 or 2/3.The photography was conducted in June and lasted less than 2 weeks to avoid major seasonal changes in plant leaf color.A total of 65 photographs of tended plant communities were captured.
The colors of plant leaves can vary according to the maturity of the leaves,differences in light exposure,varying soil conditions,and other factors.Therefore,when extracting the plant colors,the color that occurred over more than 50% of the total leaf area was considered to be the representative color of the entire plant (Wang et al.2018).The different plant colors recorded in this survey are shown in Table 2.

Table 2 Plant colors and RGB values
Fifteen people engaged in landscape design rated the beauty of the photographs on a scale from 1 to 5,and the photograph with the highest score was selected as the experimental stimulus (Fig.1).The photograph showed a deciduous tree+evergreen tree+shrub (ground cover)+lawn multi-layer plant community.In accord with landscape characteristics and previous research (Wang et al.2007;Yao et al.2012;Liu et al.2014;Ren and Kang 2015),in a plant community that includes common evergreen trees+shrubs+ground cover,the trees typically constitute the background of the community,and the lawn serves as the foreground.Visual attention is mainly distributed in the middle ground,which includes the middle and lower layer of the community (Wang et al.2018).In this experiment,the objects to which we applied color treatment were the plants in the middle of the landscape,namely,a hedgerow positioned lower in the image,and ball-shaped bushes positioned in the upper portion of the image.The areas of the different plants (out of a total of 100% for all plants) were 10%,10%,20%,and 15% for the ball-shaped bushes,and 10% and 45%,for the hedgerow,as shown in Fig.1.We used Photoshop CS6 software to process the colors of the plants in the middle of the scene to construct combinations of different color types,ratios,and positions.We generated a total of 27 images for use as experimental stimuli.
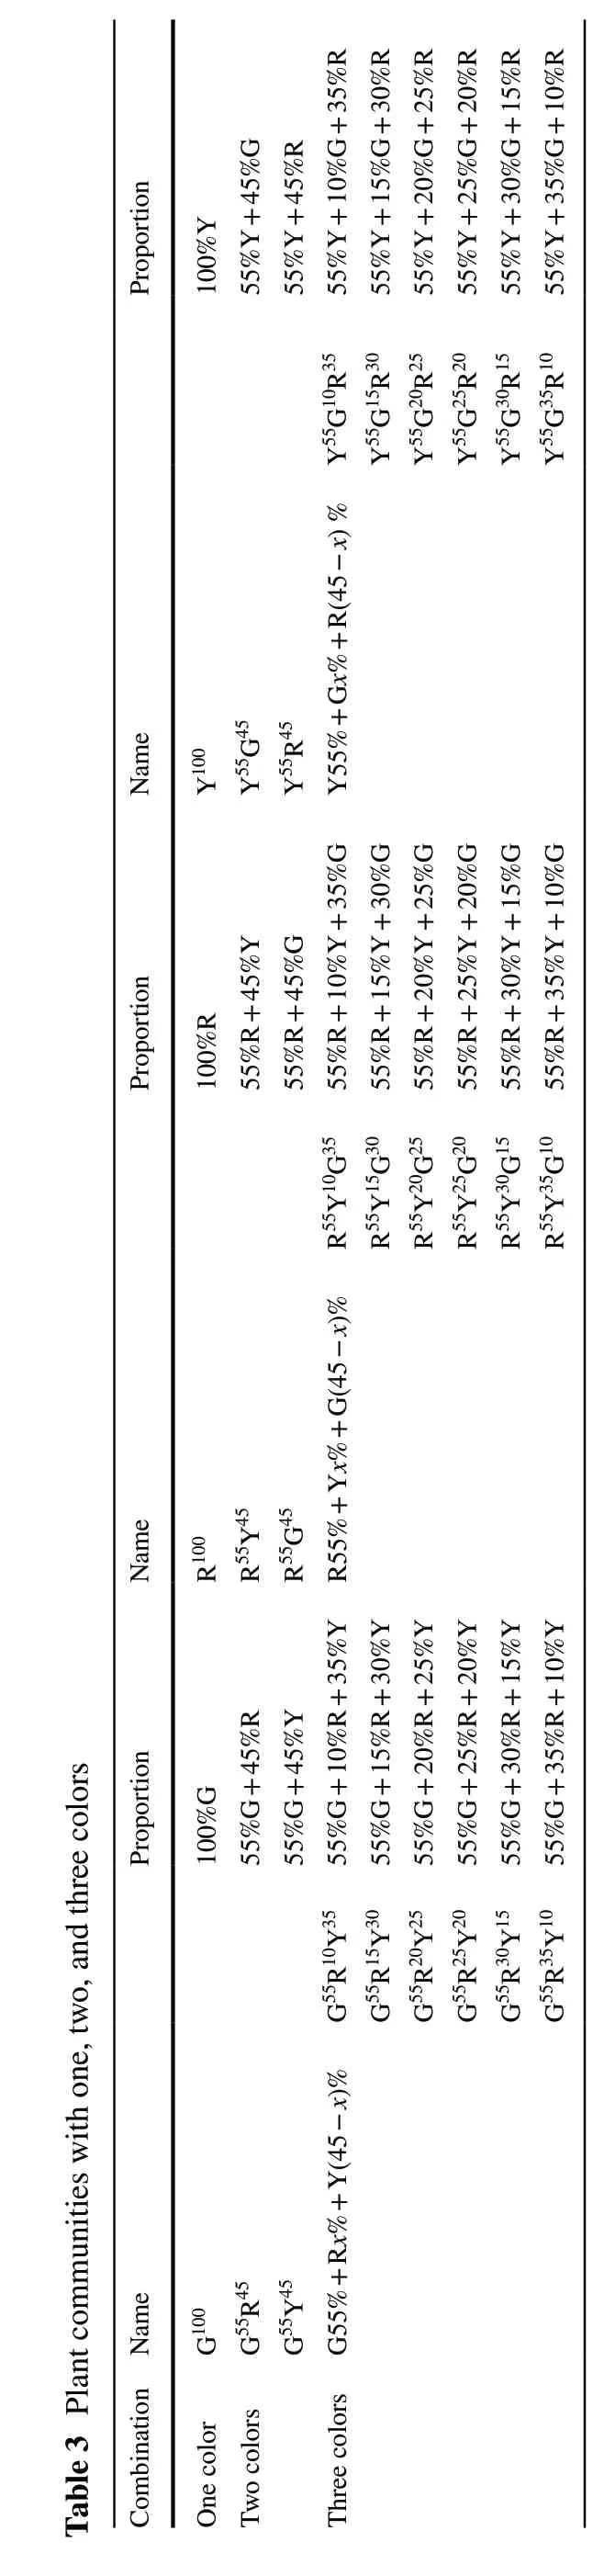
Table 3 shows the combination form of plant community colors and proportions in all stimulus materials.“One color”shows the 3 stimuli in which the plants in the middle of the scene were all a single color.The color ratios of the images were either 100% red,100% yellow,or 100% green.“Two colors”shows the 6 stimuli in which there were combinations of two colors.When the lower layer of the hedge was green,red,or yellow,the color of the spherical shaped bushes was changed so that the color proportion was 55%+45%.“Three colors”shows the 18 stimuli that contained combinations of three colors.The lower layer of the hedge was fixed to green,red,or yellow,and the color of the three ball-shaped bushes in the upper part of the image were changed.The red,green,and yellow combinations had a color ratio of 55% (lower hedgerows) andx%,(45 -x)%(upper ball-shaped bushes),wherexwas assigned a value of 10,15,20,and two-by-two combinations of 25,30,or 35,respectively.The stimulus material was modified as follows using this approach.
The lower layer of the hedges was fixed to green,accounting for 55% of the area of the manipulated part of the image,and the colors of the other bushes were individually changed to red or yellow.By changing the colors of the spherical shrubs,the proportion of red in the manipulated part of the image was 10%,15%,20%,25%,30%,and 35%,while that of yellow was 35%,30%,25%,20%,15%,and 10%.This method was used to produce six stimulation images.
The lower layer of the hedges was fixed to red,which accounted for 55% of the area of the manipulated part of the image,and the colors of the other bushes were individually changed to green or yellow.By changing the colors of the spherical shrubs,the proportions of green in the manipulated part of the image were 10%,15%,20%,25%,30%,and 35%,whereas the proportions of yellow were 35%,30%,25%,20%,15%,and 10%.This produced six stimulation images.
The lower layer of the hedges was fixed to yellow,accounting for 55% of the area of the manipulated part of the image,and the colors of the other bushes were changed to green and red individually.By changing the colors of the spherical shrubs,the proportions of green in the manipulated parts of the image were 10%,15%,20%,25%,30%,and 35%,while the proportions of red were 35%,30%,25%,20%,15%,and 10%.This method was used to produce six stimulation images.
Study periods and settings
The experiment was conducted at the Landscape Architecture Laboratory from 9:00 to 11:00 and 15:00 to 16:30 every day in November and December 2019.The room was 5-m long,3.8-m wide,and 3-m high.The walls were pure white,and the interior was lit with incandescent lamps (65 lux).During the test,the indoor temperature and relative humidity were maintained to ensure somatosensory comfort.We also attempted to maintain consistency regarding external factors,such as sound,in each experimental trial.Furthermore,throughout the experimental process,we attempted to ensure that there was no electromagnetic interference.
Participants
We recruited a total of 40 undergraduates and postgraduates (20 men and 20 women),with an average age of 21.83 ± 2.72.Because of the high efficiency and low cost of accessing university students,this sampling approach is widely used by researchers in studies using experience evaluation (Zhao et al.2018).Before the experiment,participants were required to have no mental illness,physical illness,or history of drug abuse,and all were right-handed.Subjects were required to wash their hair before the experiment to facilitate EEG measurement,and to avoid drinking alcohol,smoking,or drinking caffeinated beverages prior to the experiment.
Procedure
Each participant was asked to sit on a comfortable chair positioned 0.6 m away from the computer screen,and to adjust their sitting posture so that their eyes were at the same level as the screen.All other equipment was positioned 1 m behind the subject,and interference from other instruments was minimized.Subjects were informed about the experimental purpose and process.Participants provided personal information via an informed consent form,which they signed to declare that they voluntarily participated in the experiment.Participants were told that they could withdraw from the experiment at any time if they were uncomfortable.We ensured that personal physiological and psychological data were kept strictly confidential.This study was approved by the ethical committee of the School of Architecture and Urban Planning,Shenyang Jianzhu University,China.
The experimenter explained and demonstrated the experimental procedures and the use of the instruments to the subjects.The experimenter then applied EEG electrode gel and fitted the participants for EEG signal acquisition.Classical music (Pachelbel’s “Canon and Gigue in D”) was played to help participants relax and adapt to the experimental environment as quickly as possible.We used the Active Two biopotential measurement and analysis system (BioSemi,Netherlands) to measure EEG.The EEG signals were detected by electrodes in an electrode cap,which made contact with the scalp via EEG electrode gel (Fig.2).There were 128 acquisition channels,and the data were processed using the whole brain average as a reference to avoid imbalances caused by incorrectly functioning electrodes.EEG electrodes were placed in accordance with international standard 10–20 system.The sampling frequency of this system was 2048 Hz,which is more accurate than that of conventional physiological monitoring equipment (typically 250,500 or 1000 Hz).The collected EEG signals were amplified by an AC-BOX and transmitted to the recording computer for storage and analysis.

Fig.2 EEG cap and electrode placement
The presentation of visual stimuli during the experiment was controlled using E-prime software (Psychology Software Tools,USA),which is widely used for cognitive experiments involving EEG (Wang 2019).In each trial,a description of the task first appeared on the screen.When the participant was ready,they were expected to press the Enter button,at which point the experiment officially began.The experimental trials were divided into three sections,with 18 images in each (nine plant images alternating with nine images of a blank space with a “+”symbol in the center of the screen).The stimuli were displayed for 3 s (Atkinson and Campos 2016),and the images with the “+”were displayed for 1 s (Robins and Hollands 2017).The “+”served to help the subjects focus their attention and calibrate their visual focus.After viewing all of the stimuli,the subjects were asked to complete a subjective questionnaire.To overcome the effects of experimental order,each set of photographs of plant colors was presented in a random configuration.The total duration of the experiment was approximately 40 min (the detailed experimental process is shown in Fig.3).

Fig.3 Flow chart of the experimental protocol
Data analysis
Data processing of α wave activity and subjective evaluation scores
The data processing was conducted in two parts for EEG and subjective questionnaire data analysis.In accord with the different regions of the brain,α wave activity was extracted from the collected EEG signals of the occipital lobe related to visual processing.Prior to this procedure,data preprocessing using MATLAB was used to remove artifacts,including those caused by eye movements,power frequency interference,and electromagnetic interference in the experimental environment.Data preprocessing operations included BioSemi electrode positioning,removal of ineffective electrodes according to the channel range,filtering (removing 0.5–30 Hz band-pass filter,then removing 48–52 Hz interference with a notch filter),reducing the sampling rate,re-referencing,and removing artifacts,and finally extracting the independent segmentation of each marker task.The preprocessed data were based on MATLAB platform to create a study.Data were imported in batches for intra-group analysis,and α wave power was calculated.
The subjective questionnaire was designed on the basis of a Likert scale (Barone 2005;Li 2013),and was used to measure subjects’ emotional state.The questionnaire contained positive attitude statements (“comfortable”and“relaxed”) and participants were asked to indicate whether they very much agreed,agreed,were uncertain,disagreed,or very much disagreed with the statements by providing a score of 5,4,3,2,or 1 points,respectively,for each item.The questionnaire was designed on the basis of the tended plant community’s color composition (one,two,and three colors).Taking different color combinations and different color proportions as units,the scores of 40 questionnaires were calculated as mean and standard deviation for further analysis.
Statistical analysis
Statistical analysis was completed using IBM SPSS V21.0.We used one-way ANOVA to examine the physiological and psychological differences caused by the different stimulus images.If the dataset did not exhibit homogeneity of variance,we used the Kruskal–Wallis test to further compare the physiological and psychological differences caused by different visual stimuli.We used correlation analysis to explore the correlations between the questionnaire data and the α wave data.
All charts in this experiment were constructed using MATLAB,SPSS v21.0,Origin 8.5 (Origin Lab,Corp.,Northampton,MA,USA),or Photoshop cs6 (Adobe,Inc.,Mountain View,CA,USA).
Results and analysis
Correlation between subjective evaluation and physiological data
As shown in Table 4,the subjective questionnaire scores showed a significant (p<0.05) positive relationship with physiological data.Therefore,we conducted further analysis of 27 images of tended plant communities with different color combinations and proportions using subjective evaluation and EEG α activity physiological data.
Brain activity and subjective evaluation scores of color combinations by gender
Plant communities with one,two,and three colors
Table 5 showed the α wave power and subjective ratings of men and women when viewing the flora,for different color combinations and across all stimuli.Female participants exhibited higher scores after viewing different color combinations of flora compared with male participants,and exhibited differences in specific characteristics.The α power was significantly higher in female participants compared with male participants for all three color combinations,and in the overall analysis (p<0.0001;very significant difference).Specifically,women produced higher α wave power after viewing plants with two and three color combinations compared with monochromatic plants.Men exhibited higher α wave power when viewing monochromatic and trichromatic plant combinations compared with two-color plant combinations.We obtained similar results in the analysis of subjective ratings.Female participants reported higher ratings than the ratings given by men when viewing plants with different color combinations,and significant gender differences emerged when viewing tricolored plant compositions(p<0.01;very significant difference).This finding indicates that women were more relaxed than men after viewing the flora images containing different color combinations of green,yellow and red.

Table 5 Gender-related differences in α wave power and subjective evaluation scores when observing plant communities containing one
Single‑color plant communities
We conducted further detailed analyses of the color ratio of different images.Table 6 shows the results for plant images containing one color,for which the color ratio was 100%.We observed a significant difference in α wave power between men and women when viewing the plant stimuli with one color (p<0.0001).Moreover,after viewing three images of plant communities with one color,α wave power was significantly greater in women compared with men.Additionally,subjective ratings were higher in females compared with males,and significant differences emerged when viewing red plants (p<0.05).This finding suggests that women were more relaxed than men.

Table 6 Gender-related differences in α wave power and subjective evaluation scores when viewing plant communities containing one color
Plant communities containing two colors
Table 7 shows the results for plant communities containing two colors (color ratio of 55%+45%).We found a very significant difference in α wave power between men and women when viewing plant communities containing two colors(p<0.0001).Furthermore,after viewing six images of plant communities containing two colors,the α wave power in women was significantly stronger than that in men.This trend was also found in the analysis of subjective ratings,in which women generally gave higher ratings than men,although no significant differences were observed (p>0.05).This finding indicates that women tended to be more relaxed than the men when viewing images of plant communities.

Table 7 Gender-related differences in α waves and subjective evaluation scores when viewing plant communities containing two colors
Plant communities with three colors
Table 8 shows the results for plant communities with three colors,in which the proportion of the three colors was G55%+Rx%+Y(45 -x)%,R55%+Yx%+G(45 -x)%,or Y55%+Gx%+R(45 -x)% (according to the fixed color of the lower hedge).When the color ratios and positions were changed,we observed significant differences in the power values of α waves between men and women after viewing 18 images (p<0.05).Specifically,the α wave power was significantly higher in women compared with men,which indicates that the women felt more relaxed than men after viewing the stimuli.Subjective ratings were generally higher for women compared with men,and a significant difference was seen in this combination of Y55G10R35(p<0.05).This finding also suggests that women were more relaxed after viewing different proportions of the tricolor plant combination compared with men.
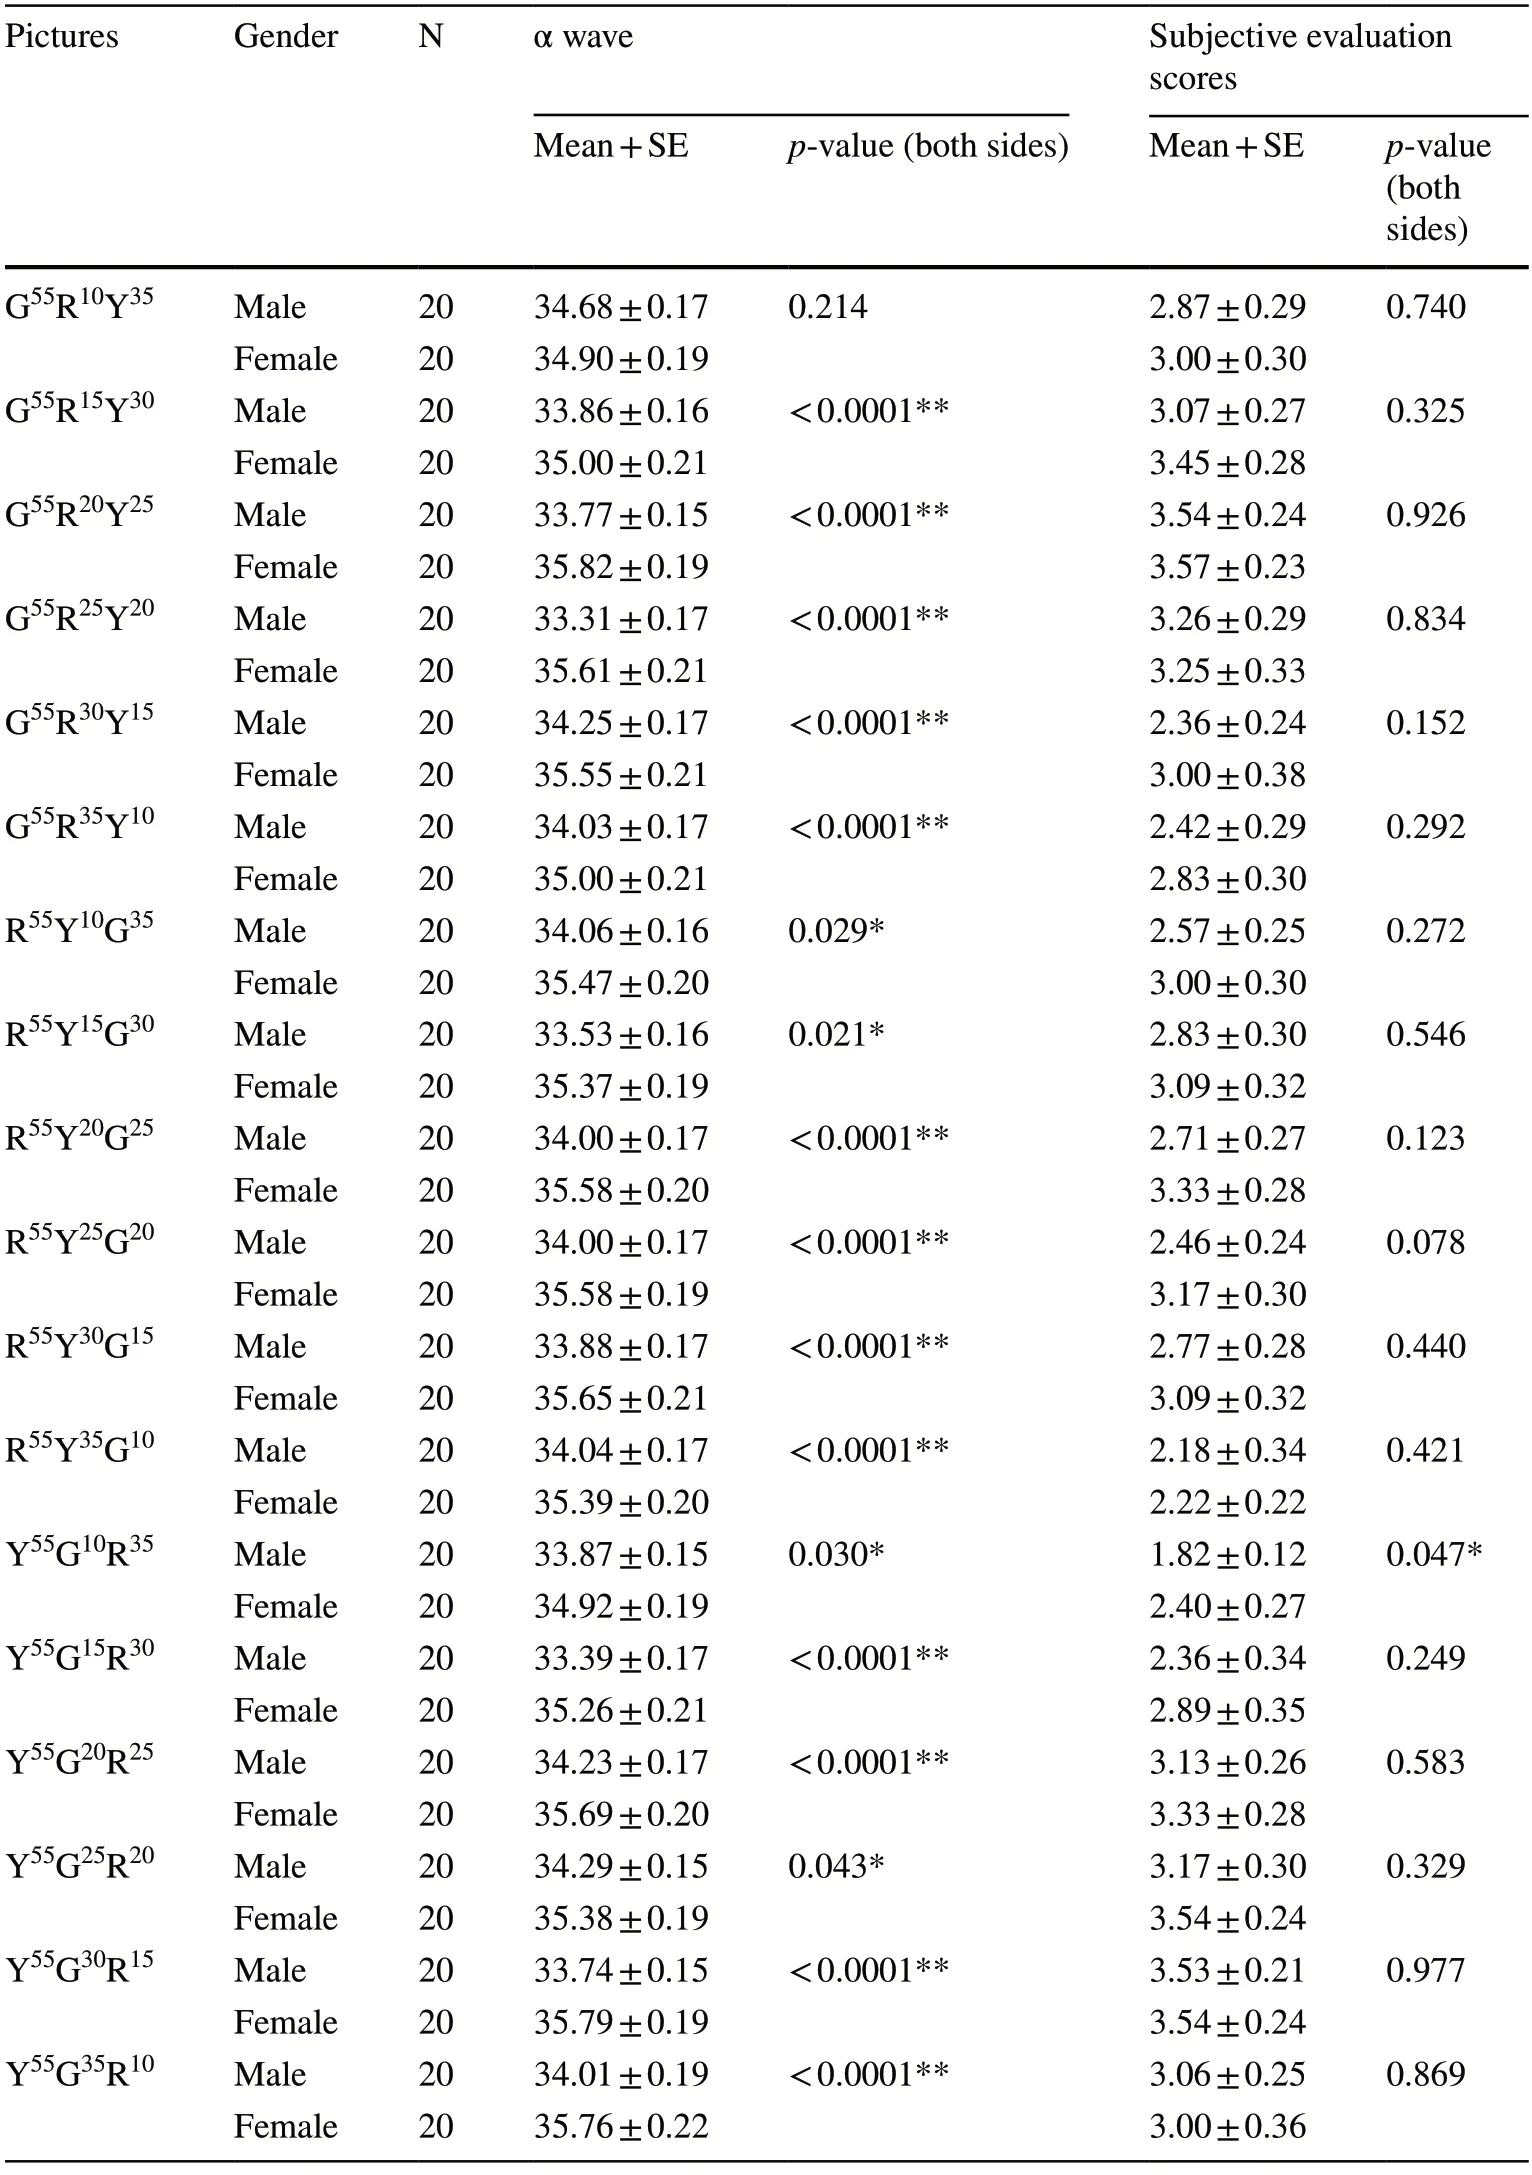
Table 8 Gender-related differences in α waves and subjective evaluation scores when viewing plant communities with three colors
Subjective evaluation of different color combinations
Plant communities with one,two,and three colors
With the number of colors as the independent variable,we analyzed and compared the subjective evaluation scores of the plant communities with one,two,and three colors(Fig.4),and found that the scores for the plant communities containing two colors (3.28 ± 0.06) were highest,and were significantly different to those for plant communities containing one (2.75 ± 0.14) and three colors (2.97 ± 0.05)(F=7.02,p<0.01).The scores for single-color plant communities were the lowest.Thus,the number of colors of plant communities affected the relaxation effect when subjects observed images,and the strongest relaxation effect was found for plant communities containing two colors.

Fig.4 Subjective evaluation scores when observing one-,two-,and three-color plant communities.Note Subjective evaluation scores marked with different letters were shows significant difference between color characteristic (p <0.05)
Single‑color plant community
The objects of the study (i.e.,the bushes in the middle section of the photograph) were processed so that they only contained one color.We constructed three stimulus images:one containing red foliage,one containing yellow foliage,and one containing green foliage.The subjective evaluation results are shown in Fig.5.There were significant differences in subjective evaluations between each of the plant communities containing single colors (F=18.03,p<0.05).Among them,the relaxation experience scores were highest for green plant communities (3.58 ± 0.16),and lowest for red plant communities (1.89 ± 0.19).

Fig.5 Subjective evaluation scores when viewing plant communities containing one color.Note Subjective evaluation scores marked with different letters were shows significant difference between color characteristic (p <0.05)
Plant communities containing two colors
Regarding subjective evaluation of plant communities containing two colors,we analyzed and compared six pictures of green,red,and yellow plant communities.As shown in Fig.6,the plant community score was highest for G55Y45(3.71 ± 0.12),and there was no significant difference compared with R55G45(3.33 ± 0.16),Y55G45(3.48 ± 0.15),and G55R45(3.38 ± 0.16) (p>0.05),whereas the subjective scores of Y55R45(2.86 ± 0.16) and R55Y45(2.90 ± 0.12)were significantly lower (p<0.05).The results revealed that the relaxation effect was strongest for the green+yellow combination of plant communities,and weakest for the yellow+red combination.In addition,when the plant community contained two-color combinations of green+red or green+yellow,the relaxation effect increased with the proportion of green.

Fig.6 Subjective evaluation scores when viewing plant communities containing two colors.Note Subjective evaluation scores marked with different letters were shows significant difference between color characteristic (p <0.05)
Plant communities containing three colors
The results of the subjective evaluation when changing the proportions of the three colors are shown in Fig.7.G55R20Y25(3.64 ± 0.15) had the highest subjective score,followed by Y55G25R20(3.52 ± 0.16).And,they were significantly different from the subjective evaluation scores of G55R30Y15(2.58 ± 0.23),G55R35Y10(2.56 ± 0.18),R55Y10G35(2.74 ± 0.19),R55Y30G15(2.88 ± 0.20),R55Y35G10(2.24 ± 0.17),Y55G10R35(2.14 ± 0.14)and Y55G15R30(2.62 ± 0.22) (p<0.05).The scores of R55Y35G10and Y55G10R35were the lowest.Thus,the results indicated that the relaxation effect was strongest in the three-color plant community with 75% of green+yellow,and the optimal relaxation effect was observed when the green proportion was 55%.When the lower shrub was red,the relaxation effect was relatively strong if the proportions of yellow and green were balanced,or if the proportion of green was higher.Besides,when yellow and red accounted for 90% of the foliage in the image,the relaxation effect was weakest.

Fig.7 Subjective evaluation score when viewing plant communities with three color combinations.Note Subjective evaluation scores marked with different letters were shows significant difference between color characteristic (p <0.05)

Fig.8 α wave power when viewing plant communities with one,two,and three colors.Note α wave power marked with different letters were shown significant difference between each color characteristic (p <0.05)
Effects of different color combinations on brain activity
Plant communities containing one,two,and three colors
The α wave power of plant communities containing different numbers of colors (one,two,and three colors) was analyzed as a whole.Figure 8 shows that single-color (34.45 ± 0.13)plant communities had the lowest α wave power followed by two-color (34.52 ± 0.11) plant communities.The highest α wave power was observed for three-color plant communities(34.69 ± 0.05).Overall,there was no significant difference between the three types of images.Therefore,to understand the effects of different color combinations of plant communities on α wave power,it was necessary to further compare and analyze the α wave power of 27 images with different color proportions.
Single color plant community
The EEG results are shown in Fig.9.We found significant differences in EEG α waves when participants viewed different colored stimuli (F=3.74,p<0.05).The strongest α wave activity occurred when viewing the green stimulus image G100(34.65 ± 0.12),and the weakest occurred when viewing the red stimulation image R100(34.20 ± 0.12).There were no significant differences in α wave activity between images containing green and yellow Y100(34.57 ± 0.13).This indicates that green and yellow plant communities exerted stronger relaxation effects compared with red plant communities.
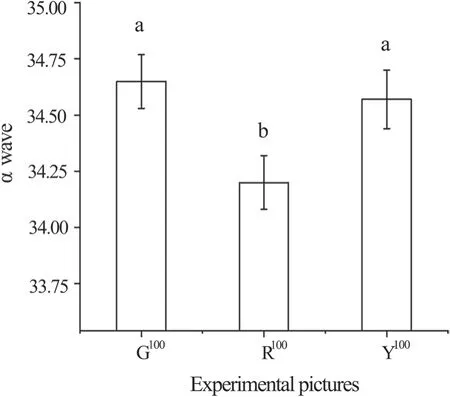
Fig.9 α wave power when viewing plant communities containing one color.Note α wave power marked with different letters were shown significant difference between each color characteristic(p <0.05)
Plant communities containing two colors
Analysis of the EEG data generated while viewing the six stimulus images (plant communities containing two colors)revealed significant differences in α wave power (F=12.59,p<0.0001) (shown in Fig.10).The strongest α wave activity was elicited by green-yellow G55Y45(34.83 ± 0.14)images,although this was not significantly different from yellow-green Y55G45(34.80 ± 0.13) images or green–red G55R45(34.57 ± 0.12) images (p>0.05).The weakest α wave activity was elicited by red-yellow R55Y45(33.83 ± 0.13)images,although this was not significantly different from yellow–red Y55R45(33.85 ± 0.12) images (p>0.05).Intermediate α wave power was elicited by the green–red R55G45(34.30 ± 0.12) image.In plant communities with two colors,the green+yellow combination and the green+red combination exerted stronger relaxation effects,as indicated by α wave power,compared with the yellow+red combination.Furthermore,the green+yellow combination induced relaxation regardless of the position or proportion of the colors.However,for the combination of green+red,the effects depended on the positions of the colors and the proportional relationships among colors.The data indicated that relaxation was maximal when green foliage was positioned in the foreground of the image,red foliage was located further back,and the proportion of green was relatively high.

Fig.10 α wave power when viewing plant communities containing two colors.Note α wave power marked with different letters were shown significant difference between each color characteristic(p <0.05)

Fig.11 α wave power when viewing plant communities with three color combinations.Note α wave power marked with different letters were shown significant difference between each color characteristic(p <0.05)
Plant communities containing three colors
Figure 11 shows the results of our EEG analysis for the 18 stimulus images (plant communities containing combinations of three colors).The α wave activity induced by the 18 stimulus images was significantly different (F=27.20,p<0.001).The strongest α wave activity was observed for G55R20Y25(34.96 ± 0.13),followed by G55R25Y20(34.90 ± 0.14),Y55G25R20(34.89 ± 0.14),R55Y20G25(34.88 ± 0.15),Y55G20R25(34.87 ± 0.12),and R55Y25G20(34.86 ± 0.13) images,although these were not significantly different (p>0.05).The weakest α wave activity was observed for R55Y30G15(33.03 ± 0.12),R55Y35G10(33.14 ± 0.12),Y55G15R30(33.36 ± 0.12),and Y55G10R35(33.25 ± 0.12) images,with no significant differences (p>0.05).G55R10Y35(34.43 ± 0.13),G55R15Y30(34.40 ± 0.13),Y55G30R15(34.21 ± 0.13),Y55G35R10(34.12 ± 0.12),G55R35Y10(34.05 ± 0.12),G55R30Y15(33.99 ± 0.12),R55Y15G30(33.91 ± 0.12),and R55Y10G35(33.83 ± 0.12) images induced intermediate α wave strength,with no significant differences.
Overall,α wave power was the strongest for plant communities with three colors,and the relaxation effect was strongest with a plant community color configuration ratio of 55%+25%+20%.The plant communities that produced the highest α power were those with green and yellow hedges in the lower layer,and lower proportions of red.The red+yellow and red+green configuration ratio were similar,and the positional relationship was symmetrical,with a balanced color configuration.The plant communities that produced that second-strongest α wave power had an allocation ratio of green+yellow and green+red that was greater than 85% in scenes with three colors.The α wave power was weakest,with the weakest relaxation effect,for plant communities with more than 85% yellow+red.The red and yellow plants were located in the lower layer and the allocation ratio for these colors was largest.The allocation proportion of the spherical bushes in terms of yellow+green or red+green in the upper layer was also relatively unbalanced.When the three colors were combined in one plant community,the image became more complex in that there was not only a proportional relationship between the colors but also a positional distribution and equilibrium relationship.
Images with one,two,and three colors
A comprehensive analysis of the EEG data of 27 stimulus images was performed,comparing the EEG data of images with one,two,and three colors.The results are shown in Fig.12.There were significant differences in α wave power among the 27 stimulus images (F=21.38,p<0.0001).The strongest α wave power was induced by images with three colors G55R20Y25(34.96 ± 0.13),followed by G55R25Y20(34.90 ± 0.14),Y55G25R20(34.89 ± 0.14),Y55G20R25(34.87 ± 0.12),R55Y20G25(34.88 ± 0.15),and R55Y25G20(34.86 ± 0.13),and images with two colors,including greenyellow G55Y45(34.83 ± 0.14) and yellow-green Y55G45(34.80 ± 0.13).The weakest α wave power was elicited by image R55Y30G15(33.03 ± 0.12),which was not significantly different (p>0 05) from R55Y35G10(33.14 ± 0.12),Y55G15R30(33.36 ± 0.12),and Y55G10R35(33.25 ± 0.12)images.These data indicate that plant communities with two or three different colors induced a stronger relaxation effect compared with those with one color.Among the 2–3 types of color combinations,the relaxation effect was strongest when the color allocation ratio was 55%+25%+20%,which represents an even color distribution among the different plants in relation to area.The relaxation effect was weakest when the color allocation of yellow+red exceeded 85%.
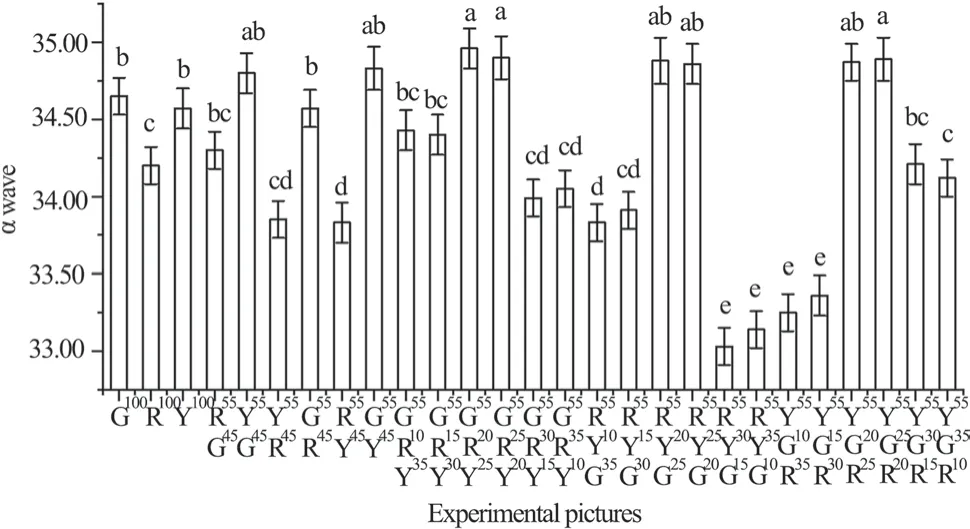
Fig.12 Comprehensive comparison of plant communities with different color combinations.Note α wave power marked with different letters were shown significant difference between each color characteristic (p <0.05)
Discussion
Gender-related differences
In the current study,we used a subjective questionnaire and EEG measurement of α wave activity data as experimental indicators.We examined differences between these subjective and objective forms of evaluation in an experiment in which participants viewed images of tended plant communities containing different color combinations.Our goal was to explore the effects of color combinations among tended plant communities on relaxation in humans by examining the effects of individual factors.We found that in terms of personal factors,gender modulated the recorded brain signals,reflecting differences in physiological and psychological states.Furthermore,tended plant communities with specific color combinations had different effects on human α waves and subjective evaluation data.
Gender has been reported to be an important factor in brain activity experiments (Allen et al.2003;Joshi et al.2020;Kranz et al.2020).The current results revealed differences in α wave activity and subjective evaluation scores between men and women when viewing the experimental stimuli.Specifically,viewing images of foliage with different color combinations appeared to induce stronger feelings of relaxation in women compared with men.A previous study by Wang et al.(2021) yielded similar results when college office workers observed multiple bamboo landscapes,and women exhibited stronger α wave activity compared with men when viewing bamboo landscapes with two or more color combinations.This result is consistent with the responses of office workers to various plant colors,as reported by Li et al.(2013).When women viewed plants with different colors in an office,they reported feeling calm and happy,whereas the same images made men feel excited and nervous.Dupont et al.(2014) and Emery and Webster (2019) examined participants’ visual evaluations of landscapes,confirming that women evaluated colors as being more beautiful compared with men.Tarashkar et al.(2020) also reported that female viewers had more positive psychological experiences,stronger behavioral characteristics,and greater landscape needs when appreciating garden landscapes,and that the emotional effects of landscape environments were more obvious in female visitors.In a study of the effects of plant color,Elsadek (2014) reported that cerebral blood flow appeared to diminish in the feeling function areas when men viewed green plants.In contrast,in women,cerebral blood flow was less in brain areas related to judgment,motor control,visual processing and feeling function (Elsadek 2014).Besides,women exhibited more eye movement fixation when viewing green plants compared with men (Elsadek 2014).Taken together,these previous results could potentially provide a reasonable explanation for the current finding that women exhibited more relaxation than men after viewing images of plants.Considering color combinations intended plant communities from the perspective of gender may be useful for increasing the inclusiveness of landscape environments and providing a reference for human-centered design.
We confirmed that there was a correlation between our subjective evaluation and objective EEG data.This finding is consistent with previous research.Li et al.(2013)used a questionnaire survey and biofeedback methods(physiological measurements such as systolic pressure,diastolic pressure,and heart rate) to explore the impact of plant color on humans.The results revealed that the subjective questionnaire data were closely related to the objective data,and that both types of data reflected participants’ physical and mental state.The studies described above indicate that human psychological and physical responses to the external environment (whether via visual or physical perception) are convergent.Our study revealed a low level of consistency between subjective evaluation and α wave power.This may have occurred because subjective emotions,such as those captured by a questionnaire,appear after physiological reactions.In addition,because of the strong sensitivity of EEG signals,some slight responses of the cerebral cortex cannot be reflected in the subjective evaluation.
Plant color factors
Plant communities containing one color
Among the plant community images containing only one color,100% green plant communities and 100% yellow plant communities induced better relaxation effects than 100% red plant communities on the human body.Furthermore,the relaxation effect of green plant communities was slightly stronger than that of yellow plant communities,and 100% red plant communities had the smallest relaxation effect.This finding regarding the positive effects of green and yellow plants on the human body is consistent with previous research (Li 2013;Jang et al.2019).Yellow hues were reported to be systematically associated with joy,whereas yellow-green hues were reported to be associated with relaxation (Jonauskaite et al.2018).Using a psychological questionnaire regarding emotional words,Jang et al.(2019)found that green plants produced “calm”and “comfortable”feelings,whereas red plants produced “uneasy”and“intense”feelings.Besides,an earlier study by Jang et al.(2014) reported that higher α wave power when viewing yellow flowers compared with red improved negative emotions and made people happier.Kexiu et al.(2021) found that watching green plants reduced Oxy-Hub in the brain,indicating a relaxed mood.Lohr and Pearson-Mims (2000),Shibata and Suzuki (2001),and Jang et al.(2014) found that when participants observed a green natural environment and green plants,α wave power significantly increased,reflecting enhanced relaxation.Mohamed et al.(2013) monitored blood flow in the right prefrontal cortex and reported that viewing green plants caused subjects to feel blessed,happy,and relaxed.Li (2013) reported that yellow leaf autumn landscapes aided relaxation and reduced anxiety more than red and red-yellow mixed color autumn landscapes.Fan and Niu (2014) reported that the presence of red plants significantly reduced α wave power.Therefore,landscapes with higher proportions of green and yellow plants and fewer red plants appear to have stronger relaxation effects.
Plant communities with two and three colors
Few previous studies have investigated the effects of tended plant communities with combinations of two or three colors,particularly in terms of the proportional and locational relationships of each color.To date,only the scenic beauty estimation method has been used as a summary of the overall effects of plant landscapes (Franco et al.2003;Ribe 2009;Frank et al.2013;Schirpke et al.2013).That is,the use of a single color in large areas of a plant community may cause the scene to appear less vibrant,making the addition of other colors advantageous (Song and Che 2011).Zhuang et al.(2021) also reported that different proportions of cold and warm colors in plants can have different emotional effects,and that increasing the proportion of cold colors can benefit emotional health.On the basis of previous studies,we used EEG and subjective evaluation scores as objective measures of the effects of combinations of two or three plant colors on human physiology and psychology.Our findings also included information about color ratio and color position relationships.
Overall,the current findings demonstrated that relaxation effects were stronger when college students viewed images of plant communities containing two and three plant colors compared with monochromatic plant communities.These results are similar to the findings of Hoyle et al.(2018),who reported that meadow flowers with a high level of color diversity were more conducive to human perceptual recovery.Specifically,in plant communities with two colors and a 55%+45% color ratio,combinations of green+yellow and green+red induced stronger relaxation effects than the combination of yellow+red.This finding is consistent with the results obtained by Wang et al.(2018),who used physiological measures such as heart rate and blood pressure to examine the impact of plant color on the physical and mental health of college students.The combination of green and yellow plants was found to be the best for landscapes,followed by the combination of green and red plants.A study by Mohamed et al.(2017) reported that yellow+green plants can cause a significant reduction in blood oxyhemoglobin concentration in humans and produced a more relaxed and calm psychological feeling compared with red.This provides a reasonable explanation for the current findings.Previous articles by Kuller et al.(2009) and Elsadek (2014) reported that viewing the color red induces a state of arousal in the human brain and activates the motor areas.These previous findings may explain the weakening of relaxation effects as the amount of red in the visual scene increased in the current study.
However,different color positions and proportions may affect the degree of relaxation induced by viewing images of different plant communities.Thorpert (2019) discussed the effects of viewing distance on color perception and the effect of color contrast on visitors’ experiences using color perception and environmental assessment methods.This previous study has some similarities with the current study,in which we examined the proportions and locations of plant communities,although we also measured and analyzed the physiological data of the participants.
Among plant communities with three colors,the relaxation effect was strongest when the color proportion of the plant community was 55%+25%+20% and the block position of each color was symmetrical and balanced.This finding is consistent with the finding of Lin and Li (2007)that in complex,changeable,and scattered environments,the application of simple colors and textures can produce a sense of unity in a space.Furthermore,when the proportion of green+yellow and green+red plants in plant communities with three colors exceeded 85%,the relaxation effect was strongest.A previous study reported that yellow-green hues were associated with relaxation and a feeling of joy(Jonauskaite et al.2018).In one previous study,when subjects were exposed to groups of real green and red plants,the presence of green plants increased internal concentration more than the presence of red plants (Jang et al.2019).Finally,the worst color ratio for relaxation was more than 85% yellow+red plants.A previous study suggested that exposure to warm colors with high visibility may lead to an acceleration of blood flow,increase in blood pressure,and acceleration of pulse,resulting in feelings of irritability and nervousness (Brambilla et al.2020).In the current study,when the bottom shrub was yellow,the proportion of dark yellow was large,and α wave power was low after matching with the upper red shrub.Therefore,it may be helpful to consider both the proportional relationship among colors and the balanced distribution of colors in plant communities with three colors.
Although we used subjective evaluation combined with a physiological measurement to improve the accuracy of our data,the current study still involved several limitations.First,the subjects in this experiment were undergraduates and postgraduates aged between 18 and 27.Although related studies have reported that data obtained from college students in visual stimulation experiments were representative(Kaplan and Herbert 1987),the current results may not be fully generalizable to the general public.Second,the sample size in the current study was relatively small,comprising 40 participants.Further studies with larger samples are needed.Third,this experiment used stimuli depicting visual scenes from one particular climate,in which the recorded plant color types were relatively monotonous.Fourth,Photoshop software was used for image processing and color recognition in this study;MATLAB (Minervini et al.2014)and Python (Chen et al.2021a,b) could be used in future studies for accurate identification of environmental features.Fifth,additional research will be needed to fully explore the effects of color proportion and position gradient.Nonhuman animals are an important part of the ecosystem,and have different visual perception abilities and needs compared with those of humans (Athira et al.2019).Future research on the effects of plant color on other species should also be conducted.
Conclusion
This study used plant community color combinations as a research object,and examined the effects of different color quantities,proportions,and positions on human physiology and psychology.We found that specific plant community color configurations had unique effects on relaxation.
The current findings indicated that women’s EEG activity tended to indicate greater relaxation compared with that of men after viewing plant images.Different color combinations in the tended plant communities have different effects on observers’ physiology and psychology.Thus,optimal color combinations may be useful for facilitating the physical and mental health of the public.In the future practice of plant community environment design,rich plant colors should be considered.Plant communities with two or three different colors were rated more positively than those with one color,and produced a stronger physiological response.Among plant communities with three colors,the relaxation effect was strongest when the color ratio was 55%+25%+20%,with green and yellow having the largest proportion,and the color positions being evenly distributed.And,attention should be paid to the even distribution of the color proportions of multi-layer plant communities.In situations with a small number of plant colors,it may be beneficial to choose green or yellow plants,to provide people with more comfortable and relaxed environmental experiences.For example,the 55%+45% color proportion with green+yellow and green+red combinations induced stronger relaxation effects compared with the yellow+red combination.The current study contributes to inform approaches for optimizing the role of plant color in garden spaces from both plant-focused and human-focused perspectives,and maximizing the health-promoting functions of tended plant communities.
AcknowledgementsWe are grateful for the support of our laboratory(Cold Region Green Microclimate Landscape Architecture Engineering Laboratory of Liaoning Province).We thank Jun Gu,an undergraduate student from Selwyn College,Cambridge for editing the English text of a draft of this manuscript.
Open AccessThis article is licensed under a Creative Commons Attribution 4.0 International License,which permits use,sharing,adaptation,distribution and reproduction in any medium or format,as long as you give appropriate credit to the original author(s) and the source,provide a link to the Creative Commons licence,and indicate if changes were made.The images or other third party material in this article are included in the article’s Creative Commons licence,unless indicated otherwise in a credit line to the material.If material is not included in the article’s Creative Commons licence and your intended use is not permitted by statutory regulation or exceeds the permitted use,you will need to obtain permission directly from the copyright holder.To view a copy of this licence,visit http://creativecommons.org/licenses/by/4.0/.
杂志排行

Journal of Forestry Research的其它文章
- Impact of cattle density on the structure and natural regeneration of a turkey oak stand on an agrosilvopastoral farm in central Italy
- Annual growth of Fagus orientalis is limited by spring drought conditions in Iran’s Golestan Province
- Climate‑change habitat shifts for the vulnerable endemic oak species (Quercus arkansana Sarg.)
- Plant growth and metabolism of exotic and native Crotalaria species for mine land rehabilitation in the Amazon
- Peat properties of a tropical forest reserve adjacent to a fire-break canal
- Climate-growth relationships of Pinus tabuliformis along an altitudinal gradient on Baiyunshan Mountain,Central China