Impact of cattle density on the structure and natural regeneration of a turkey oak stand on an agrosilvopastoral farm in central Italy
2024-01-26AlessandraPaciniFrancescoPelleriFrancescoMariniAlbertoMaltoniBarbaraMariottiGianluigiMazzaMariaChiaraManetti
Alessandra Pacini · Francesco Pelleri · Francesco Marini · Alberto Maltoni ·Barbara Mariotti · Gianluigi Mazza · Maria Chiara Manetti
Abstract On an agrosilvopastoral farm in central Italy where Maremmana cattle graze in Turkey oak forests,we evaluated the impact of different livestock densities on stand structure,tree diversity and natural regeneration in four types of grazed areas based on the grazing regime adopted:calf-grazed,high-intensity-grazed,low-intensity-grazed,ungrazed control.For each area,we set up three permanent circular plots (radius of 15 m) to survey the structural and dasometric characteristics of the overstorey,understorey,and regeneration layer.The results showed that grazing negatively affected the complexity of the forest structure and its potential to regenerate and maintain a high level of biodiversity.The differences in stand structure observed between the grazing areas were closely related to livestock density.The most sensitive components of the system were the understorey and the regeneration layers.Contrarily,the current grazing management did not affect the dominant tree structure or its composition.Our findings identified mediumterm monitoring and regeneration management as the two significant aspects to consider when assessing sustainable livestock.New forests can be established by excluding grazing for about 20–25 years.
Keywords Agroforestry · Stand structure · Regeneration ·Tree biodiversity · Grazing intensity
Introduction
In the Mediterranean region of Europe,one of the world’s most vulnerable regions to the impacts of global warming(Lionello et al 2014),many of the traditional forestry products are also gradually declining in economic value,and the abandonment of agrosilvopastoral practices is contributing to the loss of biodiversity and increases in hydrogeological and fire risks (Adams 1975;Graham et al 2010).In this context,appropriate knowledge of available resources and management tools is necessary to foster economically and environmentally sustainable land–use systems in this area.According to the EIP–AGRI Focus Group report (2017),agroforestry systems are key to promoting sustainability in rural areas.These practices can be applied to create profitable systems while sequestering carbon,improving biodiversity,controlling erosion,and improving water resource management.Among them,silvopastoralism is the most widespread agroforestry practice globally.In Europe,silvopastoral systems already covered a surface area of 15.1 million ha in 2017 (den Herder et al 2017) and continue to expand.Silvopastures combine on the same land unit a tree component (e.g.,forest,plantation,open forest) with animal husbandry,improving resource use through the interaction between the components (Mayerfeld et al 2022),or trees are integrated within livestock farms for livestock as forests (e.g.,for grazing) or orchards (Paris et al 2019).In these systems,a sustainable management approach can yield numerous environmental and economic benefits (Garrett et al 2004;Mosquera-Losada et al 2006;Guerin 2009;Mayerfeld et al 2016) such as improved nutrient cycling and carbon sequestration (Ferreiro-Domínguez et al 2016;Hoosbeek et al 2018),ground vegetation control and fire-risk reduction (Adams 1975) and provide thermic shelter for animals,reduce production costs and improve local products.Nevertheless,livestock grazing in a forest often conflicts with the aims of silviculture and forest conservation owing to trampling,shattering,and foraging selectivity (Fleischner 1994;Graham et al 2010;Mayerfeld et al 2016;Nicodemo and Porfírio-da-Silva 2019);thus,sustainable management of a free-range breed in a forest must be based on a thorough understanding of the available natural resources (Goracci et al 2007).
The present study was carried out in the rural area of Maremma (in Tuscany,Region of Central Italy),a traditional pasture and transhumance land where silvopastoral systems have historically been a typical land-use type.Here,oak forests,including turkey oak (Quercus cerrisL.) as an important and widespread species,are commonly grazed by livestock due to the palatability of the acorns,and Maremmana cattle,a typical breed in the area,are well adapted to the harsh local conditions.
In Italy,turkey oak forests occupy almost 10% of the Italian forest land,corresponding to 1,059,876 ha,66% of which are managed as coppices (Gasparini et al 2023).These forests are threatened by numerous anthropogenic disturbances such as uncontrolled grazing and logging (Barbero et al 1990) led to profound changes during the nineteenth century (Fabbio et al 2003).Today’s legacy of Italian oak forests is the result of decades of sparsely maintained coppices and conversions into high forest,started with the exodus from the countryside and collapse of the firewood market,which both occurred by the latter half of the twentieth century (Goracci et al 2007;Manetti et al 2020).In this context,grazing inside forests makes silvicultural management more complicated,raising the need for specific studies to determine the most suitable practices for developing the different elements of the silvopastoral system (Mosquera-Losada et al 2006).Attributes of the forest stand structure can significantly influence the supply of ecosystem services and can be used as predictors of forest functioning because they are influenced by factors such as environmental conditions,biotic interactions,and disturbances (Buongiorno et al 1994;Ali and Mattsson 2017;Ali 2019).Moreover,a better understanding of natural regeneration dynamics may support the definition of the more appropriate management strategies for maintaining silvicultural systems over time (Cierjacks and Hensen 2004;Valipour et al 2014;Hanish et al 2022).The woody component of the silvopastoral system can help improve the use of the existing resources (Mosquera-Losada et al 2018) and provide many benefits to the livestock,despite the adverse interaction being more complicated to investigate (Guerin 2009).Previous studies found that over-and under-grazing can modify ecosystem structure and functions because Mediterranean landscapes are strongly linked to human activity (De Aranzabal et al 2008;Röder et al 2008).The presence of livestock has a negative impact on the abundance and species richness of saplings and the woody understorey in temperate forests (Bernes et al 2018).Moreover,the intensification of livestock grazing can influence forest regeneration (Dufour-Dror 2007),causing in some cases a loss of resilience,but no differences in the regeneration of holm oaks (Quercus ilexL.) among different grazing regimes in Spanish dehesas (Plieninger 2007).According to EIP-AGRI Focus Group Agroforestry (2017),more studies are needed to elucidate how changes in stocking density (i.e.,number of animals on a given unit of area;Longland 2013) may affect stand structure and regeneration over time.Quantifying the impact of livestock grazing in forest ecosystems can play a strategic role in education and training and in developing appropriate tools for planning and decision-making in the Mediterranean area.
Here we evaluated the impact of different stocking densities on stand structure and diversity and natural regeneration of the grazed forest.Additionally,we assessed our study site for overgrazing by quantifying the natural regeneration and evaluating its quality.
Materials and methods
Study area
This research was carried out on the agrosilvopastoral farm Tenuta di Paganico in Maremma in northeastern Grosseto Province in the Tuscan region of Italy.The farm covers a hilly area at 150–220 m a.s.l.with gentle slopes for more than 1500 ha;70% of the farm is occupied by woods,and the rest comprises arable land,olive groves,and vineyards.We focused on turkey oak (Quercus cerrisL.;Fabaceae) stands that were converted into high forests between 1970 and 1985 (around 640 ha) and are currently free-range grazed by Maremmana cattle.Here,turkey oak grows with other tree species such as downy oak (Quercus pubescensL.),cork oak(Quercus suberL.),service tree (Sorbus domesticaL.),and wild service tree [Sorbus torminalisL.(Crantz)].The understorey vegetation is dominated by wood broom (Erica arboreaL.),narrow-leaved mock privet (Phillyrea angustifolia),butcher’s broom (Ruscus aculeatusL.),common hawthorn(Crataegus monogynaJacq.),common broom (Cytisus scopariusL.&Link),and salvia cistus (Cistus salvifoliusL.).According to the forest type definitions for the Tuscan region(Mondino and Bernetti 1998),these stands are classified as acidophilous turkey oak forests associated with wood broom.The moderately fertile soils,developed over the underlying geologic substrate consisting of Verrucano and polygenic conglomerates,are acidic to sub-acidic.
With its typical Mediterranean climate,the area has mild winters and hot,dry summers.Between 1991 and 2020,the nearest weather station in Grosseto recorded a mean annual temperature of 15.7 °C (maximum in August: 25.1 °C;minimum in January: 7.8 °C) and mean annual precipitation of 600 mm (maximum in November:100 mm;lowest in July: 19 mm).The precipitation data show high interannual variability (minimums: 373 mm in 2007,257 mm in 2017;maximums: 861 mm in 2008,1035 mm in 2014).Such climatic variability negatively influences spontaneous herbaceous growth,so supplemental feed must be placed throughout the year in foddering spots in the grazed woods.
Experimental protocol
Four differently grazed areas were identified according to the grazing regimes used on the farm: (1) calf grazed(CG),(2) high-intensity grazed (HG) and (3) low intensity-grazed (LG) by adult cattle,and (4) ungrazed control(NG).Since 2017,the animal load has been reduced on the HG and LG areas,so we characterized the grazing regime after and before 2017 (Table 1).

We calculated the livestock units (LU) using the coefficients (0.6 for the number of calves and 1.0 for the number of adult bovines) defined in the Commission Regulation (EC) No.1974/2006 (available at website https://eur-lex.europa.eu/ eli/ reg/ 2006/ 1974/ oj).Then,we calculated the stocking density (StDen=LU ha-1a-1) as an index to briefly express the grazing intensity,intended as the cumulative effects of the grazing animals during a particular period over a given area (Holechek et al 1998).
Within the area for each grazing regime,we delimited three permanent circular plots with a radius of 15 m,for a total of 12 plots,in homogeneous areas of the four grazed areas.Table 2 summarizes the main plots characteristics and variables,including past silvicultural interventions on the Turkey oak stands.The following surveys of the forest vegetation were done between April and July 2021: (1)survey of the overstorey of the stand,including trees and shrubs with DBH ≥ 2.5 cm and height (H) ≥ 1.30 m;(2)survey of the understorey,including trees and shrubs with DBH <2.5 cm andH≥ 1.3 m;(3) survey of the natural regeneration layer,including seedlings and saplings withH<1.3 m.

Table 2 Main morphological parameters and characteristics of the study areas,including years of silvicultural interventions
Field surveys and data collected
Stem density and basal area distribution of each grazing regime were divided into three size classes,two characterizing the overstorey (class A: large trees with DBH ≥ 12.5 cm;class B: medium trees with DBH from 2.5 to 12.5 cm) and one characterizing the understorey (class C: DBH <2.5 cm).This classification was chosen considering the different developing phases of the stand (trees with DBH <2.5 cm are still in the regeneration phase;trees with DBH between 2.5 cm and 12.5 cm have passed the regeneration phase and are in the qualification phase;trees with DBH >12.5 cm have passed the previous phases and can be considered the future of the stand).
In the overstorey (DBH ≥ 2.5 cm,H≥ 1.30 m) of each area,we determined the species and measured DBH,H,radius of the canopy projection radius along the four cardinal points (N,E,S,W),azimuth,and distance from the center of the plot of each tree belonging to the overstorey.The data were processed by splitting the overstorey into two dimensional classes: (1) medium trees (MT) DBH 2.5–12.5 cm;(2) large trees (LT) DBH ≥ 12.5 cm.The following variables were determined for both classes: number of trees per hectare (N),basal area (BA,m2ha-1),mean diameter (DBH,cm),dominant diameter (DD,cm),mean height (H,m),dominant height (DH,m),volume (V,m3),canopy cover (CC,%) and canopy overlap (CO,%),Shannon–Wiener index (H′,diversity of species in a community;Shannon 1948),and species richness (S,number of species).The number of species and the Shannon–Wiener index are considered the most suitable indexes to analyze the specific diversity in presence of grazing disturbance (Niu et al 2017).Volume was estimated by using predictive equations for turkey oak,white oak,and other deciduous trees (Tabacchi et al 2011).Canopy cover and overlap were estimated based on the assumption that the canopy projection area corresponds to the circular area obtained from each mean canopy–projection radius.
The understorey (DBH <2.5 cm,H≥ 1.3 m) was surveyed by counting all small tree (ST) species and estimating the total canopy cover for each species in the plot.The following variables were calculated: number of ST per hectare (total and per species),canopy cover (total and per species),H′,andS.
For the regeneration layer (H<1.3 m),we surveyed regenerating trees and shrubs within a 1-m2frame that we positioned at 16 different sites in each plot,for a total 48 survey sites in each grazing area.The frame was positioned at 5 m and 10 m from the center of the plot along the four cardinal directions N,E,S,W and four intermediates (NE,SE,SO,NO).In each square meter,we identified the species and measured the height of all regenerating trees and shrubs.We obtained the following variables: total and specific density,mean height,index of regeneration (IR=density × height),sapling density per height classes (three classes: 0–50 cm,51–100 cm,101–130 cm),species richness,and Shannon–Wiener index.
Characterization of stand structure and diversity
We characterized the stands measuring their main dendrometric variables.Then we analyzed the stand structure (overstorey+understorey) by evaluating dimensional,vertical,horizontal,and specific diversity.For dimensional diversity,we determined (1) dimensional evenness,(2) mean basal area,and (3) the difference between dominant and mean diameter.
Dimensional evenness (DE) describes how the trees are distributed inside the size classes.In each plot,we calculated DE as the sum of the relative frequencies of trees in the LT,MT,and ST dimensional classes;values closer to 1 suggest an even distribution among the dimensional classes.
To evaluate the vertical stand structure diversity,we calculated the vertical evenness (VE) using the height classes;values closer to 1 indicate the presence of different canopy layers.
To evaluate horizontal diversity,we used the Cox index(CI;Cox 1971) calculated by splitting the study area into 16 square subplots (5 m × 5 m) (Fig.1) and counting the number of plants in each subplot.We calculated the variance(Var) and mean per plot,then calculated CI as Var/Mean;CI >1 indicates a grouped distribution;CI <1 indicates an even distribution;C ≈ 1 indicates a random distribution.To estimate the specific diversity of the sites,we calculatedSandH′ for the overstorey and understorey.
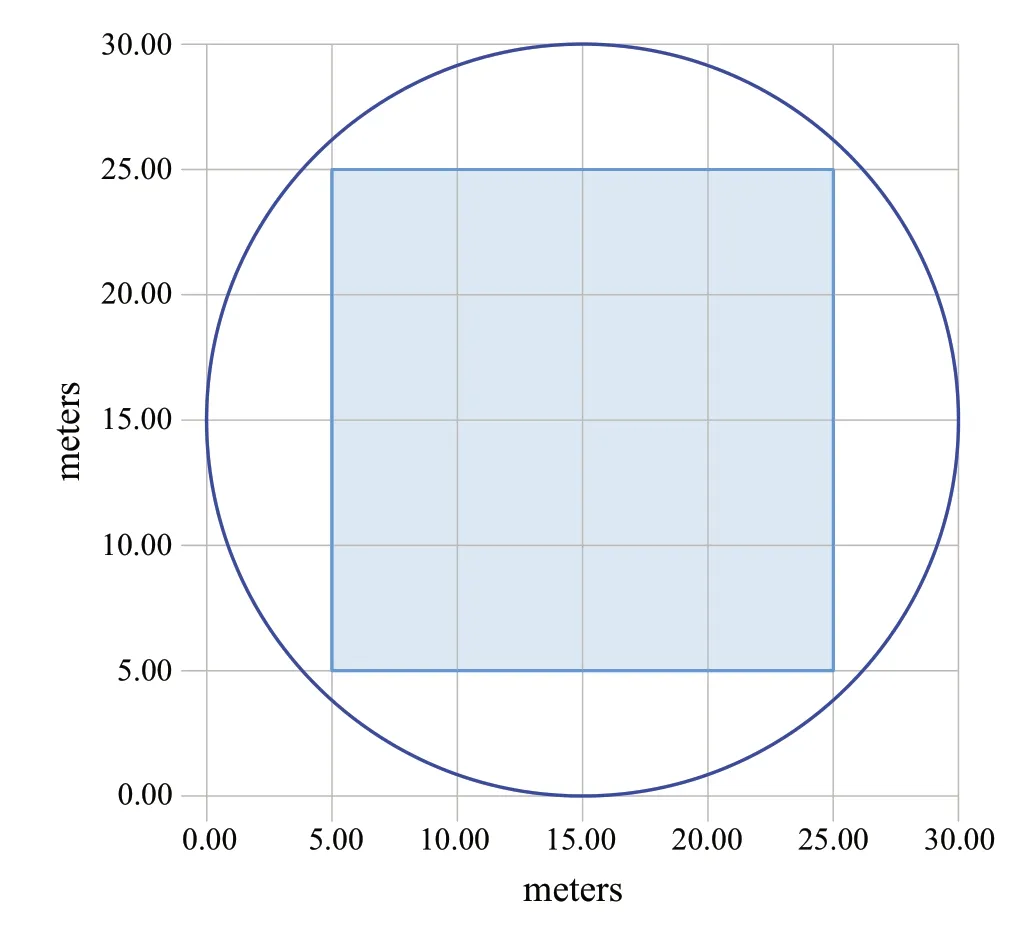
Fig.1 Scheme of plot area divided into subplots for the determination of the Cox Index
Statistical analyses
To identify which variables discriminated the four grazing types,we used a principal component analysis (PCA) using software PAST 4.03 (Hammer et al 2001).We created a data set that included the 16 standardized variables for each of the 12 plots: altitude (alt),aspect (as),slope (s),distance from the foraging point (dist_FP),distance from the barn (dist_B),dominant height (H_dom),stocking density (StDen),number of trees in the overstorey (N_up) and in the overstorey(N_un),basal area of the overstorey (BA_up),mean diameter and height of the overstorey (DBH,Hm),Shannon index of over-and understorey (H’_up,H’_un),species richness of over-and understorey (S_up,S_un),canopy cover of over-and understorey (C_up,C_un),canopy overlapping of the overstorey (O_up),DE,VE,CI.
To determine the significance level of treatment effects,we used the Kruskal–Wallis test and Dunn’s post hoc test to find differences between the medians of the following data:total density of plants (considering LT,MT,and ST),mean height of overstorey,height and density of Turkey oak,and total regeneration.
Results
Impact of grazing on stand structure
Exploratory analysis in stand structure patterns
Principal component analysis (PCA) was applied using the whole data set for site and stand characteristics,grazing regime,and structural indexes.The results (Fig.2) revealed differentiation among the four grazing regimes and identified 11 significant components,with the first two explaining respectively 52.9% (PC1) and 21.6% (PC2) of the total variability.
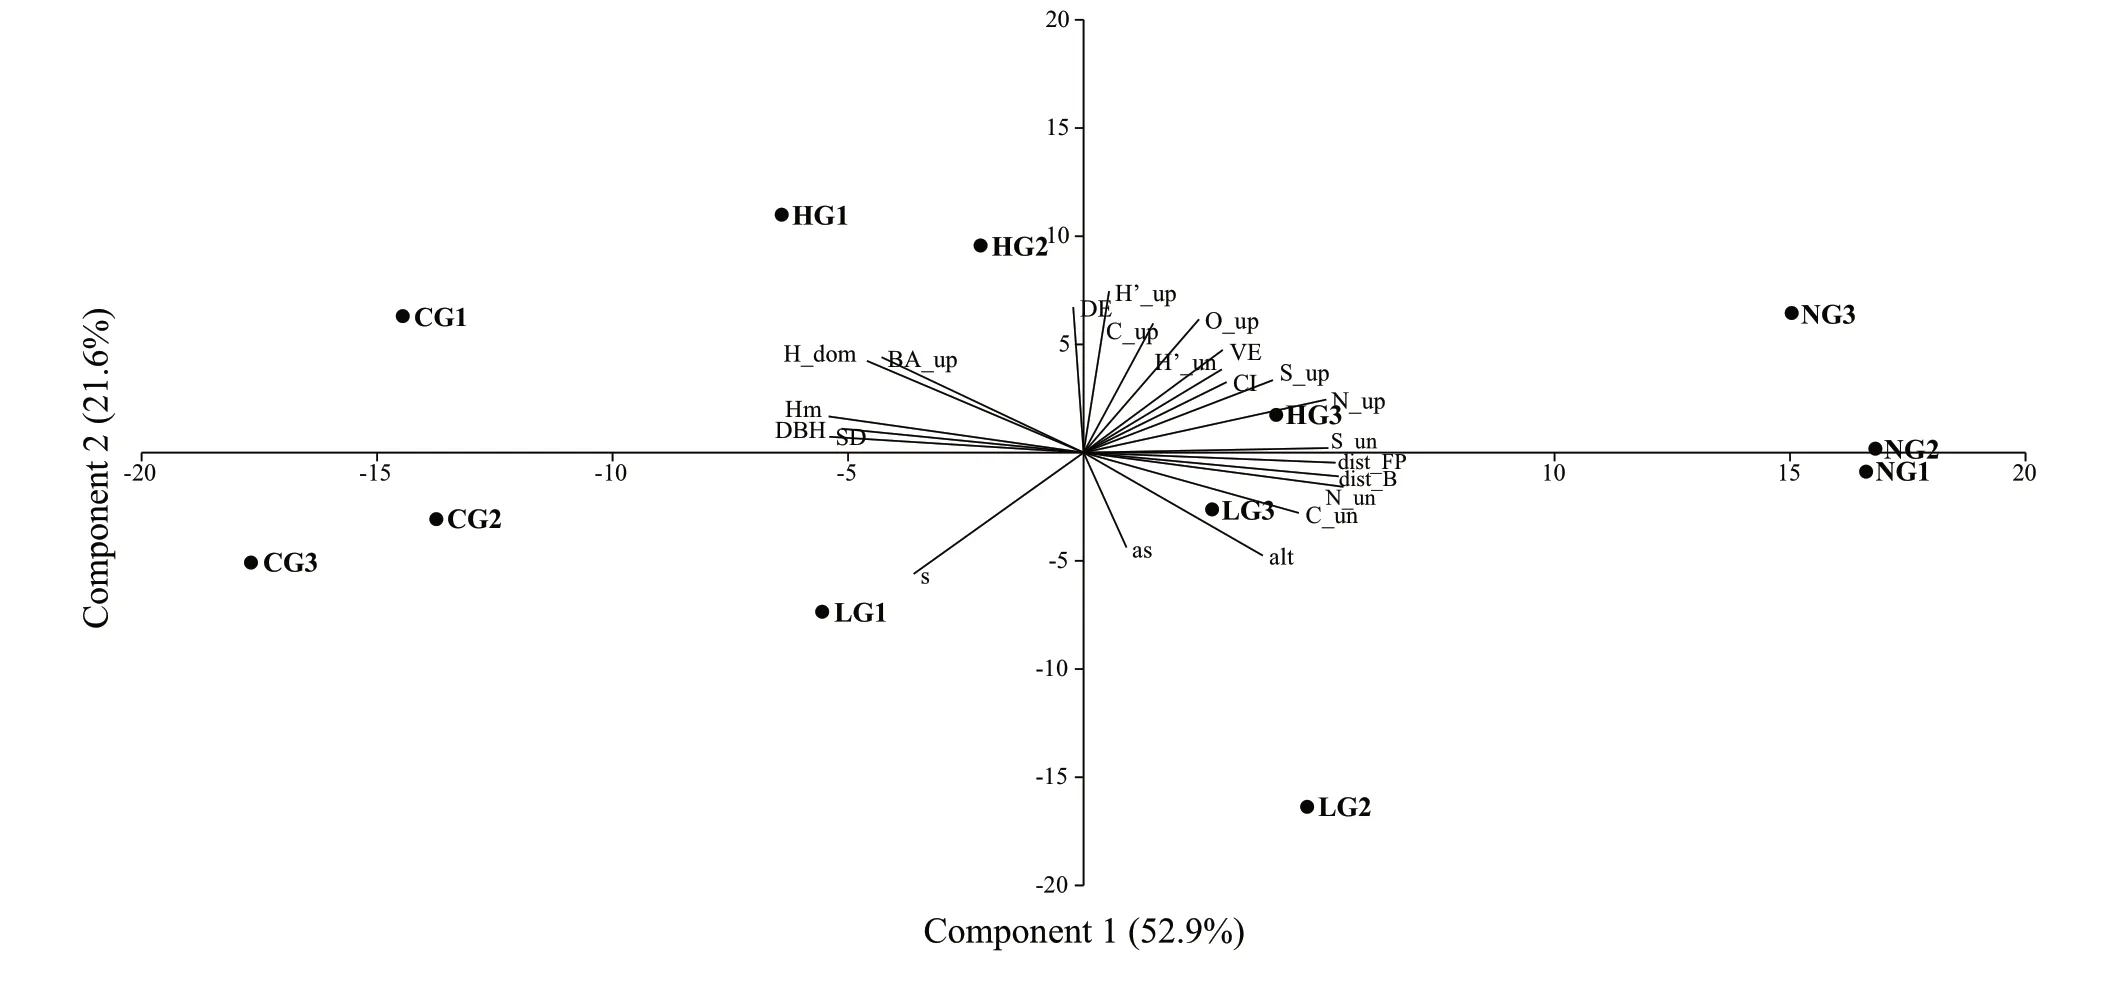
Fig.2 Biplot originated from the Principal Component Analysis.Distribution of the elements on the PC1 and PC2 (74.5% of total variability)
The plots grazed by calves (CG) and the ungrazed (NG)were distinctly clustered and located in opposite ordinates on PC1.The plots grazed by adult cattle,both with a high intensity (HG) and a low intensity (LG),had higher values on PC1 and a more scattered distribution but occurred mostly in opposite ordinates on PC2,except for HG3 and LG3,which are located farther from the area most frequently grazed.
The loading value 0.25 was considered the threshold to recognize the main discriminant variables.Among these,on PC1,we had two variables describing the intensity of grazing (distance from barn [Dist_B] and foraging point[dist_FP]),several stand characteristics (tree number in the overstorey [N_up] and understorey [N_un],mean height[Hm],mean DBH [DBH],and stocking density [StDen]),and species richness in the understorey (S_un).
On PC2 were two site variables (altitude [Alt],and slope[s]),a biodiversity index (Shannon index of the overstorey[H’_up]),two structural indexes (canopy cover [C_up] and canopy overlap [O_up] of the overstorey),and dimensional evenness (DE).
Descriptive stand characteristics
The main descriptive dendrometric variables of the overstorey (Table 3) showed differences between the ungrazed and grazed areas.In NG,all variables,except the number of trees,had lower values.The higher number of trees(1047 ha-1) and the lower site fertility (DH=21.0 m)influenced the basal area (BA=12.09 m2ha-1) and,consequently,mean diameter (12.1 cm) and mean height (9.1 m).The grazed areas had far fewer trees (217 ha–1,335 ha–1and 259 ha–1in CG,HG,and LG,respectively) but with larger basal area,mean diameter,and mean height.The site fertility,expressed by the dominant height,was higher in CG and HG.
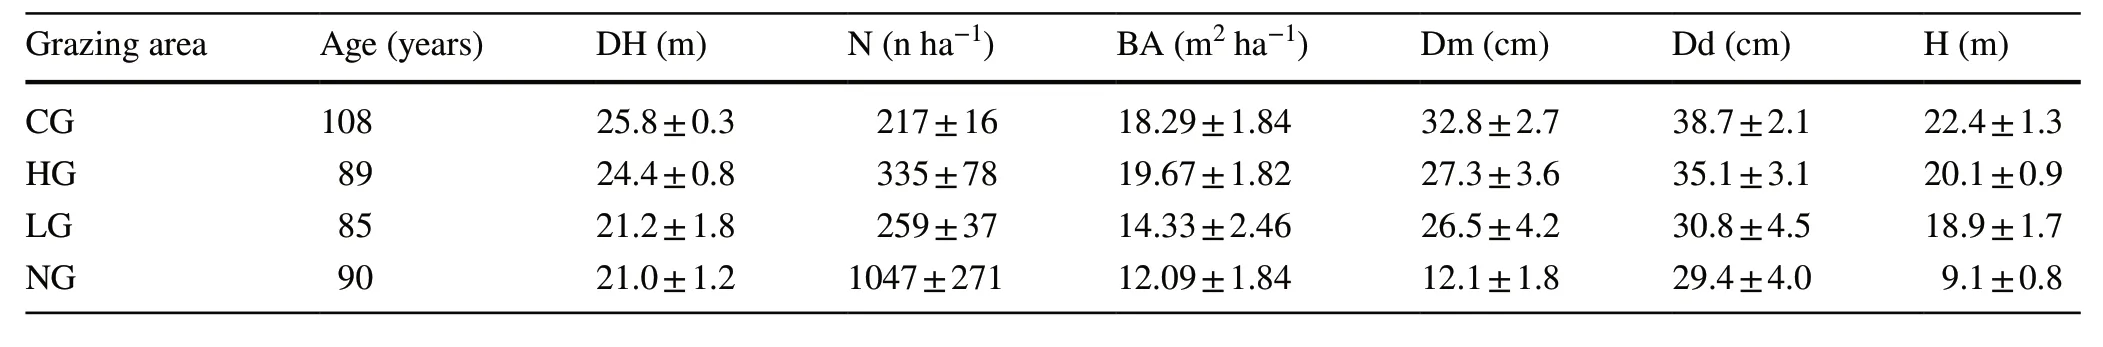
Table 3 Main descriptive dendrometric parameters (mean values ± standard deviation of total number (N) and total basal area (BA)per hectare,dominant and mean diameter (Dd,Dm),dominant and mean height (DH,H) of the overstorey in the four areas (CG=calves grazed;HG=high intensity grazed;LG=low intensity grazed;NG=ungrazed)
The analysis of the stem density and the basal area revealed some differences (Fig.3).In the understorey,the stem density and the basal area per hectare increased in relation to the grazing intensity,from the total absence in CG to 8093 trees per hectare and 0.63 m2ha-1in NG.The variability within each grazing area was high,but significant differences (P<0.05) were recorded only between the plots grazed by calves (CG) and those not grazed (NG).The shrub species were prevalent in the plots grazed by cattle (95% in HG,99% in LG),while in the ungrazed area,the 80% of species were trees,including a low percentage of turkey oak (1%).

Fig.3 Stem density and basal area per hectare (± standard deviation) in the understorey (Small trees with DBH <2.5 cm) and the overstorey (Medium trees with DBH=2.5–12.5;Large trees with DBH ≥ 12.5 cm) in the four areas (CG=calves grazed;HG=high intensity grazed;LG=low intensity grazed;NG=ungrazed).The letters indicate different group according to the Dunn’s post hoc test
The medium tree class had lower values for tree number (33 ha-1in CG,99 ha-1in HG,75 ha-1in LG) and basal area (0.21 m2ha–1in CG,1.68 m2ha–1in HG,2.13 m2ha-1in LG) in all the grazed areas in comparison to the ungrazed one (N=934 ha–1,BA=4.51 m2ha–1).The values increased with grazing intensity,but significant differences(P<0.05) were observed only between the ungrazed area and the grazed ones.The most widespread species,also in this size class and in the grazed plots,were shrubs (from 100% in CG and LG to 60% in HG),while in NG,the tree species increased to 84% (6% were turkey oak,78% were other tree species).
The stem density and basal area of the large trees did not differ significantly among the grazing areas,and turkey oak was the only species recorded in this size class.
Stand structure indexes
Dimensional diversity
No significant differences in dimensional evenness were observed among the grazing areas (Table 4).Large trees were dominant only in CG,but in the other grazing areas,most trees were in the small size class.
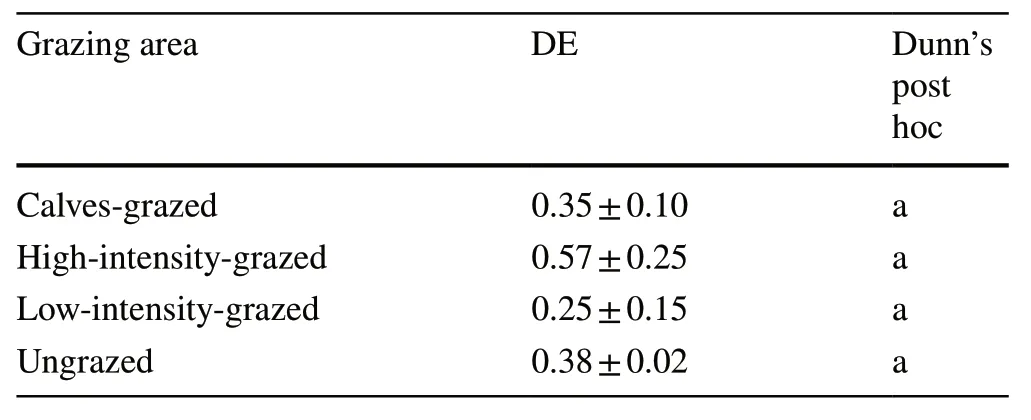
Table 4 Dimensional evenness (DE,mean ± standard deviation) and the result of the Kruskal–Wallis test (Dunn’s post hoc) in the four grazing areas
The mean basal area (Fig.4) reduced with decreasing grazing intensity,mainly due to the increase of small trees;the differences between grazed and non-grazed plots were significant (P<0.05).

Fig.4 Mean basal area,standard deviation and the significant differences (indicated by the letters) according to the Kruskal–Wallis test and Dunn’s post hoc in the four grazing areas (CG=calves grazed;HG=high intensity grazed;LG=low intensity grazed;NG=ungrazed)
The differences between dominant and mean diameter (Table 3) are small in the grazed plots (CG=5.9 cm;HG=7.8 cm;LG=4.3 cm),while they are much higher and statistically significant (P=0.02) in the ungrazed area(NG=17.3 cm).The variability inside each grazing area was low.
Vertical stand structure diversity
The distribution of trees according to height classes (Fig.5)revealed a simplified,monolayered vertical structure in the grazed stands,where more than 80% of trees were concentrated in the dominant layer (H>15 m).On the contrary,in the ungrazed stand,the vertical structure was more complex and multilayered,with a more balanced tree distribution among the height classes.
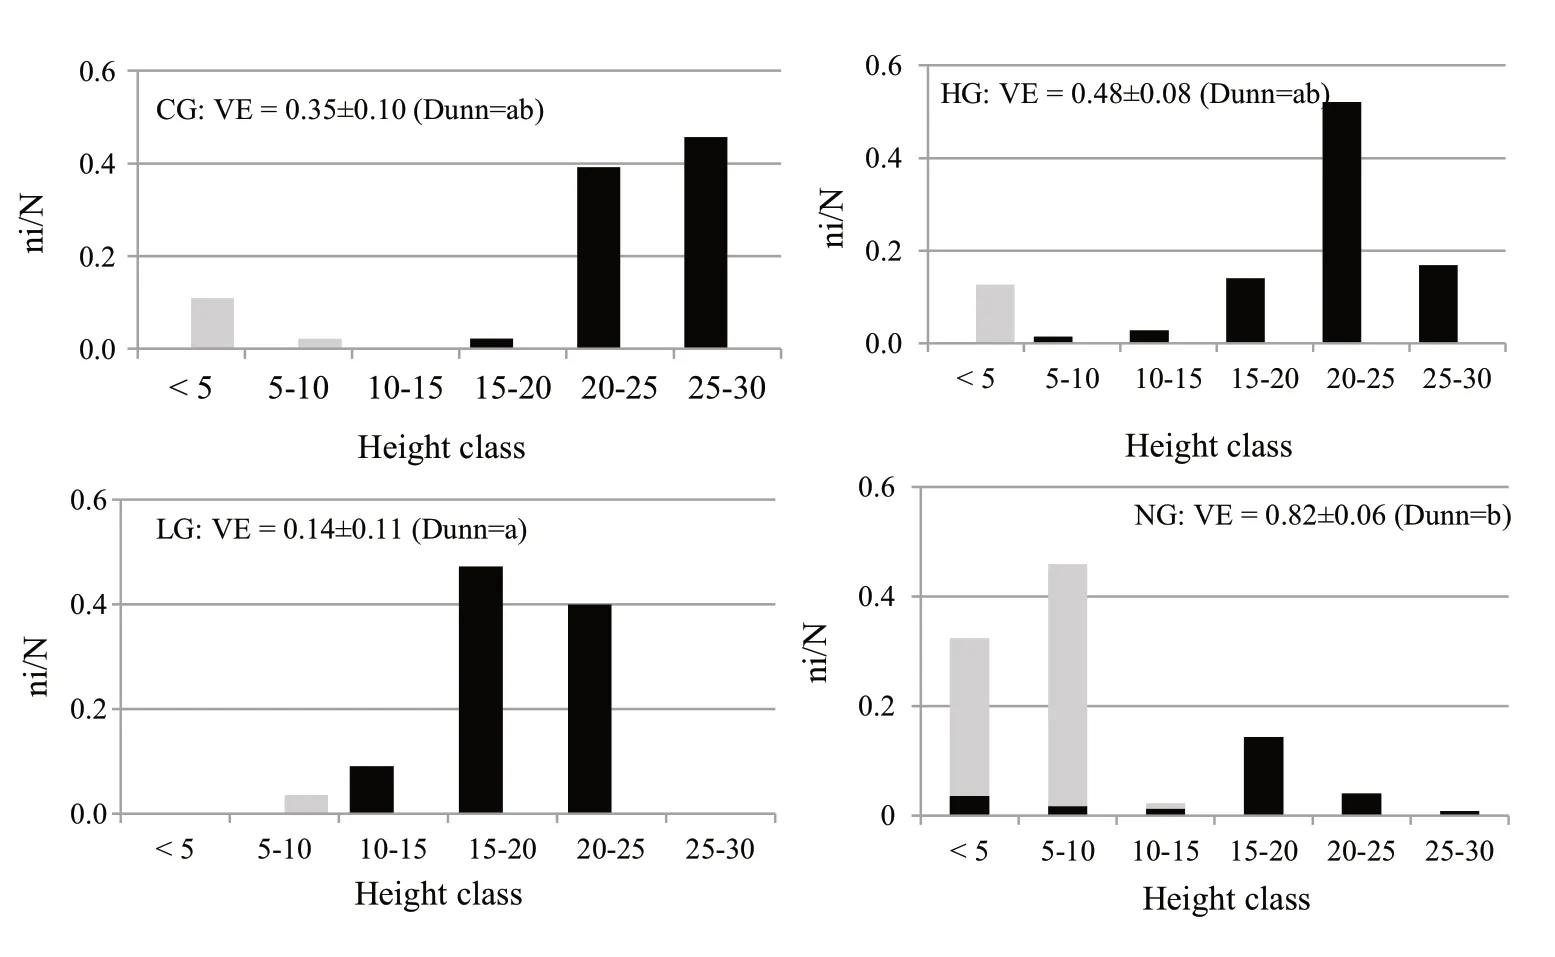
Fig.5 Relative frequencies(ni/N where ni is the number of trees in each height class and N the total number of trees)according to height classes for Quercus cerris (in black)and other species (in grey)in the different areas.The VE,vertical evenness (mean values ± standard deviation)and the significant differences according to the Kruskal–Wallis test and the Dunn’s test(D) are also reported for each area (CG=calves-grazed;HG=high-intensity-grazed;LG=low-intensity-grazed;NG=ungrazed)
The highest value of vertical evenness was observed in NG (0.82),but VE differed significantly only between NG and LG.For tree species composition,in the grazed areas,turkey oak was prevalent only in the upper layer,but in the ungrazed area,the species was recorded for all height classes.
Horizontal stand structure diversity
The canopy cover values for the overstorey were low and similar in the four areas (Table 5),highlighting incomplete use of the horizontal space,even in the ungrazed plots.Canopy overlap exceeded 100% in HG and NG,but significant differences (P<0.05) were observed only between CG and NG.Data variability within each grazing area was low,except for LG,showing high SD values in both indices.The structural complexity,defined as the difference between the canopy overlap and canopy cover,was higher in the ungrazed area than the grazed areas.The lower values for LG were probably due to the impact of the past grazing regime.
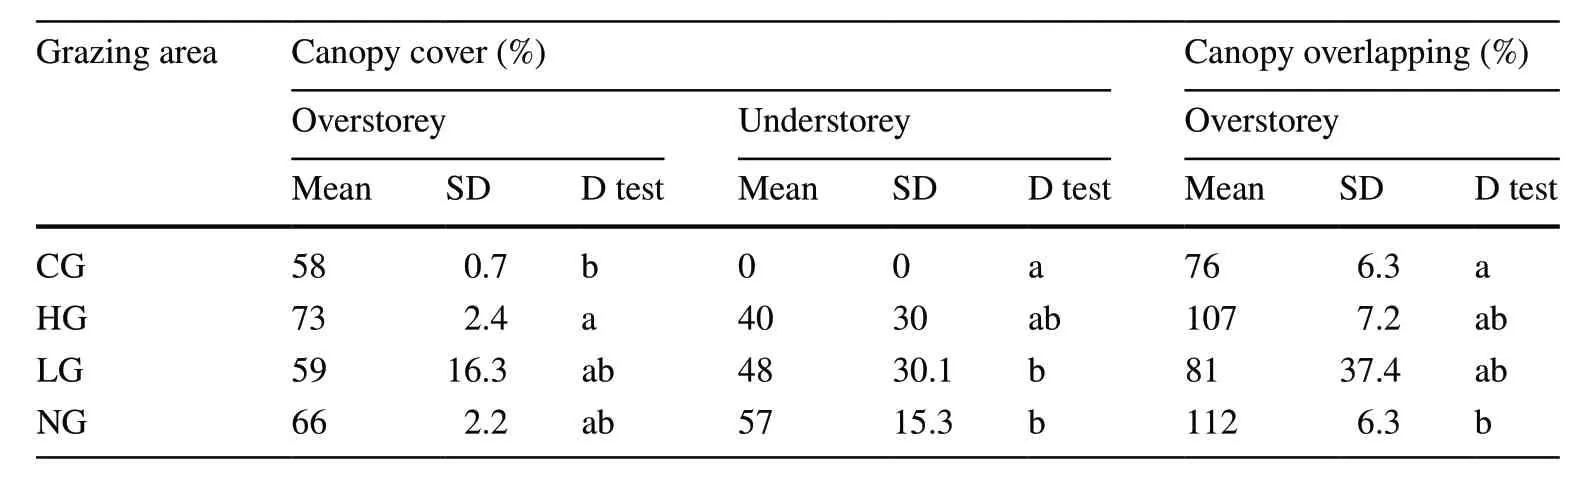
Table 5 Canopy cover(overstorey and understorey)and canopy overlapping (only in the overstorey) in the different areas (CG=calves grazed;HG=high intensity grazed;LG=low intensity grazed;NG=ungrazed)
In the understorey,canopy cover was absent in the plots grazed by calves,but similar in the other two grazed areas(40% in HG and 48% in LG) and higher in the NG (57%).The high variability among the plots in each grazing area(high SD) could be related to the distance from the foraging point.
The Cox index,quantifying the horizontal structure(Fig.6),showed a regular distribution of trees in the grazed stands (CI <1.00).On the contrary,in the ungrazed stand,the high value of the index (CI >1.00) indicates a clustered distribution.
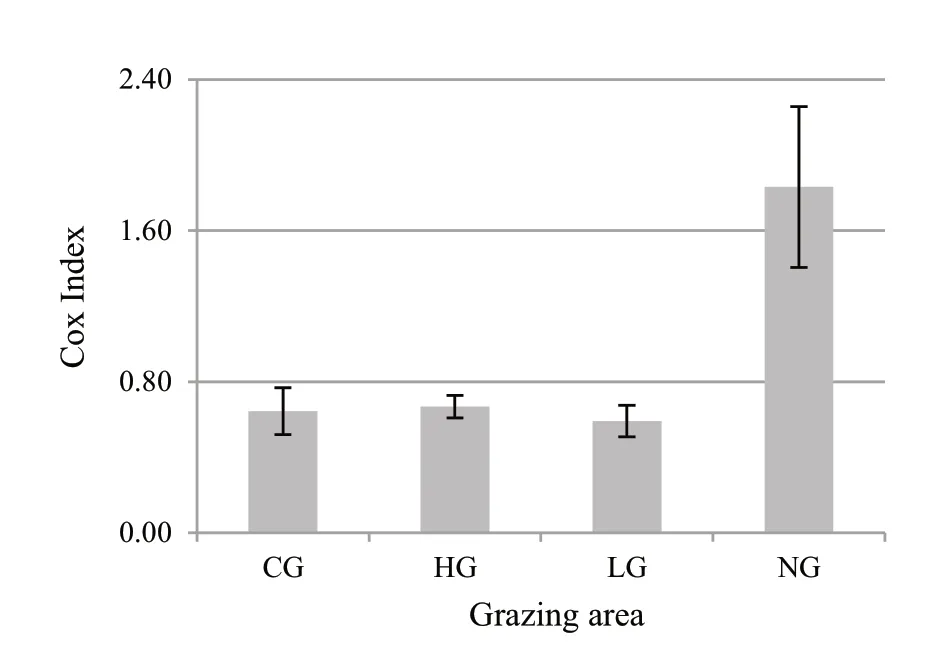
Fig.6 Cox Index (mean value ± standard deviation) in the different grazing areas (CG=calves grazed;HG=high intensity grazed;LG=low intensity grazed;NG=ungrazed)
Impact of grazing on regeneration
The density of the regeneration (Fig.7),expressed as the number of seedlings or saplings less than 1.30 m tall per m2,increased from CG (1.06) to NG (11.17) with significant differences among the areas.Compared to the ungrazed stand,the density was 90% lower in CG,81% in HG and 46% in LG.
The analysis of the mean total height per grazing area identified significant differences among the stands grazed by calves (5.4 cm),adult cattle (HG=31.3 cm and LG=36.5 cm),and ungrazed (22.9 cm).Although the upper limit of the regeneration layer was defined as 1.30 m,few saplings were taller than 50 cm.Most were in the lower(0–50 cm) height class (100% in CG,84% in HG,73% in LG,and 89% in NG).For total saplings,in the 51–100 cm class,none were in CG,only 9% were in HG and NG each,and 21% were in LG.The percentage of saplings that exceeded 1 m in height was low,both in the areas grazed by cattle (7% in HG,6% LG) and in the ungrazed one (2%).
The regeneration index followed the same trend as the density;the lowest values were recorded in the calfgrazed stands (IR=6) and the highest in the ungrazed ones(IR=280).Dunns test revealed significant differences in IR among all grazing areas.
Impact of grazing on specific diversity
The species richness values (S) and the Shannon–Wiener index (H′) underlined the differences among the three layers and the four grazing areas (Fig.8).
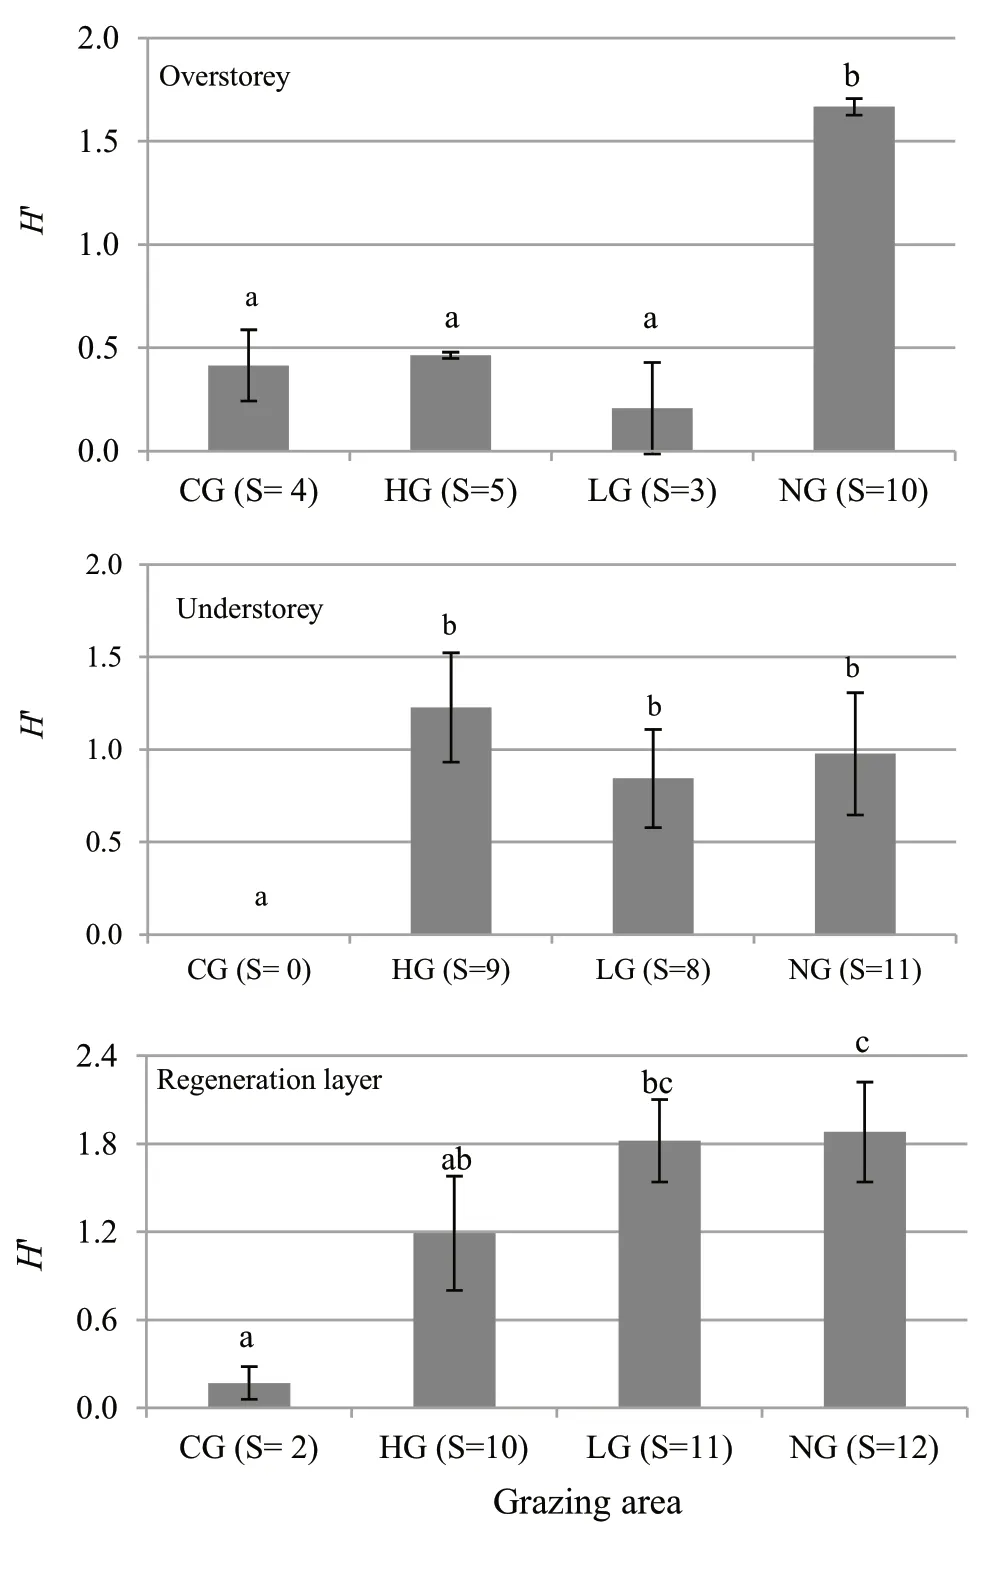
Fig.8 Shannon Index H’ (mean value ± standard deviation) in the overstorey,understorey and regeneration layer,in the four grazing areas (CG=calves grazed;HG=high intensity grazed;LG=low intensity grazed;NG=ungrazed).The value in brackets in the x-axis shows the species richness (S) in each area.The letters point out the statistical significance according to the Kruskal–Wallis and Dunn’s post hoc test
The overstorey of the grazed stands was characterized by fewer species (S=3–5) and by low values for the Shannon–Wiener index (H′=0.41 in CG,H′=0.46 in HG,H′=0.21 in LG).On the contrary,in the ungrazed stand,the number of species (S=10) and the Shannon index(H′=1.67) were high,making the differences between the grazed and ungrazed areas significant.In the understorey,except for CG,the variables for species diversity increased in stands grazed by cattle (S=9 andH′=1.23 in HG;S=8 andH′=0.84 in LG) with similar values to those calculated in NG (S=11 andH′=0.98);the differences between CG and the other areas was significant (Fig.8).
In the regeneration layer,SandH′ were also low for CG (S=2 andH′=0.17).The other two grazed areas had more species (S=10 in HG andS=11 in LG),while in HG the Shannon index compared to those for the understorey remained stable (H′=1.19) and much higher in LG(H′=1.82).In the ungrazed area,both variables were the highest (S=12 andH′=1.88).In this layer,the significant differences were related to grazing intensity.Comparable values were found for the two areas with intense grazing activity (CG and HG),for the two areas grazed by cattle (HG and LG),and those with low-intensity grazing and with no grazing (LG and NG).
Regarding the specific composition (Table 6),turkey oak was the prevalent species of the overstorey in the grazed areas (0.87 in CG,0.86 in HG,0.94 in LG).In the areas excluded from grazing (NG),other tree species assumed considerable importance,mainly flowering ash (0.25) and wild service tree (0.30).

Table 6 Specific composition(relative frequency of each species) in the upperstorey,in the understorey and in the regeneration layer,in the different grazing areas
In the understorey,turkey oak was almost absent,and flowering ash was the main species in NG (0.69),while in HG and LG,shrub species represented almost all individuals present (0.95 in HG and 0.99 in LG).In HG,common juniper (0.26),heather tree (0.26) and Scotch broom (0.19)were the main species,and in LG,hawthorn (0.22),heather tree (0.49) and Scotch broom (0.18) were most common.In CG,the understorey layer was absent.
In the regeneration layer,turkey oak was always present,but was the main species only in CG (0.96) and HG (0.69).In LG,in addition to turkey oak (0.38),shrub species such as Scotch broom (0.18) and heather tree (0.17) were prevalent.In NG,the specific composition appeared more balanced,with a prevalence of flowering ash (0.13) and wild service tree (0.09) among the other tree species and Scotch broom (0.11) and narrow-leaved mock privet (0.07) among the shrubs.
In summary,the main differences in the specific composition were the high presence of tree species other than turkey oak only in areas excluded from grazing (0.61 in the overstorey,0.78 in the understorey,and 0.32 in the regeneration layer),a fair amount of juniper was present only in HG(0.26) and hawthorn was abundant only in LG (0.22).
Discussion
Effective management of free-range livestock in forest environments requires a comprehensive understanding of the natural resources available (Goracci et al 2007).In silvopastoral systems experiencing significant long-term human disturbances such as uncontrolled grazing and logging,which are particularly common in Mediterranean regions,it is crucial to determine the impact of overgrazing on natural regeneration,stand structure and resilience,growth,and biodiversity(Fabbio et al 2003).
Animal grazing inside forests is often identified as conflicting with the aims of silviculture and forest conservation.In addition,a high intensity of management tends to diminish the functionality of the forest stand and reduce tree biodiversity (Cotter et al 2017).
Effect of stocking densities on stand structure
Our results suggested that the grazing activity simplified the stand structure,reduced vertical layering,maintained a regular horizontal spatial distribution,and constrained the development of the lower tree layers and the shrub vegetation.In the overstorey,significant differences between grazed and control areas were found only for mediumsized trees,as also reported by Mayerfeld et al (2022) in a mixed hardwoods forest in Wisconsin and by Mabry (2002)inQuercusstands in Iowa.In contrast with our results,a study by Dufour-Dror (2007) reported no differences in the density of mature trees (height >3 m) between grazed and ungrazed sites in tabor oak (Quercus ithaburensisDecne.subsp.ithaburensis) forests,due to the heavy grazing in the past in the ungrazed stand.
However,prolonged grazing over several years might have influenced the consistency of the smallest dimensional classes of the overstorey,because the continuous constraints on the regeneration process may lead to progressive reduction of the forest cover and thus of tree density (Plieninger et al 2004).
In this regard,it is essential to note that the Maremmana cattle is a very rough breed well adapted to the Mediterranean forests (Goracci et al 2007) and able to bend and crush young,flexible trees up to 5–6 m tall (Piussi and Alberti 2015).Such behavior can have significant impacts on the understorey,as evidenced by the significant decrease in small trees with higher stocking density,with the highest tree density in the NG area,the lowest tree density in HG and absent in CG.In NG,the relative frequency of trees below 10 m tall was higher,while in the grazed areas,trees above 15 m were more frequent.These results agree with other studies of Mediterranean silvopastoral systems (Cierjacks and Hensen 2004;Dufour-Dror 2007;Plieninger et al 2011) and can be attributed to browsing of regenerated vegetation over the years and a sparse or absent understory layer damaged by bending and crushing.
Effect of stocking densities on natural regeneration
The quality and quantity of natural regeneration emerged as the most discriminating factor between different stocking densities.The regeneration capacity can provide an overview of the presence and the abundance of tree and shrub species,serving as a significant indicator to determine the potential and opportunities for the sustainability of the agroforestry system (Suryanto et al 2021).
Grazing-induced changes in forest structure can also impact tree regeneration (Valipour et al 2014);especially in overgrazed forests,regeneration and acorn availability may be negatively influenced (Papadopoulos et al 2017).In addition,shrubs are crucial for facilitating regeneration by providing safe microsites (Plieninger et al 2004).In the Mediterranean area,shrubs have a generally positive effect on woody seedling survival and initial growth (Gómez-Aparicio et al 2004),even in grazed sites (Rousset and Lepart 1999).Our findings showed that the index of regeneration(IR) was higher in NG than CG and the adult grazed areas,suggesting that the regeneration layer was less developed where stocking density and grazing intensity were higher and throughout the grazed areas,where the shrub layer was less developed.
Threshold grazing levels for successful regeneration are probably low (Plieninger et al 2004).In our case,it is reasonable to assume that a stocking density higher than 0.3 induces significant effects on the consistency of the regeneration layer.Other studies have found different values for achieving a balanced stocking density in forests grazed by cattle: from 0.2 in forest stands dominated by oaks in Basilicata (Bianchetto et al 2009) to 0.4 in the Araucaria Forest in Brazil,a mixed forest of broad-leaf and coniferous species dominated byAraucaria angustifolia(Hanish et al 2022),to 0.7 in an oak forest in a Nature Reserve in Israel(Dufour-Dror 2007).Higher values were obtained for holm oak forests in Spain,grazed by goats and sheep (Cierjacks and Hensen 2004).The stocking density is closely related to the stand density;in dense forests,the high degree of canopy cover and thus low light on the ground does not allow for good herbaceous production,while the woody vegetation contributes to feeding the livestock to a reduced extent.
In our plots,we observed a significant increase in seedling density with a reduction in grazing pressure,in line with findings for a semiarid pine forest (Pinus halepensis) under drought and grazing in Israel (Pozner et al 2022).However,in our study,the medium height of the seedlings was significantly lower in the NG area than the HG and LG,in contrast with those in another study (Ollerer et al 2019).These low values recorded in NG could be due to the disturbance caused by the last thinning (winter 2017–2018).In addition,the prevalence of unattractive shrub species such as broom and hawthorn in HG and LG could have contributed to the evolutionary dynamics in the cattle-grazed areas.The selectivity of animals modified the specific composition (Goracci et al 2007;Piussi and Alberti 2015),favouring toxic,thorny,and leathery species such as hawthorn,blackthorn,broom,juniper,rose and bramble.These species,especially the juniper and the bramble,were frequently found in the grazed areas in the understorey and regeneration layers while,in the ungrazed area,only butcher’s broom and rose were recorded.Such species could also serve as nurse plants to facilitate the establishment,growth,and survival needed for regeneration.Protection from herbivores protection is a mechanism associated with nurse plants,reducing browsing and trampling(Filazzola and Lortie 2014).Indeed,growing next to species with protective structures such as thorns (Rousset and Lepart 1999;Flores and Jurado 2003) or unpalatable plants(Smit et al 2006) diminishes the chances of being eaten or trampled.We have not carried out a specific study to verify whether there are nurse–target plant facilitation mechanisms,but in the areas grazed by cattle,the percentage of saplings(plants taller than 50 cm) was higher (16% in HG and 27% in LG) compared to the nongrazed area (11%) where tree species were dominant in the understorey.
Effect of stocking density on forest biodiversity
Despite numerous studies underlining the importance of disturbances in maintaining or promoting the biodiversity of grazed systems (Barradas and Cohen 1994;Ollerer et al 2019),the relationship between grazing and biodiversity is not unequivocal.Our findings revealed that cattle grazing simplified tree and shrub species composition,at least for non-herbaceous plant species,that the forest system is highly sensitive to grazing.The control area (NG) showed the highest number of species and Shannon index values,while CG showed the lowest.These results are contrast with those of Hanisch et al (2022) in a study on southern Brazilian caìvas,where grazing was associated with forest biodiversity conservation;species diversity values reached almost 70% of the diversity found in a regional protected area.Additionally,Ollerer (2019),analyzing more than 70 papers on the impact of grazing in forests,reported that forest grazing can lead to higher floristic diversity and create niches and spatial heterogeneity for several species due to the different feeding preferences of domestic and wild livestock.It is also important to consider that trampling,fraying,and dunging can contribute to changing the internal forest diversity not linearly with grazing (Hester et al 2000).Such controversial findings suggest that the stocking density should be carefully evaluated depending on the target forest species and on the grazing animal.For example,in Denmark,cattle browsing is seasonal and selective compared to the constant,abundant browsing by sheep (Buttenschon and Buttenschon 1978).
As a result,certain levels and types of grazing might be unsuitable for most species but may favor some grazingdependent species (Caballero et al 2009,Hanisch et al 2022)or well-adapted ones likeQuercus pyrenaica(Monserrat 1991).
When considering the two areas grazed by cattle,the understorey and the regeneration layers were more developed in LG;the high intensity grazing of the past (SD=2.5)and its sudden reduction (SD=0.32) caused a decrease in the specific composition of rough and flammable species(mostly brooms),enabling the understorey and regeneration layers to develop rapidly.
The specific composition in the two grazed layers (understorey and regeneration layer) could provide valuable support for livestock feeding and fill the summer and winter feed gaps if they are evergreen (Papanastasis et al 2008).The most important tree species with a high nutritive value and usable from spring to autumn,such as turkey oak and ash,were absent in the GC and scarce in the areas grazed by cattle.Maquis species,which can graze year-round,have nutritionally valuable options such as strawberry trees,phillyrea,broom,and heather.These plants species were absent in the CG area but accounted for 45% and 70% of the HG and LG,respectively.
Secondly,thinning meets the need for a low-density overstorey to increase herbaceous production for cattle while ensuring reasonable wood production.Based on these considerations,forest management planning can guarantee the functionality and sustainability of the silvopastoral system for obtaining constant wood production,which could contribute to farm income,assure the regeneration of the stands over time by excluding the herd,and prevent fire risk (Varela et al 2018).
Conclusions
This study provided evidence that grazing has a negative impact on the complexity of the forest’s structure and its potential for regeneration and maintaining high levels of biodiversity in a turkey oak stand in a sub-Mediterranean area.Differences between the grazing areas were tightly linked to the stocking density.Additionally,some effects from past cattle and forest management were found.In this context,the understorey and regeneration layers emerged as the most sensitive components of the system,because their consistency and development showed an inverse relation to grazing intensity.On the contrary,the present grazing management does not seem to affect the dominant tree structure or its composition.
Sustainable management of silvopastoral systems in Mediterranean regions can provide several ecosystem services from a biological,social,and economic perspective.These systems offer various benefits to the local community,such as landscape conservation and fire risk reduction.From a socioeconomic point of view,the well-being of animals,high-quality meat,and abundant availability of wood and non-wood products are also valuable features.
Our findings showed that the current stocking density in HG is suitable for preserving positive stand dynamics and maintaining a good level of ecosystem services.However,a significant problem to consider at mid-term for these stands,characterized by similar age (from 85 to 110),is regeneration management.During the regeneration period (up to 20–25 years),cattle grazing should be forbidden to allow the establishment and growth of the new forest.To optimize grazing activity and differentiate the age structure by parcels,forest management and planning have to forecast anticipated regeneration cuttings,starting from the aged stands.Although turkey oak represents an important food source,the regeneration dynamics found in the present study tend to create mixed stands that could have even greater resilience to climate changes.Extensive or long-term monitoring can provide a better understanding of the sustainability of present and future management approaches for silvopastoral systems,even in the face of climate change.
杂志排行
Journal of Forestry Research的其它文章
- Physiological and psychological responses to tended plant communities with varying color characteristics
- Annual growth of Fagus orientalis is limited by spring drought conditions in Iran’s Golestan Province
- Climate‑change habitat shifts for the vulnerable endemic oak species (Quercus arkansana Sarg.)
- Plant growth and metabolism of exotic and native Crotalaria species for mine land rehabilitation in the Amazon
- Peat properties of a tropical forest reserve adjacent to a fire-break canal
- Climate-growth relationships of Pinus tabuliformis along an altitudinal gradient on Baiyunshan Mountain,Central China