Characterization of mulberry leaf instant tea and evaluation of its hypolipidemia effect via regulation of intestinal microbiota
2024-01-24XioyunHnYunlongBiXioxinFengBochngDuBojingZhengQingshenSun
Xioyun Hn, Yunlong Bi, Xioxin Feng, Bochng Du, Bojing Zheng,c,, Qingshen Sun,
a Engineering Research Center of Agricultural Microbiology Technology, Ministry of Education & Heilongjiang Provincial Key Laboratory of Plant Genetic Engineering and Biological Fermentation Engineering for Cold Region, Key Laboratory of Molecular Biology & Key Laboratory of Microbiology,College of Heilongjiang Province & School of Life Sciences, Heilongjiang University, Harbin 150080, China
b Gannan Forest Farm, Qiqihaer 162100, China
c College of Life Sciences, Northeast Forestry University, Harbin 150040, China
Keywords: Mulberry leaf instant tea Liquid chromatography-mass spectrometry (LC-MS)Antihyperlipidemia Intestinal microbiota
ABSTRACT The purpose of this study was to characterize mulberry leaf instant tea ( MLIT) powder prepared from the‘Longsang No. 1’ (Morus abla L. cv. Longsang 1) mulberry leaves in Heilongjiang Province (China) and assess its obesity-preventing/relieving effects. A total of 174 compounds including quercetin, chlorogenic acid, 1-deoxyecomycin (1-DNJ) related to antihyperlipidemia effects were identif ied from the MLIT powder.MLIT treatment reversed the Lee’s index, fat coefficient, and serum biochemical parameters in both the obesity relieving and obesity preventing mice fed with high-fat diet. In the obesity relieving experiment, the relative abundance of Desulfovibrio in mouse feces decreased after both 0.5% and 1% MLIT treatments. In obesity preventing experiments, mouse with different amount of MLIT treatments showed increased relative abundance of Akkermansia, Bifidobacterium and Lactobacillus, while Deferribacteres, Desulfobacterota decreased. The beneficial bacteria in the intestinal tract of mice treated with MLIT increased. This study proved that MLIT had antihyperlipidemia potential via modulating intestinal microbiota in mice.
1. Introduction
Mulberry trees are grown in China, Japan, Korea, Thailand and other regions. Mulberry leaves contain protein, dietary f iber, amino acids, alkaloids, polysaccharides, flavonoids, etc.[1-6], which have the hypoglycemic and antihyperlipidemia functions by inhibiting fat synthesis or deposition, and serve as anti-obesity materials[7-8].
Studies showed that mulberry leaf-mulberry extract could substantially reduce the body weight of high-fat diet (HFD) mice, and decrease the pro-inflammatory factors such as monocyte chemotactic protein-1 (MCP-1), tumor necrosis factor-α (TNF-α), and interleukin-1β(IL-1β) in the liver[9-10]. Mulberry leaf 1-deoxyecomycin (DNJ)can regulate blood glucose and blood lipid metabolism, mainly by promoting blood lipid transport, glucose and triglyceride (TG)metabolism in the liver in hyperlipidemia model mice[11-13]. DNJ treatment can inhibit glucose intolerance and improve dyslipidemia in HFD-fed mice through down-regulating the levels of TG, total cholesterol (TC) and low-density lipoprotein cholesterol (LDL-C)[11].Other studies have shown that oral administration of mulberry leaf DNJ for 12 weeks could significantly inhibit HFD-induced weight gain, reduce serum cholesterol and improve oral glucose tolerance in male mice[14]. DNJ can also reduce food intake and the risk of obesity by alleviating hypothalamic endoplasmic reticulum stress in rats[15]. The mulberry leaf alkaloid crude extracts can improve liver fat deformation, reduce the number of lipid droplets in the cytoplasm,and decrease the levels of TC and TG in high-fat mice, which might be realized by regulating the expression of hepatic sterol regulatory element binding protein 2 (SREBP2)[16].
Lipid-lowering and slimming tea mainly includes health-care tea with antihyperlipidemia, hypoglycemic and hypotensive effect[17]. A large number of studies have shown that drinking tea and its related products can help reduce fat and lose weight[18]. White tea could improve abnormal lipid metabolismin vitro, and might be a potential lipid-lowering beverage[19]. Studies have also shown that habitual consumption of green tea extracts is helpful for weight loss[20], antidiabetic[21], anti-cancer and anti-inflammatory effects[22].
In our previous study, the mulberry leaf powder has shown good anti-diabetic effects[23]. In this experiment, the mulberry leaf instant tea (MLIT) was developed, and the lipid-lowering effect of MLIT was explored, which is helpful for the development of mulberry products and provides data support for the in-depth development of mulberrybased products.
2. Materials and methods
2.1 Materials and reagents
‘Longsang No. 1’ (Morus ablaL. cv. Longsang 1) mulberry leaves were harvested from Gannan Forest Farm in Gannan County,Qiqihar City, Heilongjiang Province, China in September, 2018.Rutin was purchased from Jiangxi Herborist Biotechnology Co., Ltd.(Nanchang, Jiangxi, China). ELISA kits for Mouse TG, TC, highdensity lipoprotein cholesterol (HDL-C), LDL-C were purchased from Shanghai Enzyme Link Biotechnology Co., Ltd. (Shanghai,China). 85 male C57BL/6J mice, 6-8 weeks old, were purchased from Harbin Medical University (China). The high-fat feed used in this experiment was purchased from Beijing Taibo Hongda Biological Co., Ltd. (Beijing, China), and the standard feed was purchased from Harbin Medical University (China) with the same formula as our previous studies[24].
2.2 Determination of active ingredients in MLIT
Dried mulberry leaves were developed into MLIT powder through the technological process illustrated in Fig. 1 as our previous study[23].Then the ingredients in the MLIT were determined as following.

Fig. 1 Flow chart of mulberry leaf instant tea powder preparation.
2.2.1 Flavonoids
The content of flavonoids was determined by rutin colorimetry[23].In brief, 300 μg/mL rutin standard solution was prepared by dissolving 0.015 g rutin standards with 80% ethanol in a 50 mL volumetric bottle. Then 0, 1.0, 2.0, 3.0, 4.0, 5.0 and 6.0 mL of standard rutin solution was placed into 50 mL volumetric bottles, followed by mixing with 1 mL of 5% sodium nitrite for 5 min. then 1 mL of 10% aluminum nitrate was dropped into the solution and incubated for 5 min; Lastly, 10 mL of 4% sodium hydroxide as added. The absorbance was measured at 510 nm. The standard regression equation of rutin was obtained asy= 9.383 3x− 0.010 9 (R2= 0.999 4).Then flavonoids in the sample was measured and quantified using this regression formula.
2.2.2 Polysaccharides
The MLIT powder was rehydrated and dissolved, then centrifuged at 1 776 ×gfor 15 min. The supernatant was collected and mixed with anhydrous ethanol to make the final ethanol concentration of 80%. The mixtures were placed in a 4 °C refrigerator overnight.After centrifugation at 1 776 ×gfor 15 min, the supernatant was discarded to obtain the mulberry leaf polysaccharide precipitates.The precipitates were dissolved in water, and the polysaccharide concentration was measured by the phenol-sulfuric acid method as previous study[23].
2.2.3 Alkaloids
A total of 1 g of mulberry leaf tea powder was mixed with water at the ratio of material to liquid of 1:20 for 1 h and filtered with gauze to obtain the sample solution. 1 mL of the sample solution was mixed with HCl at pH 2, and 10% silicotungstic acid solution was added dropwise until complete precipitation, followed by filtration with filter paper, and rinsing the precipitate with 1% HCl and distilled water in triplicate, respectively. Finally, the samples were dried at 80 °C until constant weight. The alkaloid content was calculated according to the following formula.
WhereXwas total alkaloid content of mulberry leaves (mg);mwas the precipitation weight (mg) and 0.185 6 was conversion factor.
2.3 Determination of active ingredients in instant tea by liquid chromatography-mass spectrometry
Sample preparation: 50 mg of MLIT sample was accurately weighed into a 2 mL eppendorf tube and mixed with 0.6 mL of 4 mg/L 2-chlorophenylalanine-methanol solution (20 °C), followed by agitating for 30 s, which was then subjected to ground at 55 Hz for 90 s in a tissue grinder loading 100 mg of glass beads. The samples were then sonicated at room temperature for 15 min; and centrifuged at 12 000 ×gfor 10 min at 4 °C. 200 μL of the supernatant was filtered with 0.22 μm filter, and the filtrates were transferred to the detection bottle for use.
Chromatographic conditions: The Thermo Ultimate 3000 equipped with ACQUITY UPLC®HSS T3 (2.1 mm × 150 mm,1.8 μm) chromatographic column was used in this study and the autosampler temperature was 8 °C; the gradient washing conditions were set at the flow rate of 0.25 mL/min and column temperature of 40 °C. The mobile phase was 0.1% formic acid water (C)-0.1% formic acid acetonitrile (D) for positive ion mode and 5 mmol/L ammonium formate water (A)-acetonitrile (B) for negative ion mode. The gradient elution procedure was: 2% mobile phase B/D for 0−1 min; 2%−50%mobile phase B/D for 1−9 min; 50%−98% mobile phase B/D for 9−12 min and kept at 98% mobile phase B/D for another 1.5 min;then decreased rapidly to 2% mobile phase B/D within 0.5 min.Finally, the 2% mobile phase B and D was used as negative ion and positive ion for 14−17 and 14−20 min, respectively. Thermo Q Exactive Plus was used as electrospray ionization source (ESI) using positive/negative ionization mode. The positive and negative ion spray voltage were 3.50 and 2.50 kV, respectively; Capillary temperature was 325 °C under collision voltage of 30 eV; the sheath gas and auxiliary gas were 30 and 10 arb, respectively.
2.4 Animal grouping
Eighty-five mice were used in this study. Each mouse was housed and fed (1 mouse/cage) in compliance with the guidelines for the care and use ofLaboratory Animals and the Institutional Ethical Guidelines in China(No. 20210401003) and had free access to food and water. All animals were maintained for 12 h light/12 h dark cycle, and acclimated for 1 week. Then the mice were grouped into obesity relieving experiments and obesity preventing experiments respectively. In obesity relieving experiment, 40 mice were randomly divided into 4 groups (n= 10): Group A were fed normal diet as blank group; 30 mice were fed a HFD, and the modeling was successful when the body weight of the mice exceeded 10%−20% of the normal body weight. Then 30 mice were divided into Group B (high-fat control group: fed with normal feed); Group C (fed normal feed +0.5% MLIT powder) and Group D (fed normal diet + 1% MLIT powder). The experiments lasted for another 4 weeks. For obesity preventing experiment: 45 mice were randomly divided into 5 groups(n= 9) and fed continuously for 12 weeks: Group E (normal control group: fed with normal feed); Group F (negative control group: HFD feeding); Group G, H, I were fed with high-fat feed containing 2%, 1%and 0.5% (m/m) MLIT powder, respectively.
2.5 Analysis of the clinical behavior, biochemical parameter and intestinal microbiota
2.5.1 Body weight and Lee’s index
At the end of the experiments, the body weight and body length(naso-anus length) of the mice were measured, and the Lee’s index was calculated according to the following formula:
2.5.2 Determination of serum biochemical indicators and immune organ indexes
Mice were fasted for 12 h before sacrifice and allowed to drink water freely. Peripheral blood was collected into 1.5 mL pyrogen and endotoxin free centrifuge tubes. Serum was separated after centrifugation at 1 684 ×gfor 10 min. The TG, TC, HDL and LDL in serum were quantified using ELISA kits.
Upon sacrifice, the liver, spleen and abdomen fat were taken out,the immune organ index and fat coefficient were calculated according to the following:
2.5.3 Hematoxylin-eosin (H&E) staining
Liver tissues after weighed were placed in a sterile PBS for preliminary cleaning, which were then placed in sterile neutral formalin solution for fixation, followed by dehydration through a series of ethanol solutions, paraffin embedding, sectioning, and observation as previous study[23].
2.5.4 Analysis of the intestinal flora in mice
Fresh feces were collected from each cage at the end of experiments and stored in sterile 1.5 mL centrifuge tubes at−20 °C until use. The total DNA of the mouse fecal bacteria was extracted using the fecal genome total DNA extraction kit. The concentration and purity of the DNA were verified by 1.2% agarose gel electrophoresis. The appropriate amount of sample DNA was diluted to 1 ng/μL with sterile water, which was used as templates for PCR amplification based on the sequencing regions using specific primers (515F: GTGCCAGCMGCCGCGGTAA; 806R:GGACTACHVGGGTWTCTAAT). Sequencing libraries were generated using the NEBNext Ultra DNA Library Prep Kit for Illumina (NEB, USA) following the manufacturer’s recommendations,and index codes were added. The raw data obtained by sequencing was firstly spliced and filtered to obtain valid data (clean data), which were subjected to operational taxonomic unit (OTU) clustering and species classification analysis based on valid data. The OTUs that reached a 97% nucleotide similarity were used forα-diversity (Chao1,Shannon and Simpson index) andβ-diversity analyses. According to the results of OTU clustering, species annotation was performed for the representative sequences of each OTU, and the corresponding species information and species-based abundance distributions were obtained. In addition, multiple sequence alignments were also performed to identify the differences in community structures of different groups, as displayed by the principal coordinate analysis(PCA). Finally, the species distribution was compared at phylum and genus level, respectively.
2.6 Data analysis
The Origin 9.0 software was used for data analysis. The data were analyzed by one-way factorial analysis of variance (ANOVA). All data were expressed as the mean ± standard error, and the statistical significance was performed based on the Fisher test.
3. Results
3.1 Determination of active components of MLIT
3.1.1 Flavonoids, polysaccharides and alkaloids
In this experiment, the MLIT contained the following active components: (4.79 ± 0.66) mg/g of flavonoids, (11.17 ± 0.76) mg/g of polysaccharides and (4.09 ± 0.44) mg/g of alkaloids.
3.1.2 LC-MS determination results
Components in MLIT powder based on non-targeted metabolomics using liquid chromatography-mass spectrometry (LC-MS)analysis was shown in Fig. S1. Figs. S1A and B were the total ion current diagram in positive ion mode and negative ion mode,respectively. The peak shape resolution was suitable for the subsequent analysis. A total of 174 compounds were detected by LC-MS,as shown in Table S1. Organic acids (47), amino acids (26),carbohydrates (14) represented the first three abundant substances.
3.2 Effects of MLIT intervention on body growth performance
Fig. 2A showed the mouse body weight changes in the relieving experiments. At the 8thweek, compared with group A ((30.32 ± 1.12) g),the mouse body weight in groups B, C and D was significantly increased induced by HFD. This was reversed by daily intervention of MLIT, and all groups did not show significant difference.
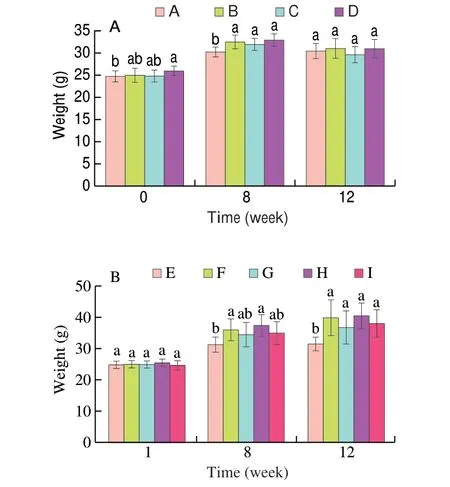
Fig. 2 Mice weight changes in relieving (A) and preventing (B) experiments.In obesity relieving experiment, group A were fed normal diet as blank group throughout the 12 weeks experiments; after the obesity modeling was established, group B was high-fat control group fed with normal feed; groups C and D were fed normal feed with 0.5% and 1% MLIT powder, respectively.For obesity preventing experiment, group E was normal control group fed with normal feed; group F was negative control group fed with high-fat diet;groups G, H, I were fed with high-fat feed containing 2%, 1% and 0.5% (m/m)MLIT powder, respectively. Different lowercase letters indicated significant difference at P < 0.05 level. This is the same for the following figures.
Fig. 2B was the mouse weight change data of mice in the obesity preventing experiments. There is no significant difference in the weight of mice in each group at 1 week. At the 8thweek, the weight of mice in group E ((31.27 ± 2.38) g) was significantly lower than that in group F ((35.98 ± 3.41) g,P= 0.005 27). The mouse body weight with different MLIT treatment showed no significant difference from that of group E.
Table 1 showed the body length and Lee’s index of the mice in the relieving experiments and the preventing experiments. The body length of group B was significantly lower than that of group C and group D.The Lee’s index of group B (395.58 ± 30.36) was significantly higher than that of group C (361.50 ± 19.24,P= 0.005 58)and group D (367.50 ± 24.87,P= 0.020 27). The body length of group I((8.52 ± 0.26) cm) was significantly higher than that of group E((8.04 ± 0.43) cm,P= 0.007 86) and group F ((8.09 ± 0.31) cm,P= 0.015 45); while the Lee’s index of group F was significantly higher than that of group E (P= 0.021 03) and group I (P= 0.030 09).

Table 1 Body length and Lee’s index of mice.
Table 2 showed the liver, spleen indexes, and fat coefficients of the mice in the relieving and preventing experiments. In the relieving experiments, there is no significant difference in the liver and spleen indexes of each group. However, significant differences did exist in the fat coefficient among different groups. The fat coefficients in group C and group D were significantly lower than that of group B(P= 0.006 25 and 0.001 37, respectively).
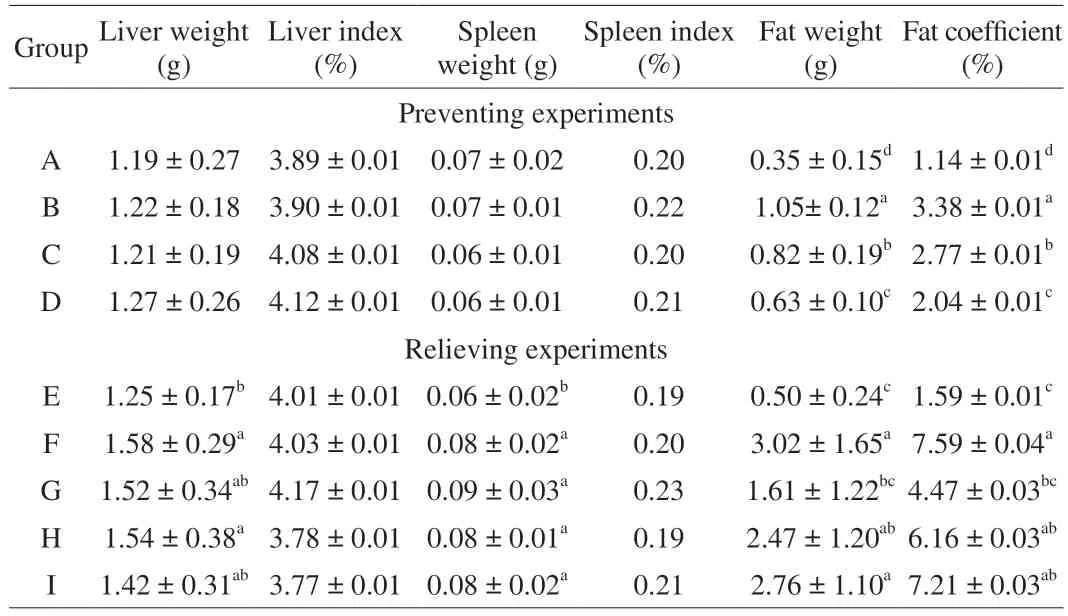
Table 2 Liver index and spleen index of mice in different groups.
In the preventing experiments, the mouse liver index of group E was significantly lower than that of group F (P= 0.027 35); while the mouse liver index of group G and group I were not significantly different from that of group E. There was no significant difference in spleen index among all the groups. The mouse fat coefficient in group G showed no significant difference from that of group E.
3.3 Effects of MLIT intervention on abdominal fat and serum biochemical parameters
Fig. 3A showed the mouse fat images in the relieving experiments. The fat volume of the negative control group (group B)was significantly larger than that of the normal control group (group A)and the middle-dose MLIT group (group D). In the obese preventing experiments, as shown in Fig. 3B, the fat volume of the negative control group (group F) was significantly higher than that of the normal control group (group E) and the high-dose and middle-dose treated mice (groups G, H). These results revealed that the fat volume of mice after the MLIT intervention was reduced.
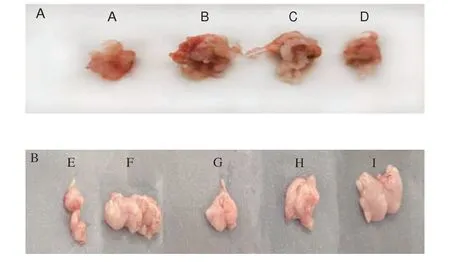
Fig. 3 Fat images of mice in relieving (A) and preventing experiments (B).
Figs. 4A-B showed the mouse serum TG content in the relieving experiments and preventing experiments, respectively. The TG content of model group (group B) was significantly higher than that of low-dose MLIT-treated group (group D,P= 0.043 57).There was no significant difference in TG content among groups A,C and D. The serum TG content in the preventing experiments was significantly higher in the group F than in the normal group E and in the MLIT-treated treatment (groups G, H and I). The serum TC content in the relieving experiments and preventing experiments was revealed in Figs. 4C-D. No significant difference in TC content among different groups was found in the relieving experiments. However, in the preventing experiments, the TC content of the model group (group F,(1.75 ± 0.35) mmol/L) was significantly higher than that of the group E((1.47 ± 0.19) mmol/L,P= 0.024 94), group G ((1.14 ± 0.14) mmol/L,P= 8.408 79 × 10−6) and group H ((1.27 ± 0.33) mmol/L,P= 2.599 93 × 10−4). The MLIT intervention could effectively reduce the serum TC level in mice. Serum HDL content in the relieving experiments (Fig. 4E) and preventing experiments (Fig. 4F) showed the reverse tendency to that of TC, while the LDL content followed the same tendency as that of TC (Figs. 4G, H).
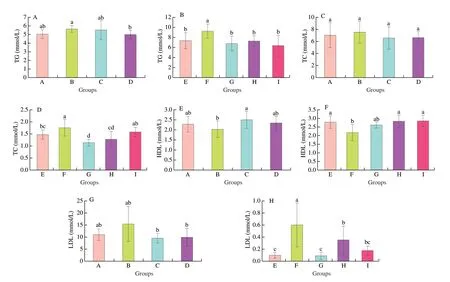
Fig. 4 Changes of serum biochemical parameters. TG (A), TC (C), HDL (E) and LDL (G) in relieving experiments; TG (B), TC (D), HDL (F) and LDL (H) in preventing experiments. Different lowercase letters indicated significant difference at P < 0.05 level.
3.4 Effect of MLIT treatment on liver histological features
Fig. 5 showed H&E images of mouse liver slices in the relieving(Figs. 5A-D) and preventing (Figs. 5E-I) experiments, respectively.The liver cells in group A were linearly arranged and the structure was complete (Fig. 5A), while HFD treatment caused extensive and vacuolar degeneration (Fig. 5B), which was greatly alleviated after MLIT gavage (Figs. 5C, D). No accumulation of lipid droplets in the liver was found in the control group (Fig. 5E), while lipid droplets dispersed in the liver of HFD-fed mouse (group F). This phenomenon was reversed after the intervention of MLIT in a dose-dependent mode (Figs. 5G-I).
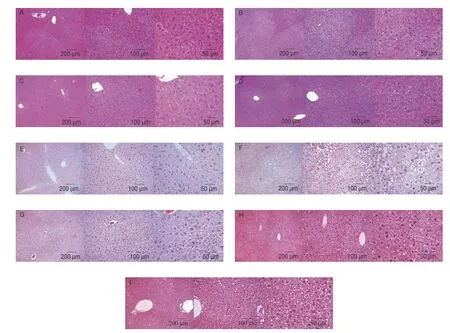
Fig. 5 H&E analysis of liver sections of mice in relieving (A-D) and preventing experiments (E-I).
3.5 Effects of MLIT intervention on intestinal microbiota composition
3.5.1 α-Diversity
The Chao 1, Shannon and Simpson indexes of mouse feces microbiota from the obese relieving and preventing experiments revealed great differences among different groups (Fig. S2). Venn diagrams of the intestinal flora OUT distribution were revealed in Figs. S3A, B, in which each color represents a sample group. In the preventing experiments, the number of common OTUs in all groups was 895. And the number of unique OTUs in groups A–D was 102,184, 95, and 76, respectively (Fig. S3A). Fig. S3B showed that in the obesity relieving experiments, the number of common OTUs in each group is 482, while the number of unique OTUs in groups E–I was 49, 21, 14, 9, and 25, respectively. Fig. S4A was the principal component analysis (PCoA) results for mouse intestinal microbiota in the obese relieving experiments, in which principal component 1(PC1: 56.0%) and principal component 2 (PC2: 23.9%) represented 79.9% of the information of the original data. Compared with group A,the intestinal microbiota in group B were more scattered, indicating the individual differences in reacting to HFD. This phenomenon was reversed in part by the intervention of MLIT. The intestinal microbiota distribution of mice with MLIT intervention low and middle dose groups (groups C, D) was similar. Fig. S4B was the PCoA analysis of the intestinal flora in preventing experiments, in which principal component 1 (PC1: 66.0%) and principal component 2 (PC2: 21.4%) represented 87.4% of the information of the original data. The PCoA results showed that the diversity of intestinal flora was changed, and the distribution of microflora in each dose treatment group was similar.
3.5.2 β-Diversity analysis of the intestinal microflora
Figs. 6A, B were the horizontal stacking diagram of the fecal flora of the mice in the relieving experiments at phyla and genus level,respectively, in which Firmicutes and Bacteroidotaaccounted for more than 80% of the total microorganisms. Compared with the normal group (group A), HFD-treated mice showed no significant differences in the abundance of Firmicutes (P= 0.960 89), while the abundance of Bacteroidota (P= 0.015 73), Desulfobacterota(P= 0.044 47),Verrucomicrobiota (P= 0.006 56) increased; in the meantime,Actinobacteriota and Campilobacterota showed a significant decrease.Only Desulfobacterota showed dose-dependent features in the MLIT treament groups. Compared between groups B and C, the MLIT treatment caused further decrease of Actinobacteriota (P= 0.004 28).
In Fig. S5A, the relative distribution of the same phyla in different groups was compared in order to deduce the change of theses microbes. The proportion of Firmicutes did not changed much in different groups. Contrary to the previous studies, Bacteroidota showed the largest proportion in group B, which decreased with MLIT treatment. The abundance of Desulfobacterota in the negative control group (group B) increased by 54.54%. Compared with the negative control group (group B), theDesulfobacterota in low-dose group (group C) and the middle-dose group (group D) decreased by 46.07% and 50.76%, respectively. The middle-dose MLIT treatment caused great increase of Verrucomicrobiota.
The fecal flora at phylum level of mice in the preventing experiments was displayed in (Figs. 6C, D, S5B). The abundance of Verrucomicrobiota in the negative control group (group F) decreased by 63.24% compared with that of the normal group (group E), while Verrucomicrobiota increased after the intervention with middle-dose MLIT (group H). The abundance of Actinobacteriota decreased by 58.17% in the negative control group (group F) as compared with the normal group (group E), which was then increased by 12.40% in the middle-dose MLIT-treated group (group H). Compared with the normal group (group E), the abundance of Cyanobacteriadecreased by 8.63% in the negative control group (group F), but increased by 0.96%, 14.98% and 26.49% in groups G-I, respectively. Fig. S5B was a horizontal stacking diagram of the fecal flora at phylum level of mice in the preventing experiments. The abundance of Verrucomicrobiota in the negative control group (group F) decreased by 63.24%compared with that of the normal group (group E), which increased after the middle-dose MLIT intervention (group H). As shown in Fig. 6B, Lachnospiraceae_NK4A136_group showed increased proportion in the MLIT treated group, while theLactobacillusrevealed the opposite trend. TheHelicobacterdisappeared in all the HFD-treated mice. The HFD treatment caused great decrease ofBifidobacteriumandDesulfovibrio, which was not reversed by MLIT treatment. Fig. S5B was the genus level stacking chart of the mouse intestinal flora in the preventing experiments. Compared with the normal group (group E), the abundance ofAkkermansiain the negative control group decreased by 63.24%, which was reversed in middle dose MLIT treated group. High, medium and low doses of MLIT treatments (groups G, H, I) decreased the abundance ofAlistipesto the level of normal group (group E). MLIT treatments increased theLactobacillusabundance in a dose-dependent way. The abundance of beneficial bacteria in mice after the intervention of MLIT has increased,which can regulate the intestinal microbiota of mice.
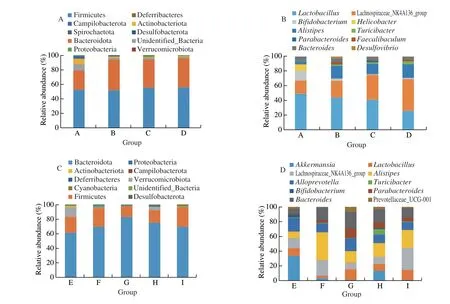
Fig. 6 Microbiota distribution at phylum and genus level in relieving experiments (A, B) and preventing experiments (C, D).
Fig. 7 showed the results ofβ-diversity and polygenic relationships of mouse intestinal flora in obese relieving and preventing experiments, respectively. In the obesity relieving experiments, the intestinal microbiota showed the closest relationship between group A and D (Figs. 7A, C), suggesting that 1% MLIT powder helped to modulate the mouse intestinal flora towards that of the normal mouse. In the obesity preventing experiments, the intestinal microbiota in group E showed the least correlation with that from group F (HFD control), and mouse intestinal microbiota after HFD treatment showed better improvement with the increased amount of MLIT intervention as compared with that of the control group (group E) (Figs. 7B, D).

Fig. 7 Weighted and unweighted β-diversity of mouse intestinal flora in relieving experiments (A) and preventing experiments (B) and polygenic relationships between different groups in obesity relieving experiments (C)and preventing experiments (D).
4. Discussion
In this study, ‘Longsang No. 1’ mulberry leaves were used as the raw material to prepare MLIT powder, which has many advantages such as easiness to carry, well preservation of the active substances and health-promotion effect[25]. It has been reported that amino acids are precursors of many flavor compounds in addition to their health-promoting effects. In our study, various flavor amino acids in MLIT were identified (Table S1). In addition, aspartic amino acid in MLIT powder can prevent hypertension[26]; leucine can be used as a nutritional supplement and flavoring agent[27].γ-Aminobutyric acid has anti-anxiety and anti-depressant effects[28], which was also detected in the MLIT powder. We identified many organic acids in MLIT powder. For example, the docosahexaenoic acid (DHA) is an essential fatty acid, which is helpful for the prevention and treatment of nervous system diseases[29-30].
Previous studies have shown that flavonoids, polyphenols contained in mulberry leaves might be responsible for the antiobesity effects[31]. Among flavonoids, we found dihydroxyflavone,quercetin, isoquercetrin which revealed anti-obesity effects. Quercetin can reduce fat accumulation and blood lipids[32], in addition to preventing cardiovascular disease and regulating intestinal flora[28,33].Taxifolin, also known as dihydroquercetin, is a type of flavonoid with anti-inflammatory[34], antibacterial[35], liver protection[36], and anticancer effects[37]. Chlorogenic acid has lipid-lowering effects and can regulate intestinal flora[38].
Among organic acids, succinic acid was found which participates in tricarboxylic acid cycle and can promote fat burning[33]. In addition,this organic acid can also activate the anti-inflammatory effect of neural stem cells[39].
As one of the important carbohydrates, trehalose is commonly used in food and medicine[40], and can protect the pancreas of diabetic mice and liver from ischemia-reperfusion injury. In addition, studies have shown that xylitol found in MLIT powder has beneficial effects on the regulation of gut microbes and human health[22]. The existence of these substances in MLIT may be the key factors in regulating fat accumulation and intestinal microbiota in mice[41].
HFD can cause fat accumulation, and dyslipidemia. In this experiment, compared with the negative control group, the mediumdose MLIT treatment decreased the fat coefficient, serum TG, and TC level in the relieving experiments. Compared with the negative control group, the HDL content in the low-dose MLIT-treated group increased by 18.97%, and the LDL decreased by 60.85%;the fat coefficient, TG and TC content of mouse in the preventing experiments with high, medium and low dose-MLIT treated groups decreased in a dose-dependent way. MLIT also reduced the Lee’s index of high-fat-induced mice, and improved the serum factor levels,which were in consistent with previous study[42].
The gut microbiota is closely related to human health. Our study found that high fat diet changed the intestinal microbiota both at phylum and genus level. In both obesity relieving and preventing experiments, the mice with MLIT treatments showed similar microbiota structures as revealed by theβ-diversity, revealing the restructured intestinal microbiota with MLIT intervention (Fig. 7),Studies have reported that the colonization ofAkkermansiacan slow down fat deposition and delay diabetes[43].LactobacillusandBifidobacteriumplay an important role in maintaining the balance of glucose and lipid metabolism[44]. It can be seen from our study that after the intervention of MLIT, the abundance of Desulfobacterota and Spirochaetota decreased in the low-dose and medium-dose groups in the relieving experiments, and the abundance of Verrucomicrobiota in the low-dose group increased. After the intervention of MLIT, the abundance of Bacteroidota increased significantly in each dose group in the preventing experiments in a dose-dependent way. The normal group had the highest abundance ofAkkermansiaandBifidobacterium,while the HFD decreased bothAkkermansiaandBifidobacterium,which increased in the middle-dose MLIT. In the preventing experiments, the abundance ofLactobacillusin the negative control group decreased significantly, while this microbe increased significantly after the MLIT intervention, and theLactobacillusabundance in the high-dose MLIT treated group was close to that of the normal group. However, the abundance ofLactobacillusin the relieving experiments did not change much. The above results prove that MLIT can increase the abundance of intestinal beneficial bacteria, and play a role in improving the structure of intestinal flora.The overall lipid-lowering effect in the preventing experiments was superior to that in the relieving experiments.
Based on the lipid-lowering effect and the major components of MLIT in this study, we proposed the possible mechanisms of the MLIT in preventing or relieving obesity as outlined in Fig. 8.Mulberry leaf extracts such as DNJ, flavonoid or polyphenols might be absorbed into the intestinal epithelium cells, then enter liver and adipocytes, where these active compounds and other mulberry leaf extracts act with liver X receptor alpha (LXRα) to regulate fatty acid synthase (FAS) and low density lipoprotein (LPL) gene expression,whereby promoting lipolysis and regulating adipogenic geneC/EBPAandAP2expression to reduce lipid synthesis[45]. Meanwhile,these compounds also upregulate the expression of peroxisome proliferators-activated receptors-α (PPARα) and uncoupling protein 2(UCP2), promoteβ-oxidationin vivoand reduce fat content. In adipocytes, flavonoids and polyphenols can increase adiponectin(ADPN) levels and superoxide dismutase (SOD) enzymes, which in turn reduce lipid synthesis[46]. Flavonoids and polyphenols can also affect the microbiota composition in the intestine, especially promoting the abundance ofAkkermansia[47], and in the colon,substances such as polyphenols secrete more lactic acid by increasingLactobacillusin the intestine, which can enter the colonic epithelium to promote the BMP and Wnt3 pathway, and inhibit the Notch pathway, thus promoting the proliferation of goblet cells and the secretion of the mucin Muc2[48].

Fig. 8 Schematic analysis of mulberry leaf instant tea in the regulation of obesity.
5. Conclusion
The work developed a kind of MLIT with abundant active components. The MLIT showed good hypolipidemic effects via modulation of intestinal microbiota. MLIT intervention could significantly reduce the serum TG level in mice in a dose-dependent way. Although our research has shown that MLIT had hypolipidemic effects and could modulate intestinal microbiota in high-fat model mice, further work should be done on the in-depth analysis of its lipid-lowering mechanism of MLIT.
Declaration of competing interest
All the authors declare that they have no known competing financial interests or personal relationships that could influence the work reported in this paper.
Acknowledgements
This work was supported by the Natural Science Foundation of Heilongjiang Province (LH2021C075), Key Laboratory of Functional Inorganic Material Chemistry (Heilongjiang University), Ministry of Education.
Appendix A. Supplementary data
Supplementary data associated with this article can be found, in the online version, at http://doi.org/10.26599/FSHW.2022.9250113.
杂志排行
食品科学与人类健康(英文)的其它文章
- Betalains protect various body organs through antioxidant and anti-inf lammatory pathways
- Effects of Maillard reaction and its product AGEs on aging and age-related diseases
- Characterization of physicochemical and immunogenic properties of allergenic proteins altered by food processing: a review
- Polyphenol components in black chokeberry (Aronia melanocarpa)as clinically proven diseases control factors—an overview
- Food-derived protein hydrolysates and peptides: anxiolytic and antidepressant activities, characteristics, and mechanisms
- Recent advances in the study of epitopes, allergens and immunologic cross-reactivity of edible mango
