Preparation and characterization of pH-responsive metal-polyphenol structure coated nanoparticles
2024-01-24QileXiYnLingAilingCoYnCoLuyunCi
Qile Xi, Yn Ling, Ailing Co, Yn Co, Luyun Ci
a Key Laboratory of Post-Harvest Handling of Fruits, Food Science Institute, Zhejiang Academy of Agricultural Sciences, Hangzhou 310021, China
b Ningbo Research Institute, College of Biosystems Engineering and Food Science, Zhejiang University, Ningbo 315100, China
c School of Biological and Chemical Engineering, Zhejiang Engineering Research Center for Intelligent Marine Ranch Equipment, NingboTech University, Ningbo 315100, China
d College of Food Science and Engineering, Bohai University, Jinzhou 121013, China
e Hangzhou Customs District, Hangzhou 310007, China
Keywords: Metal Phlorotannins Nanoparticles pH-Responsive Characterization
ABSTRACT In this paper, tannic acid (TA) and Fe3+ were added to form a layer of metal-polyphenol network structure on the surface of the nanoparticles which were fabricated by zein and carbon quantum dots (CQDs) encapsulating phlorotannins (PTN). pH-Responsive nanoparticles were prepared successfully (zein-PTN-CQDs-FeIII).Further, the formation of composite nanoparticles was conf irmed by a series of characterization methods. The zeta-potential and Fourier transform infrared spectroscopy data proved that electrostatic interaction and hydrogen bonding are dominant forces to form nanoparticles. The encapsulation efficiency (EE) revealed that metal-polyphenol network structure could improve the EE of PTN. Thermogravimetric analysis and differential scanning calorimetry experiment indicated the thermal stability of zein-PTN-CQDs-FeIII nanoparticles increased because of metal-polyphenol network structure. The pH-responsive nanoparticles greatly increased the release rate of active substances and achieved targeted release.
1. Introduction
Zein was the main protein in corn, accounting for about 50% of the total protein content currently[1]. Zein had been used to prepare various delivery systems due to its high encapsulation capacity and good biodegradability[2]. There were many methods to prepare zein nanoparticles, including anti-solvent precipitation, composite condensation and spray drying. Among them, the anti-solvent precipitation method was the most commonly used method, which was also used in this paper to prepare nanoparticles. Anti-solvent precipitation (ASP) also known as liquid-liquid dispersion or phase separation. Deionized water droplets were put into zein ethanol aqueous solution (70%–80%), and water accounted for an increasing proportion in this process. The solubility of zein decreased since zein was only dissolved in the binary system of water and ethanol.Combined with the molecular self-assembly characteristics, molecules clustered and formed particles[3].
Phlorotannins (PTN), a kind of unique polyphenols in the ocean,were the main polyphenols existing in brown algae and secondary metabolites of algae. They were composed of phloroglactil monomers with different antioxidant activities and were linked together through the acetomalonic acid pathway. Their molecular weight ranged from 126 Da to 650 kDa[4]. According to the number of hydroxyl groups and the properties of structural connections between phlorogluogl units, PTN could be divided into 6 subclasses: eckols, fuhalols,fucophlorethols, phlorethols, fucols and ishofuhalols[5]. Polyphenols from brown algae had potential biological activities, regulating metabolic disorders, and could be anti-tumor, anti-diabetes, anti-virus,anti-allergy, anti-bacterial, anti-oxidation and anti-inflammatory[6].The anti-inflammatory mechanism of PTN mainly included inhibition of nitric oxide, tumor necrosis factor and interleukin 6 production and expression of nitric oxide synthase and cyclooxygenase 2[7]. PTN also inhibited the activity of inflammatory genes and reduced the mRNA expression of acute and chronic inflammatory markers and Toll-like receptors (TLR4 and TLR9) in 3T3-L1 adipocytes.
Tannic acid (TA) was a kind of weakly acidic polyphenol compound, containing diethylene glycol group, which was connected to the central core of glucose through ester bond, and was an important member of the natural polyphenol family. Tannin was usually divided into 2 groups: hydrolyzable and non-hydrolyzable with different chemical structures. Tannic acid had abundant aromatic rings and hydroxyl groups in chemical structure, which could be modified in many ways. The modification of tannic acid could be divided into 3 main pathways: 1) heterocyclic opening accelerated the rearrangement of chemical structure; 2) -OH groups on the aromatic ring enhanced the reactivity of nucleophilic sites, resulting in electrophilic aromatic substitution; 3) -OH groups react directly.Tannic acid rich hydroxyl groups could be used as hydrogen donors to connect with molecules containing hydrogen receptors forming stronger hydrogen bonds[8]. Tannin could interact with metals,proteins, alkaloids and polysaccharides to perform a variety of physiological and ecological functions.
Supramolecular networks were self-assembled by various molecular interactions (hydrogen bonding, hydrophobic interaction,π-π superposition, electrostatic interaction and metal coordination).Individual metal ligand could provide stable and reversible cross-linking points between polymers to enable self-assembly of polymers[9]. Combining metal ions into supramolecular structures could improve their application performance and had a wide application prospect. It was a very efficient and useful method to encapsulate and deliver polyphenols by using environmental acidbase differences[10]. Tannins could interact with 18 different metal ions (AlIII, VIII, CrIII, MnII, FeIII, CoII, NiII, CuII, ZnII, ZrIV, MoII, RuIII,RhIII, CdII, CeIII, EuIII, GdIIIand TbIII) successfully prepared a robust metal phenolic network (MPN)[11]. The properties of MPN capsules were determined by the coordination metal and could control film thickness, disassembly characteristics and fluorescence behavior[12].This network structure could increase drug loading and had pH response characteristics, which were critical for the release of active substances[13].
Compared with traditional encapsulated technology, polyphenols embeded in nanoparticles had the following advantages: 1) Volume effect and distribution specificity; 2) Surface modified nanocarriers could prolong the half-life in blood and achieve targeted release; 3) The absorption, transport and bioutilization efficiency of small intestinal cells were improved; 4) It could improve the physical and chemical stability of nutrients and avoid their early decomposition under the special pH environment of gastrointestinal and various digestive enzymes;5) The nanosystem was more stable and could prevent agglomeration,precipitation or emulsification of system particles[14].
Nanoparticles were microscopic particles between 1 and 100 nm, usually spherical in structure and composed of a solid polymer matrix. It had good biocompatibility, natural non-toxicity and biodegradability[15]. There were many methods to prepare nanoparticles, including anti-solvent precipitation, liquid-liquid dispersion and phase separation. These preparation methods did not require complex equipment, low preparation conditions and high packaging efficiency[16]. Nanoparticles generally had a core-shell structure, which played an important role in loading, protecting and releasing bioactive substances. There were many substances that could be used as shell structures, such as polysaccharides, protein and aliphatic polyesters. The nuclear structure was generally well suited to encapsulating lipophilic small molecules. Encased bioactive substances could be isolated from the tissue environment, thus avoiding degradation or burst release caused by factors such as pH,temperature, enzymes, etc.
In this study, PTN is encapsulated by zein and CQDs forming zein-PTN-CQDs nanoparticles. Then, TA and Fe3+were introduced to form metal-polyphenol network structure coating the surface of zein-PTN-CQDs nanoparticles. pH-responsive zein-PTN-CQDs-FeIIInanoparticles were prepared successfully. Zein-PTN-CQDs-FeIIInanoparticles are characterized by Fourier transform infrared (FTIR),X-ray diffraction (XRD), differential scanning calorimetry (DSC)and thermogravimetry analysis (TGA). The innovation of this work is based on the use of TA and Fe3+to obtain pH-responsive metalpolyphenol network structure.
2. Materials and methods
2.1 Materials
D-Glucose (97%) and lysine (> 97%) were purchased from Beijing Solarbio Technology Co., Ltd.; zein (97%) was purchased from Shanghai Yuanye Bio-Technology Co., Ltd.; PTN was purchased from Tianmen Hengchang Chemical Co., Ltd. Tannic acid (AR) and FeCl3(99%) were purchased from Shanghai Macklin Biochemical Technology Co., Ltd. Carbon quantum dots (CQDs)were synthesized by glucose and lysine. Other analytical grade reagents were all from Tianjin Fengchuan Chemical Reagent Co., Ltd.
2.2 Preparation of pH-responsive PTN-zein-CQDs nanoparticles
2.2.1 Preparation of CQDs
CQDs were generated by Maillard reaction[17]. First, 0.6 g glucose and 0.6 gL-lysine were dissolved in 40 mL deionized water in an ultrasonic processor (KQ-400 KDE, Kunshan Ultrasonic Instrument Co., Ltd., Kunshan, Jiangsu, China) to form solution which was heated in the microwave for 30 min. During this process, the color of the solution changed from colorless to light yellow, and eventually solid was formed indicating the formation of CQDs. Then, prepared CQDs were dissolved in a small amount of deionized water and centrifuged (10 000 r/min, 10 min) to remove solid precipitate obtaining supernatant which was further filtered by disposable needle filter (0.22 μm hydrophilic membrane). Finally, the supernatant was placed in a dialysis bag and dialyzed in deionized water for 24 h.After that, the supernatant was transferred to a freeze dryer (Free Zone 2.5, Labconco Corporation, Kansas city, Missouri, USA) and dried for one day (-40 °C) to obtain solid pure CQDs. Dried CQDs were kept at 4 °C for further use.
2.2.2 Preparation of pH-responsive zein-FeIII and zein-CQDs-FeIII nanoparticles
Zein (0.1 g) was dissolved in 70% (V/V) ethanol solution to form solution of concentration of 2 mg/mL, adding 500 μL 24 mmol/L tannic acid solution then. After mixing, 500 μL 24 mmol/L FeCl3was added. The solution was stirred with magnetic for 2 h, and then placed in a dialysis bag. After dialysis in pure water for 24 h, zein-FeIIInanoparticles were freeze-dried for later use.
Zein (0.1 g) was dissolved in 70% (V/V) ethanol solution to form solution of concentration of 2 mg/mL. CQDs (0.02 g) were added,and then 500 μL 24 mmol/L tannic acid solution was added. After mixing, 500 μL 24 mmol/L FeCl3solution was added. The solution was magnetically stirred for 2 h, and then placed in a dialysis bag.After dialysis in pure water for 24 h, it was freeze-dried for later use,and zein-CQDS-FeIIInanoparticles were obtained.
2.2.3 Preparation of pH-responsive zein-PTN-FeIII and zein-PTN-CQDs-FeIII nanoparticles
First, 0.1 g zein and 0.01 g PTN were dissolved in 70% (V/V)ethanol solution. Second, the solution was stirred magnetically at 1 000 r/min for 1 h. Third, adding 500 μL 24 mmol/L tannic acid solution. After mixing, adding 500 μL 24 mmol/L FeCl3solution,freeze drying to obtain zein-PTN-FeIIIcomposite particles.
First, 0.1 g zein and 0.01 g PTN were dissolved in 70% (V/V)ethanol solution, and added 0.02 g CQDs. Second, the solution was stirred magnetically at 1 000 r/min for 1 h. Third, adding 500 μL 24 mmol/L tannic acid solution. After mix well, adding 500 μL 24 mmol/L FeCl3solution, freeze drying to obtain zein-PTN-CQDs-FeIIIcomposite particles.
2.3 Characterization of pH-responsive PTN-zein-CQDs nanoparticles
2.3.1 Zeta-potential and particle size
The size and zeta potential of prepared samples were measured by nano-particle analyzer. The sample was diluted to 0.1 mg/mL with deionized water, and particle size obtained was the cumulative average diameter. The temperature was measured at 25 °C for three times.
2.3.2 Encapsulation efficiency (EE) and loading capacity (LC)
Folinol method was used to measure EE and LC of nanoparticles.The gallic acid solution of 0.2 mg/mL was diluted to different concentrations of the standard solution. One milliliter gallic acid solution of different concentrations was mixed with 0.25 mol/L 1 mL folinol stand for 3 min, then adding 2 mL 15% Na2CO3solution standing for 30 min. The absorbance was measured by spectrophotometer at 760 nm to obtain standard curve of gallic acid.
Sample solution (0.1 mg/mL) was prepared, and the absorbance was measured at 760 nm. The content of embedded PTN in the sample was calculated according to the following equation:
2.3.3 TGA
TGA was used to analyze the thermal stability of the prepared nanoparticles. Nitrogen was used as the protective gas and the flow rate was 50 mL/min. The thermogravimetric curve was obtained from 30 to 700 °C at a rate of 10 °C/min.
2.3.4 DSC
DSC was used to measure the thermal shrinkage temperature and thermal value of the sample. About 5 mg freeze-dried samples were weighed and placed in the crucible of a differential scanning calorimeter, sealed with a pressure plate, and heated from 20 to 250 °C with a temperature rise rate of 10 °C/min and nitrogen flow rate of 20 mL/min with an empty crucible as the control.
2.3.5 FTIR spectroscopy
FTIR spectroscopy could be used to obtain the chemical groups on the surface of particles, and the composition of samples could be analyzed according to the different vibration frequencies of different functional groups. A certain proportion of powder to be tested was mixed with potassium bromide and fully grounded in an agate mortar,and then the powder was pressed for testing. The scanning range was generally 400–4 000 cm-1with a resolution of 0.5 cm-1, and each group was repeated 3-5 times.
2.3.6 XRD
XRD was a technique to analyze the structure of crystalline materials. The object to be measured was made into dry powder.During the test, the scanning speed was 4°/min, the scanning range was 5° to 60°, the tube flow of the X-ray generator was 30 mA, the tube pressure was 36 kV, and three were parallel in each group.
2.3.7 Fluorescence spectrum
Deionized water was used to dilute the dispersion solution of composite colloidal particles to 0.2 mg/mL. Fluorescence spectra were scanned by fluorescence spectrophotometer with fluorescence group in zein molecule as probe. The excitation wavelength was 280 nm (excitation tryptophan fluorescence), and the emission wavelength was 290–450 nm. The excitation and emission slit widths were 5 and 3 nm, respectively.
2.3.8 X-ray photoelectron spectroscopy (XPS)
The surface elements of the freeze-dried samples were analyzed by XPS. Test conditions were: aluminum target (1 486.7 eV), high voltage 14.0 kV, power 250 W, pass energy 93.9 eV. Full scan is performed within 0–1 000 eV.
2.4 Statistical analysis
Univariate analysis of variance (ANOVA) analysis of all quantitative data (P< 0.05) was followed by the Duncan multiple range test, expressed as mean ± standard deviation (SD) (SPSS 22.0, SPSS Inc., Chicago, IL, USA). All figures were drawn using OriginPro 9.0 (OriginLab Co., Northampton, MA, USA). The datasets generated and/or analyzed during the current study are available from the corresponding author on reasonable request.
3. Results and discussion
3.1 Zeta-potential and particle size
The particle size and potential of pH-responsive metal ion-coated nanoparticles are shown in Fig. 1. After introducing tannic acid and Fe3+into zein, the particle size was 957.33 nm and the potential was 7.12 mV. After the addition of CQDs and PTN, the particle size decreased to 717.63 and 559.93 nm, respectively, and the potential was negative (-4.42 mV) and positive (9.93 mV), which may be due to the electrostatic interaction between negatively charged CQDs and positively charged zein. The particle size decreased and the potential became negative. PTN tended to bind more tightly to proline-rich zein and formed a more compact structure. After the combination of zein,CQDs and PTN, the particle size was significantly reduced to 428.40 nm(P< 0.05). On the one hand, the electrostatic repulsion increased due to the increase of potential. On the other hand, a more intense interaction between three substances occurred and the addition of tannic acid and Fe3+formed a layer of polyphenol-metal encapsulation network on the surface of nanoparticles[8,18]. These results indicated that the addition of tannic acid and Fe3+could form nanoparticles with smaller particle size. Besides, SEM and TEM images of zein-FeIII,zein-CQDs-FeIII, zein-PTN-FeIII, zein-PTN-CQDs-FeIIInanoparticles were inserted in Fig. 2.

Fig. 1 Mean size (a) and zeta-potential (b) of zein-FeIII, zein-CQDs-FeIII,zein-PTN-FeIII, zein-PTN-CQDs-FeIII nanoparticle. Different lowercase letters indicate significant differences (P < 0.05).

Fig. 2 SEM and TEM images of zein-FeIII (a, e), zein-CQDs-FeIII (b, f),zein-PTN-FeIII (c, g), zein-PTN-CQDs-FeIII (d, h) nanoparticles.
3.2 EE and LC
The determination of EE and LC could effectively explain the embedding situation of polyphenols. Fig. 3 showed the EE and LC of zein-PTN-FeIIIand zein-PTN-CQDs-FeIII. The figure showed that the embedding rates of zein-PTN-FeIIIand zein-PTN-CQDs-FeIIIare 76.16% and 87.72% respectively, which was slightly higher than the EE of zein-PTN and zein-PTN-CQDs nanoparticles without tannic acid and Fe3+. This was due to the presence of tannic acid and Fe3+.There were multiple phenolic hydroxyl groups in the structure of tannic acid, and phenolic hydroxyl groups could have complexation and electrostatic interaction with Fe3+, forming supramolecular network structure on the surface of nanoparticles, and TA and Fe3+had synergistic effect on the encapsulation of polyphenols. The embedding rate of zein-PTN-CQDs-FeIIIwas higher than that of zein-PTN-FeIIIbecause the addition of CQDs provided more interaction sites and formed a more compact structure, tightly wrapping the PTN, which was consistent with the measurement results of particle size. The loading rates of zein-PTN-FeIIIand zein-PTN-CQDs-FeIIIare 8.96% and 6.83%, respectively, because the addition of CQDS increases the mass of nanoparticles after drying.According to the formula of loading rate in Equation 2, the LC of the latter decreased[19].
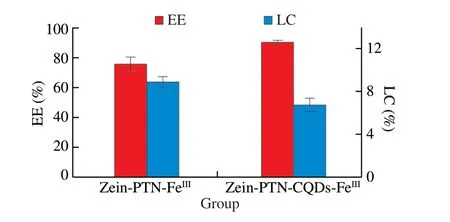
Fig. 3 EE and LC of zein-PTN-FeIII and zein-PTN-CQDs-FeIII nanoparticles.
3.3 TGA
TGA was to analyze whether a substance was dehydrated,decomposed and vaporized according to the mass change in the heating process[20]. Thermogravimetric curves of zein-FeIII, zein-CQDs-FeIII, zein-PTN-FeIIIand zein-PTN-CQDs-FeIIIwere shown in Fig. 4. As could be seen from Fig. 4, the mass loss of the four nanoparticles could be roughly divided into three stages. In the zein-FeIIIcurve, the first stage was between 50 and 250 °C, with only a slight weight loss (4%) due to the loss of free and bound water of the nanoparticles; The second stage was 250 to 574 °C, where mass loss was very high (81%) due to thermal decomposition of zein. The final stage was from 574 to 690 °C, during which the mass loss remains about the same, leaving only some solid residue to decompose at a very slow rate. After the addition of CQDs and PTN, zein-CQDs-FeIII,zein-PTN-FeIIIand zein-PTN-CQDs-FeIIInanoparticles were not very different from zein-FeIIInanoparticles in the first and third stages.But the mass loss in the second phase was 67%, 68%, and 63%,respectively. This indicated that zein-CQDs-FeIII, zein-PTN-FeIIIand zein-PTN-CQDs-FeIIInanoparticles had higher thermal stability than zein-FeIIInanoparticles. In particularly, zein-PTN-CQDs-FeIIInanoparticles had the highest thermal stability[21].

Fig. 4 TGA thermogram of zein-FeIII, zein-CQDs-FeIII, zein-PTN-FeIII,and zein-PTN-CQDs-FeIII nanoparticles.
3.4 DSC
The thermal properties of zein-FeIII, zein-CQDs-FeIII, zein-PTN-FeIIIand zein-PTN-CQDs-FeIIInanoparticles were studied by DSC.DSC curves and denaturation temperature (Tm) and enthalpy change (ΔH) of the four nanoparticles were shown in Fig. 5 and Table 1, respectively. The first peak of the four curves was smaller than the second peak in bothTmand ΔH. The first peakTmof zein-FeIIInanoparticles was 64.08 °C and ΔHwas 8.31 J/g. With the addition of CQDs and PTN,Tmand ΔHwere significantly increased to 67.45 and 70.86 °C, respectively, and 9.42 and 10.35 J/g,respectively (P< 0.05), indicating that the addition of CQDs and PTN could improve the thermal denaturation resistance of nanoparticles.When CQDs and PTN were added at the same time,Tmand ΔHincreased further,Tmincreased to 72.09 °C, ΔHincreased to 10.83 J/g,indicating that the addition of CQDs and PTN at the same time could improve the thermal denaturing ability of nanoparticles more than the addition of PTN alone. The second peak of zein-FeIIInanoparticles was thermal denaturated at 121.15 °C, and ΔHwas 85.81 J/g.Compared with CQDs and PTN alone, the stable structure of zein-FeIIInanoparticles was formed by the interaction between CQDs and PTN at the same time.Tm(135.15 °C) and ΔH(102.25 J/g) were improved.The thermal stability was improved. The zein-PTN-CQDs-FeIIIcurve has two peaks and the thermal denaturation temperature of the second peak (135.15 °C) increases, which may be because the addition of TA and Fe3+causes the thermal denaturation of nanoparticles at 72.09 °C.TA and Fe3+formed a metal-polyphenol network on the surface of nanoparticles to improve their thermal resistance[22].

Table 1 Thermal denaturation temperature and enthalpy of zein-FeIII, zein-CQDs-FeIII,zein-PTN-FeIII, and zein-PTN-CQDs-FeIII nanoparticles.
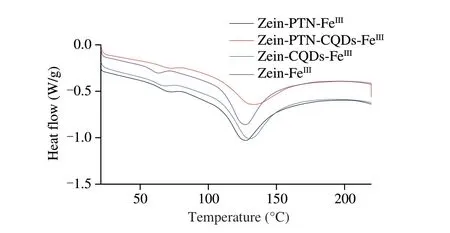
Fig. 5 DSC thermogram of zein-FeIII, zein-CQDs-FeIII, zein-PTN-FeIII,and zein-PTN-CQDs-FeIII nanoparticles.
3.5 FTIR spectroscopy
Infrared spectroscopy was used to study the interactions among zein, PTN, CQDs and TA, and to explore the interactions that occurred during the formation of nanoparticles. Bands in the spectrum could be connected with specific functional groups in related molecules[23]. Zein-FeIII, zein-CQDS-FeIII, zein-PTN-FeIII, zein-PTNCQDs-FeIIIand the infrared spectra of zein, PTN and TA were shown in Fig. 6. The hydrogen bond characteristic peak of zein at 3 346 cm-1shifted to 3 425, 3 439, 3 448 and 3 404 cm-1in the infrared curves of zein-FeIII, zein-CQDs-FeIII, zein-PTN-FeIIIand zein-PTN-CQDs-FeIII,respectively, which represented the formation of hydrogen bonds. The amide I band of zein (1 647 cm-1) represented the stretching vibration of C=O, and moved to the vicinity of 1 652 cm-1in all 4 curves, and the intensity of zein-PTN-CQDs-FeIIIcurve was greater than that of the other three curves. This might be due to the stronger hydrogen bond and hydrophobic interaction formed by the simultaneous addition of PTN and CQDs. In addition, the vibration of TA at 3 417 cm-1was caused by O-H stretching vibration. Representing carboxyl and carbonyl groups at 1 715, 1 611 and 1 534 cm-1represent -C=C- groups in the aromatic ring. The peak at 1 448 cm-1represented the deformation of -C-C- in phenol; 1 324 cm-1represented the phenol group; 1 203 cm-1represents C-H bond,1 088 cm-1represented the deformation of -C-O- in phenol;1 031 cm-1represented the deformation of C-H; peaks at 868 and 757 cm-1represented the C-H bond on the benzene ring. But these characteristic peaks disappeared after the nanoparticle was formed.This indicated that TA was involved in the formation of nanoparticles and interacts with zein, PTN and CQDs[24].

Fig. 6 FTIR of zein-FeIII, zein-CQDs-FeIII, zein-PTN-FeIII, zein-PTN-CQDs-FeIII nanoparticles (a), and zein powder, TA powder (b).
3.6 XRD
XRD was usually used to evaluate the crystallinity of the encapsulated or biopolymer matrix[25]. Fig. 7 showed the XRD patterns of FeCl3, TA, zein-FeIII, zein-CQDs-FeIII, zein-PTN-FeIIIand zein-PTN-CQDs-FeIII. FeCl3has sharp peaks at 14.78°, 15.18°,28.12°, 36.74° and 46.42°, indicating that FeCl3was in a highly crystalline state. The wide peak at 24.52° indicates that TA was in an amorphous state. However, zein-FeIII, zein-CQDs-FeIII, zein-PTNFeIIIand zein-PTN-CQDs-FeIIIshowed a new wide peak at 21.12°,and the crystallization peak of FeCl3disappeared. This indicated that metal ion-polyphenol network was formed between FeCl3and TA, and the coated film was formed on the surface of nanoparticles,and the nanoparticles formed were in an amorphous state. The 4 curves of zein-CQDS-FeIII, zein-PTN-FeIII, zein-PTN-CQDs-FeIIIand zein-FeIIIwere similar, but the intensity of the first three peaks was higher than that of zein-FeIII. This indicated that the interaction during the formation of zein-FeIIInanoparticles was not as strong as that of the first three nanoparticles. In addition, compared with zein-FeIII,zein-CQDs-FeIIIand zein-PTN-FeIII, the curves of zein-PTN-CQDs-FeIIInanoparticles showed a new small peak at 58.72°. The emergence of new peaks indicated that intermolecular interactions occured between FeCl3, TA, zein, PTN and CQDs, and the intermolecular interactions changed the physical states of each substance before the reaction[26]. The above results indicated that zein-PTN-CQDs nanoparticles could be formed by adding FeCl3and TA based on intermolecular interaction.
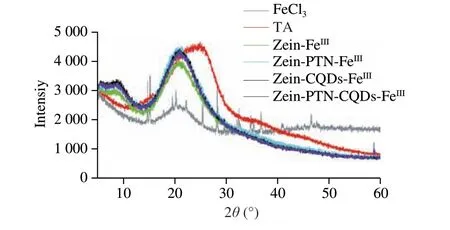
Fig. 7 XRD spectra of FeCl3, TA, zein-FeIII, zein-CQDs-FeIII, zein-PTN-FeIII,zein-PTN-CQDs-FeIII nanoparticles.
3.7 Fluorescence spectrum
Fluorescence spectroscopy was a technique widely used to study proteins and peptides. Aromatic amino acids, such as tryptophan,tyrosine and phenylalanine, had inherent fluorescence and could provide information on protein conformation, dynamics and intermolecular interactions. In this paper, the interaction between biopolymers was studied by analyzing the fluorescence intensity of tryptophan residues, which were highly sensitive to changes in the surrounding environment of proteins, excited at 280 nm[19]. Fig. 8 showed the fluorescence spectra curves of zein-FeIII, zein-CQDs-FeIII, zein-PTN-FeIIIand zein-PTN-CQDs-FeIII. After the addition of TA and Fe3+, the fluorescence emission peak shifted to the vicinity of 340 nm and the fluorescence intensity was also enhanced. On the one hand, the addition of TA and Fe3+made the denaturation of zein greater, and the fluorescence chromogenetic group inside, namely tryptophan, was more exposed. On the other hand, there were many phenolic hydroxyl groups and aromatic rings in the structure of PTN and TA, which increased the number and degree of thickening of rings[27]. Compared with TA and Fe3+alone, the fluorescence intensity was stronger when TA and Fe3+were added at the same time, which might be because TA and Fe3+were water-soluble substances, and the polar environment of the protein was changed when TA and Fe3+were added at the same time, and the fluorescent chromogenic groups inside the protein were more exposed to the polar environment, and the fluorescence intensity increased[28].

Fig. 8 Fluorescence spectra of zein-FeIII, zein-CQDs-FeIII, zein-PTN-FeIII, and zein-PTN-CQDs-FeIII nanoparticles.
3.8 XPS
The nanoparticles were characterized by XPS, which could be used to analyze the types of elements on the surface of nanomaterials[21]. Fig. 9 showed the XPS spectra of each substance.Fig. 9a was the XPS spectrum of zein. It could be seen from the figure that the signal of C, N and O elements on zein surface was very strong, indicating the existence of these three elements. Zein was composed of a large number of amino acids, among which the carboxyl group (-COOH) and the amino group (-NH2) contain a large number of C, N and O elements. After the addition of PTN and CQDs (Fig. 9b), the peak intensity of O signal and N signal increased significantly, while the intensity of C signal decreased slightly. C1spectrum includes 4 peaks of C-C/C-H (284.88 eV),O-C-O (287.97 eV), and C-O-H (286.54 eV) (Fig. 9d).O1sspectrum includes three peaks C=O (531.51 eV), C-O-H/C-O-C(533.43 eV) and O-H (532.33 eV) (Fig. 9e), and N1sspectrum includes two peaks N-H (401.45 eV) and C-N-C (399.51 eV)(Fig. 9f)[26]. After modification with TA and Fe3+, a weak Fe signal peak appeared at 702.94 eV. Meanwhile, compared with the XPS spectra of zein-PTN-CQDS, the C1sspectrum had a more C=N signal peak (289.25 eV) (Fig. 9c). In the C1sspectrum of zein-PTN-CQDSFeIII, C-C/C-H peak at 284.88 eV, C-O-H peak at 286.54 eV,O-C-O peak at 287.97 eV, O=C-O peak at 288.41 eV. At 289.25 eV,there was a peak C=N (Fig. 9g); In O1sspectrum, C=O peak at 531.52 eV, O-H peak at 533.82 eV, C-O-H/C-O-C peak at 532.75 eV(Fig. 9h); In N1sspectrum, there was a C-N-C peak at 400.62 eV and an N-H peak at 402.35 eV (Fig. 9k). Based on the type distribution of surface elements and the binding energy and strength of various chemical bonds, it could be concluded that TA and Fe3+form a layer of polyphenol-metal encapsulation network on the surface of nanoparticles[16].
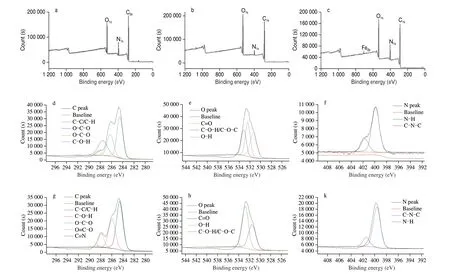
Fig. 9 XPS spectra of zein (a), zein-PTN-CQDs (b), zein- PTN-CQDs-FeIII (c), zein-PTN-CQDs C1s (d), zein-PTN-CQDs O1s (e), zein-PTN-CQDs N1s (f),zein-PTN-CQDs-FeIII C1s (g), zein-PTN-CQDs-FeIII O1s (h), zein-PTN-CQDs-FeIII N1s (i).
4. Conclusion
In the present study, pH responsive zein-PTN-CQDSFeIIInanocomposites are prepared to improve the stability and bioavailability of PTN and a series of methods (FTIR, XRD, DSC,TGA and XPS) are used to characterize the nanoparticles. The zein-PTN-CQDS-FeIIIsupramolecular systems are formed by noncovalent interactions, offering improvement of PTN physicochemical properties as water solubility, thermal stability and its slow release in biological systems. Additionally, TA and Fe3+formed metalpolyphenol network structure endowed nanoparticles with pH response characteristics, which made nanoparticles stable under neutral condition while disintegrated under acidic conditions. This work is of great potential for pH-responsive nanoparticles as delivery vehicle for bioactive compounds.
Conflict of interests
The authors declare that they have no known competing financial interests or personal relationships that could have appeared to influence the work reported in this paper.
Acknowledgements
This study is supported by the National Key R&D Program of China (2018YFD0901106), the Wenzhou Major Science and Technology Project (ZN2021002) and the Ningbo “3315 series program” for high-level talents (2020B-34-G).
杂志排行
食品科学与人类健康(英文)的其它文章
- Betalains protect various body organs through antioxidant and anti-inf lammatory pathways
- Effects of Maillard reaction and its product AGEs on aging and age-related diseases
- Characterization of physicochemical and immunogenic properties of allergenic proteins altered by food processing: a review
- Polyphenol components in black chokeberry (Aronia melanocarpa)as clinically proven diseases control factors—an overview
- Food-derived protein hydrolysates and peptides: anxiolytic and antidepressant activities, characteristics, and mechanisms
- Recent advances in the study of epitopes, allergens and immunologic cross-reactivity of edible mango
