Fecal DNA metabarcoding reveals the dietary composition of wintering Red-crowned Cranes (Grus japonensis)
2024-01-22HongyiLiuWiXuNnXuWnwnZhngHomingJingYongqingZhoChnghuLuYingZhuPngXu
Hongyi Liu, Wi Xu, Nn Xu, Wnwn Zhng, Homing Jing, Yongqing Zho,Chnghu Lu, Ying Zhu, Png Xu
aThe Co-Innovation Center for Sustainable Forestry in Southern China,College of Life Sciences,Nanjing Forestry University,Nanjing,210037,China
bAdministration Station of Castanopsis Kawakamii Nature Reserve in Xinkou of Sanming,Sanming,365000,China
cResearch Center for Biodiversity Conservation and Biosafety,State Environmental Protection Scientific Observation and Research Station for Ecological Environment of Wuyi Mountains,Biodiversity Comprehensive Observation Station for Wuyi Mountains,State Environmental Protection Key Laboratory on Biosafety,Nanjing Institute of Environmental Sciences,Ministry of Ecology and Environment of China,Nanjing,210042,China
dJiangsu Yancheng Wetland National Nature Reserve,Yancheng,224057,China
eInstitute of Qinghai Tibetan Plateau,Southwest Minzu University,Chengdu,610041,China
fWetland College,Yancheng Teachers University,Yancheng,224051,China
Keywords:Dietary composition Dietary niche Metabarcoding Molecular diet analysis Red-crowned Crane
ABSTRACTUnderstanding the diet of threatened wildlife is vital for species-specific conservation and habitat management measures.The Red-crowned Crane (Grus japonensis) is a vulnerable bird distributed in Northeast Asia.Previous dietary studies of this bird focused mainly on its plant food composition based on field observations and microhistological identification.Herein, a total of 45 fecal samples were collected in November, December and January (15 fecal samples each month) from wintering cranes, and then subjected to a high throughput sequencing meta-barcoding approach to determine the primary plant (rbcL) and animal (COI) food items in their diet.A total of 230 operational taxonomic units (OTUs) of plant foods and 371 OTUs of animal foods were obtained.The main plant foods in the wintering period wereMiscanthus,Zea, andHordeumgenera, which were similar to those in the breeding and the migration periods.Both agricultural and natural plants were detected,indicating a relatively broad dietary niche for this crane species.However, the main animal foods were representatives of Theridiidae, Megascolecidae, and Agelenidae, in sharp contrast to previous studies.The higher number of small terrestrial arthropods in animal foods might be due to the indirect intake of plants.The composition of both plant and animal foods in the diet showed the highest diversity in December, while it was homogeneous in January.The plant ofZeagenus became the main source of nutrition in late winter, as supplementary feeding was performed in the reserve, which could help Red-crowned Cranes to get through the cold season.The results obtained in this work would contribute to the development of effective conservation strategies for the Red-crowned Crane.
1.Introduction
The Red-crowned Crane (Grus japonensis), a large wading bird with an iconic red-colored head, is distributed in Northeast Asia (Xu et al.,2020a; Ye et al., 2021; Zhou et al., 2021).This bird is an important part of traditional culture in Northeast Asia (Lee et al., 2020).It was previously designated as “endangered species” and has been demoted to“vulnerable species” in recent years (Zhao et al., 2022; Xu et al., 2023).Populations of the Red-crowned Crane can be divided into two distinct groups based on differences in their geographical distribution and life history, namely, the migratory population on the Asian continent and the non-migratory population in Japan (BirdLife International, 2021).The continental population can be further divided into a subpopulation wintering in China and another wintering in the Korean Peninsula (Xu et al., 2022).Populations of the Japanese and Korean Peninsula have been consistently increasing.However, the Chinese population has declined rapidly over at least the past three decades (Li et al., 2020;BirdLife International, 2021).
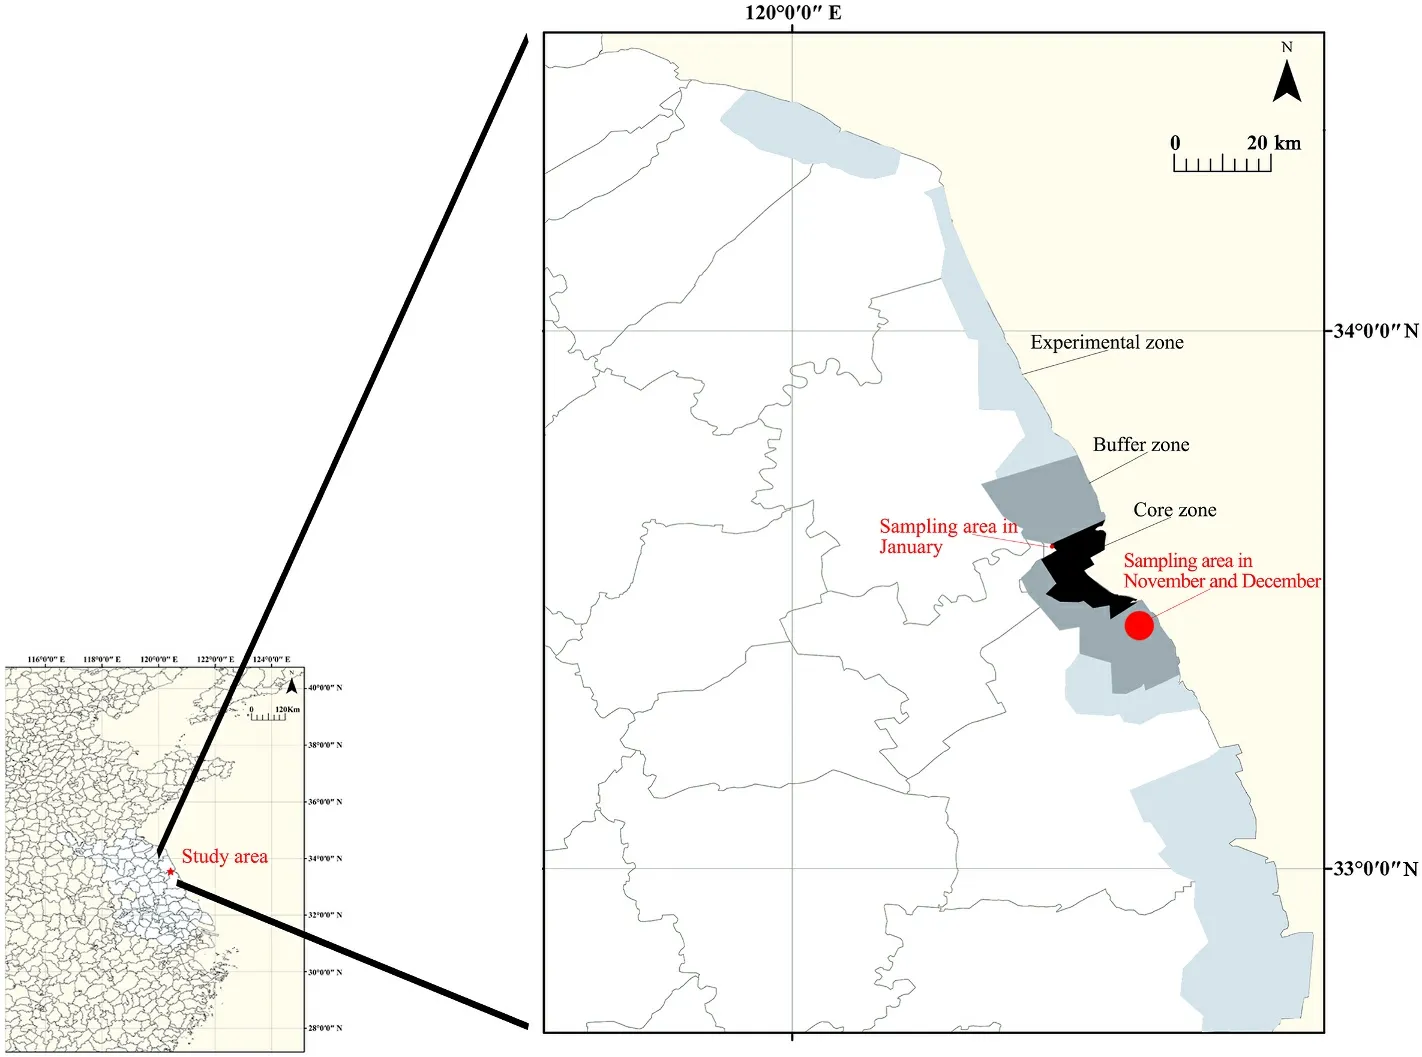
Fig.1.Map of the study area and the sampling points.
Regarding the protection of Red-crowned Cranes in China, studies have suggested that the focus should be on preventing habitats from being destroyed (Wang et al., 2020; Xu et al., 2020b; Hemminger et al.,2022).Suitable habitats and optimal environmental conditions are important to support the survival of threatened species, and the availability of food resources within the habitat are one of the most important indicators of habitat suitability (Wang et al., 2021).Dietary analysis plays a crucial role in the feeding ecology and trophic interactions of a species, providing basic information for species conservation and management (Montoya et al., 2006), particularly under supplementary feeding regimes (Jordan, 2006).Food adequacy is a guarantee for the survival of wintering birds.Therefore, investigating the dietary composition can provide basic information for the ecology and evolution of species such as the Red-crowned Crane, as well as the development of species-specific conservation strategies (Tang et al., 2022).Although some studies have addressed the effects of diet on the gut microbiome or parasites (Xie et al., 2016; Ran et al., 2020), a more systematic and direct analysis of food composition is needed for the Red-crowned Crane.Before the emergence of DNA metabarcoding, scholars often studied the dietary composition of Red-crowned Cranes by direct observation and fecal microscopy (Li et al., 2014).The majority of studies focused on plant foods in this regard; for example, adult Red-crowned Cranes were revealed to forage on weed seeds and grain seeds (Luo et al., 2015).In contract, few kinds of animal food were recorded in the diet of Red-crowned Cranes , since these are more easily digestible and the research methods were limited.Nevertheless, animal food is also an important part of the dietary composition for omnivorous birds.Therefore, information on animal food items in the diet of Red-crowned Crane is highly useful for its conservation (Wang et al., 2022a).
The accurate and effective characterization of the complex diet composition of birds through traditional methods such as gastrointestinal dissection or manual monitoring data presents significant challenges (Yoshikawa and Osada, 2015; Tang et al., 2022).In addition, it is not feasible to obtain the dietary composition of threatened birds using destructive methods.At present, DNA metabarcoding methods based on high-throughput sequencing are more commonly used (Bourbour et al.,2021; Garfinkel et al., 2022).This approach not only minimizes harm caused to animals (Kartzinel and Pringle, 2015), but also allows for the more efficient and accurate identification of dietary information within the feces (Nota et al., 2019; Garfinkel et al., 2022).Many studies on the dietary composition of threatened birds have been performed using DNA metabarcoding methods.For example, the dietary composition of Mandarin Duck (Aix galericulata) and Common Crane (Grus grus) were revealed by sequencing DNA from feces (Wang et al., 2022; Zhao et al.,2023).In this study, we used DNA metabarcoding to quantify animal and plant foods consumed by Red-crowned Cranes during winter.The findings provide great contribution to understanding the dietary composition of wintering Red-crowned Cranes, and in turn the conservation efforts and recovery of this threatened species.
2.Materials and methods
2.1.Study area
All fecal samples were collected from the Yancheng National Nature Reserve (YNNR, 32◦48′47″-34◦29′28″N, 119◦53′45″-121◦18′12″E).YNNR is one of the world’s largest winter habitats for the Red-crowned Crane, covering a total area of 2472.6 km2in Jiangsu Province of coastal China (Xu et al., 2019; Gong et al., 2020).It is divided into core zone,buffer zone and experimental zone.The core zone mainly consists of natural coastal wetland habitat, while the buffer zone includes farmlands and natural and artificial wetlands (Gong et al., 2020).The plants grown on farmlands around YNNR are mainly rice (Oryza sativa) and wheat (Triticum aestivum).After the rice harvest, the planting of winter wheat is begun from October in some farmlands, and others are left as fallow.Red-crowned Cranes might forage in the farmlands where they might contact damage from poisons (BirdLife International, 2021).Therefore, the farmlands surrounding YNNR can be roughly categorized into two types: farmlands planted with winter wheat and farmlands fallowed during the winter.In addition, supplementary feeding was conducted in late winter in YNNR.The staff at the reserve mainly fed corn (Zea mays) and barley (Hordeum vulgare) to the cranes.The planting of crops and supplementary feeding had certain influence to the dietary composition of the Red-crowned Cranes in YNNR (Xu et al., 2020b; Zhao et al., 2023).
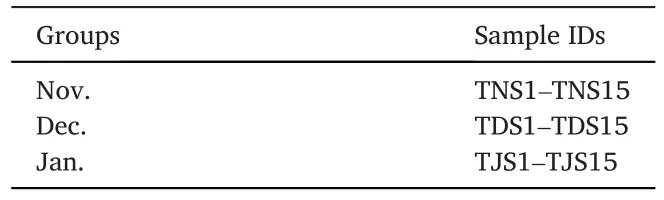
Table 1Fecal samples of Nov., Dec.and Jan.groups of this study.
2.2.Sample collection and DNA extraction
Red-crowned Cranes were often seen in the farmlands of the south buffer area in November and December 2021.They collectively visited the feeding place in January 2022, because the supplementary feeding was conducted from late December 2021.This field is a piece of wetland lying on the edge of the core area.Therefore, sampling was performed in the south buffer area and the feeding place (Fig.1).In addition, there were a large number of Common Cranes and a few White-naped Cranes(G.vipio) in the area; mixed flocks of Red-crowned Cranes and other cranes often foraged together.To ensure that the fresh fecal samples belonged to Red-crowned Cranes, sampling was performed close enough to the crane flocks.When the crane flock was spotted, the sampling staff used the surrounding vegetation as cover.Then, we approached the flock gradually to determine the location of Red-crowned Crane activity.If the cranes stopped foraging and raised their heads, we would slowly retreat until they foraged again.Within a distance of about 500 m, the cranes and their location could be well determined.The activity location and habitat types were recorded and the activity of cranes were photographed every 10 min (Fig.2).Fecal samples were collected from the ground of farmlands and feeding place once the cranes flied away.To avoid the contamination from soil to a maximum extent, only the upper and middle layers of feces were collected.The samples were put in tubes and labelled, placed in liquid nitrogen, and then brought back to the laboratory and stored in a -80◦C refrigerator.In this study, 263 fecal samples were collected during the wintering period of Red-crowned Cranes in 2020 and 2021, including 93 samples in November 2020(Nov.group), 91 samples in December 2020 (Dec.group), and 79 samples in January 2021 (Jan.group).The freshest and the least contaminated 30 fecal specimens from each group were selected for species identification by the mitochondrial Cytbgene.Fecal genomic DNA was extracted using the TIANamp Stool DNA Kit (TIANGEN, Beijing, China).The primer design and PCR were conducted following the description of Zhao et al.(2023).After further determination and removing the fecal samples from other cranes, 15 high-quality samples from each group were selected for subsequent experiments (Table 1).
2.3.PCR amplification,library construction and sequencing
The PCR amplification, library construction and sequencing steps were conducted at Shanghai Personalbio Technology Co., Ltd.(Shanghai, China).Universal primers were selected for the rbcL of the plant chloroplast and COI of the animal mitochondrion (Z1aF: 5′-ATG TCA CCA CCA ACA GAG ACT AAA GC-3′, hp2R: 5′-CGT CCT TTG TAA CGA TCA AG-3′ and COIintF: 5′-GGW ACW GGW TGA ACW GTW TAY CCY CC-3′, COIjgHCO2198: 5′-TAN ACY TCN GGR TGN CCR AAR AAY CA-3′) (Hofreiter et al., 2000; Geller et al., 2013; Leray et al., 2013).PCR amplification was performed in a total of 25 μL volume containing 0.25 μL Q5 high-fidelity DNA polymerase, 5 μL 5 ×Reaction Buffer, 5 μL 5 ×High GC Buffer, 2 μL dNTP, 2 μL DNA, 1 μL forward primer, 1 μL reverse primer, and 8.75 μL water.The PCR program consisted of initial denaturation at 98◦C for 30 s, followed by 25 cycles at 98◦C for 15 s, 50◦C for 30 s, and 72◦C for 30 s, with a final extension at 72◦C for 5 min.Library construction was done using the TruSeq Nano DNA LT Library Prep Kit (Illumina, USA).The libraries were sequenced using MiSeq Reagent Kit V3 (600 cycles) by Shanghai Personalbio Technology Co.,Ltd.
2.4.Bioinformatic processing and statistical analyses
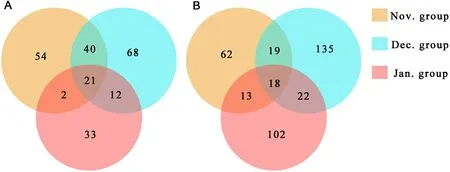
Fig.3.Venn diagram showing the shared OTUs of plant foods (A) and animal foods (B) among the three months.
The sequences were annotated based on BLAST (https://blast.ncbi.nl m.nih.gov/Blast.cgi) in the NCBI to obtain operational taxonomic units(OTUs).Some OTUs of plants and animals not existing in the YNNR and some algae were removed.The common OTUs shared by all groups were analyzed by the R package “VennDiagram” (Chen and Boutros, 2011).Sample clustering was conducted using QIIME 2 (Caporaso et al., 2010).Alpha diversity (Chao 1, Shannon, Simpson, and Observed species)matrices were performed using QIIME2 and visualized using the ggplot 2 R package.Beta diversity was calculated using Principal Coordinate Analysis (PCoA) based on Bray-Curtis distance matrices.Sankey diagram was drawn by the genescloud tool, a free online platform for data analysis (https://www.genescloud.cn).As the relative abundance of dominant animal and plant foods did not follow normal distribution,Mann–WhitneyUtest and Kruskal–WallisHtest were performed using IBM SPSS Statistics software (Moayyedi et al., 2015; Liu et al., 2019;Sherwani et al., 2021).P≤0.05 indicated statistical significance.Bar charts were created using OriginPro software (Seifert, 2014).
3.Results
3.1.Sequencing results
A total of 45 rbcL and 45 COI barcode amplicons were successfully sequenced using the Illumina platform.The libraries generated 5,207,391 and 4,750,854 raw sequences based on rbcL and COI amplification, respectively, which were reduced to 4,549,775 and 4,444,807 sequences, respectively, after quality filtering.A total of 848 and 2564 OTUs annotated were obtained, respectively, and these OTUs were manually screened.Finally, a total of 230 and 371 OTUs, respectively,were retained for subsequent analysis (Fig.3).
Fig.5.Alpha diversity of plant foods (A) and animal foods (B) in different months.
3.2.Dietary composition
The plant food items of Red-crowned Crane originated from two phyla, three classes, 22 orders, 35 families, 62 genera, and 56 species.The source plants mainly consisted of Poaceae (64.12%), Cyperaceae(9.12%) and Tamaricaceae (6.19%).Given that most OTUs of plant foods were identified to the genus level, a histogram was drawn using the top 15 genera ranked in relative abundance (Fig.4A).The top three genera wereMiscanthus(28.81%),Zea(14.84%) andHordeum(13.65%).The animal food items of Red-crowned Crane included five phyla, 14 classes, 56 orders, 154 families, 83 genera, and 38 species.Given that most OTUs were identified to the family level, a histogram was drawn using the top 15 families ranked in relative abundance (Fig.4B).The top five families were Theridiidae (11.83%), Megascolecidae (11.43%),Agelenidae (10.50%), Amaurobiidae (4.48%), and Naididae (4.08%).
3.3.Temporal variation in diet
For plant foods, the lowest alpha diversity was detected in December(Fig.5A).However, for animal foods, the alpha diversity was the highest in December (Fig.5B).PCoA analyses showed that plant foods formed clusters in January (Fig.6A).For animal foods, the samples clustered together in January, while samples in November and December were relatively dispersed (Fig.6B).
Among the plant foods, a total of 32 families, 45 genera and 41 species were identified in the Nov.group; 32 families, 44 genera and 49 species were identified in the Dec.group; 21 families, 35 genera and 32 species were identified in the Jan.group.The top three genera in the Nov.group wereHordeum(33.94% ± 35.20%) (mean ± standard deviation),Carex(11.98% ± 25.01%) andOryza(10.21% ± 10.74%);those in the Dec.group wereTamarix(18.11% ± 30.90%),Miscanthus(17.94% ± 27.40%) andCarex(15.36% ± 30.45%); those in the Jan.group wereMiscanthus(58.80% ± 14.39%),Zea(39.45% ± 12.25%)andOryza(1.15% ±4.18%).The plant foods of Red-crowned Cranes in January mostly consisted of representatives ofMiscanthusandZea(Fig.4a).The diversity of plant foods was higher in November and December than in January of the following year.The similarity of plant foods in November and December was also higher than that in January of the following year (Fig.3).The Sankey diagram reflected the flow of the same food consumed by Red-crowned Cranes in each month (Fig.7).The plants found with more than or equal to 5 samples in each month were categorized as 5–10 samples and 11–15 samples.Plant species ofHordeum,MiscanthusandOryzawere in the corresponding grouping of 11–15 samples for each month.Plants ofHordeum,Miscanthus,Oryza,andZeawere mostly found in the Nov.group; plants ofHordeum,Miscanthus,Oryza,Polypogon, andTamarixwere mostly found in the Dec.group; plants ofHordeum,Miscanthus,Oryza, andZeawere common in the Jan.group.The bar charts showed the error of the relative abundance of dominant genera and the significance for the three months.The plant foods (top 5) varied significantly between the months of the wintering period (Fig.8A).

Fig.6.Beta diversity of plant foods (A) and animal foods (B) in different months.
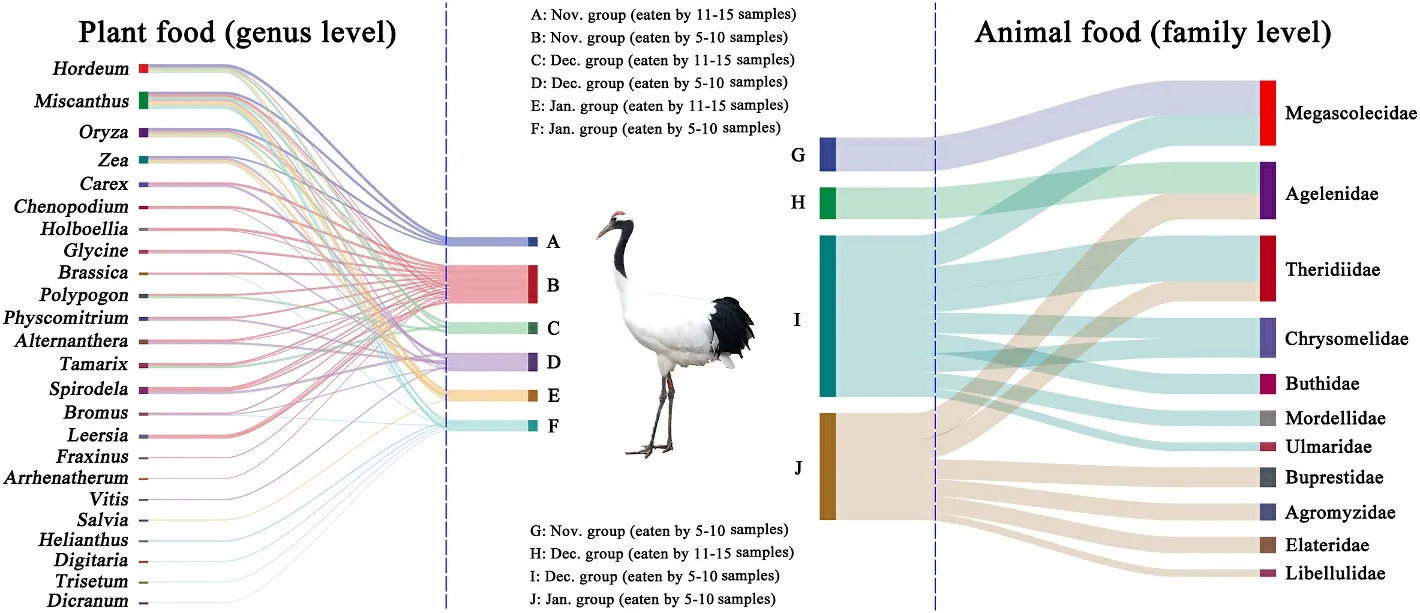
Fig.7.Sankey diagram showing associations between different months and plant foods at the level of genus (left) and animal foods at the level of family (right) in wintering Red-crowned Cranes.The connecting bar width represents the relative abundance of dietary items among periods and dietary items.
Among the animal foods, a total of 78 families, 33 genera and 11 species were identified in the Nov.group; 108 families, 56 genera and 29 species were identified in the Dec.group; 78 families, 38 genera and 14 species were identified the in Jan.group.The top three families in the Nov.group were Megascolecidae (15.99% ±31.89%), Naididae (6.73%±19.02%), and Nereididae (6.47% ±24.22%); those in the Dec.group were Agelenidae (23.50% ± 24.01%), Megascolecidae (14.81% ±27.77%), and Theridiidae (13.15% ± 16.97%); those in the Jan.group were Theridiidae (20.11% ± 30.61%), Amaurobiidae (9.23% ±19.30%), and Agelenidae (5.63% ± 20.34%).The diversity of animal foods was the highest in December while it was the lowest in January of the following year.The occurrence probability of the same animal foods was similar between two random groups (Fig.3).The Sankey diagram showed that 11 families were found frequently in different samples in the same month, namely Megascolecidae, Agelenidae, Theridiidae,Chrysomelidae, Buthidae, Mordellidae, Ulmaridae, Buprestidae, Agromyzidae, Elateridae, and Libellulidae.No animal families were found from 11 to 15 samples in November and January, respectively.Megascolecidae was mostly found in the Nov.group and Agelenidae was abundant in the Dec.group.Theridiidae, Chrysomelidae, Buprestidae,Agromyzidae, Elateridae, and Libellulidae were common in the Jan.group (Fig.7).In addition, among the animal foods (top 5), only Agelenidae differed significantly (Fig.8B).
4.Discussion
In this work, the foraging areas of Red-crowned Crane in YNNR were found to be diverse, as depicted in Fig.2.These areas include farmlands planted with winter wheat, fallowed farmlands, and reed marshes.Considering the integrity of feces and the feasibility of collection, the fecal samples were collected in flat farmlands and feeding sites.The feces collected from the farmlands contained snail shells (Fig.2D).These snails were mainly distributed in the wetlands (Varga, 2003; Luo et al.,2016; Guan et al., 2018; Wu et al., 2019).It could be inferred that Red-crowned Cranes might first forage in the reed marshes, and then move to the farmlands.In addition, we isolated some plants (such asMiscanthus,Carex,Tamarix) and animals (such as Naididae, Nereididae,Ulmaridae), which were not usually found in farmlands, from the fecal samples of Red-crowned Cranes (Figs.4 and 7).These were not usually found in farmlands; thus, the results of dietary composition were not limited to the plant and animal foods in the sampling sites but covered most of the plant and animal foods within YNNR (Wang et al., 2022b).
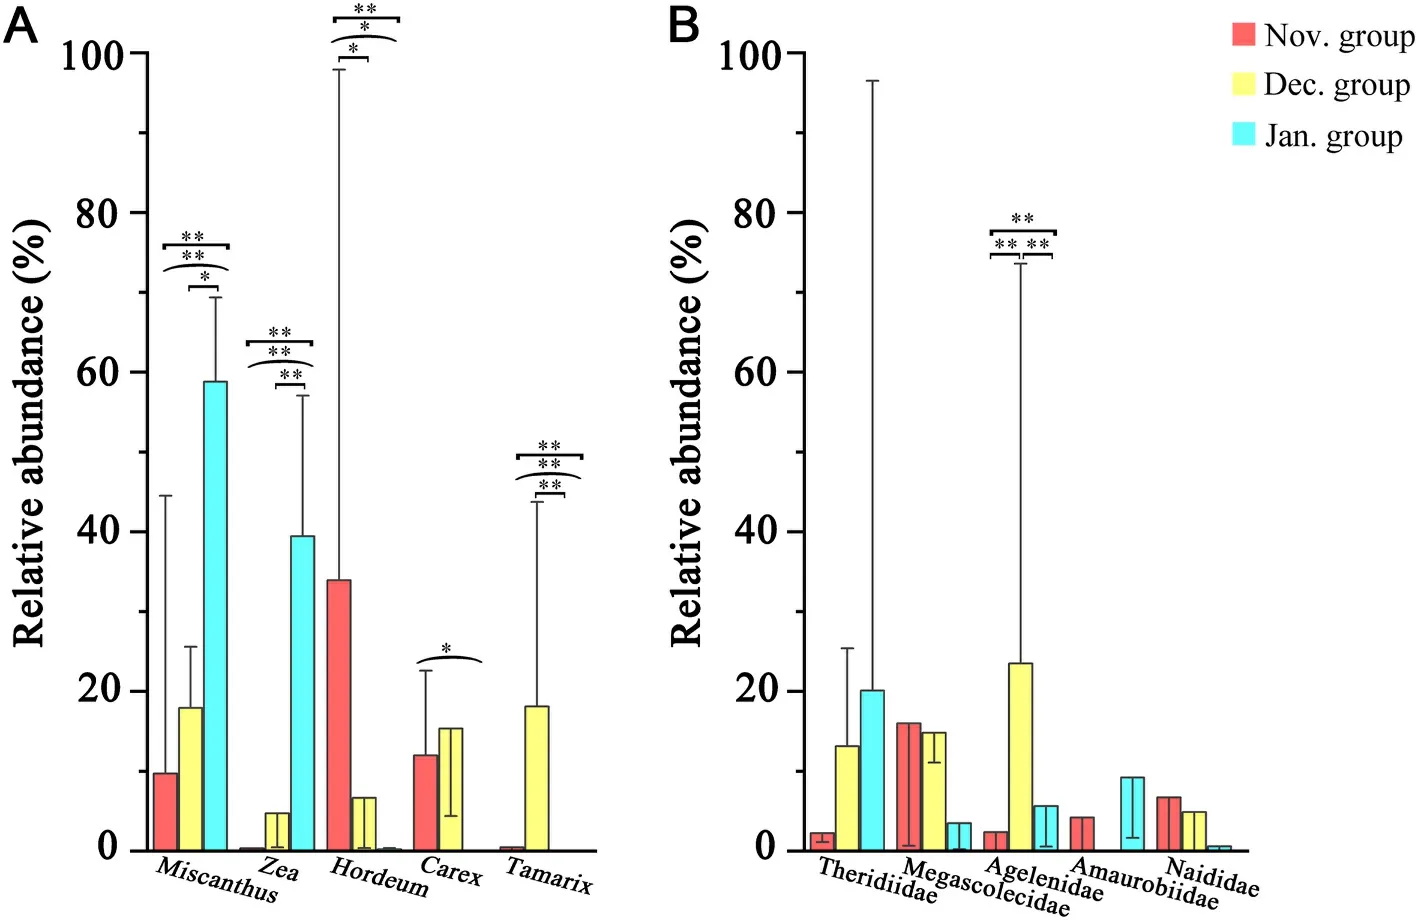
Fig.8.Relative abundance of dominant animal foods (A: the top 5 are shown) and plant foods (B: the top 5 are shown) of the fecal samples of Red-crown Cranes in November, December and January.Red: November; yellow: December; blue: January.The error bars represent STDEVP.Mann–WhitneyUtest and Kruskal–WallisHtest: *P≤0.05, **P≤0.01.The small square brackets represent tests between November and December or December and January; the large square brackets represent tests between November and January; the parentheses represent tests between the three months of November, December and January.
The dietary composition of the Red-crowned Crane was affected by temporal changes.As shown in Figs.3 and 4, both plant and animal foods were the most diverse in December, but their composition was homogeneous in January.This suggested that considerably more food items are available for Red-crowned Cranes in early winter.Among the main plant foods consumed by Red-crowned Cranes in November,HordeumandOryzawere planted in the farmlands (Lin et al., 2021; Pan et al., 2021), and the genusCarexwas widely distributed in the reserve(Pang et al., 2015).In December,Tamarix,MiscanthusandCarexwere broadly distributed (Cui et al., 2015; Pang et al., 2015).The main plant foods in January were from the widely distributedMiscanthusgenus,members of the genusOryzawere probably left over from harvesting in farmlands, andspecies ofZeawere artificially fed.The large increase inZeain January might be because supplementary feeding was conducted from later during the winter.A previous study on the feeding habits of wintering Common Cranes in YNNR revealed a preference for plants from the families Poaceae and Cyperaceae (Zhao et al., 2023), which was consistent with those of Red-crowned Crane.However, the main plant foods of cranes wintering in Poyang Lake consisted ofVallisneriatubers (Hou et al., 2021).The difference in the plant foods of cranes between the two winter habitats could be due to the different distribution of plant resources.The animal foods obtained in the present study were mainly annelids (earthworms) and terrestrial arthropods (small spiders) (Fig.4).Usually, earthworms are a common food resource for birds (Onrust et al., 2019).Therefore, they might also act as an important animal food source for Red-crowned Cranes when overwintering in Yancheng.Another possible type of animal food, small spiders, were too small to be directly consumed by these large-sized birds.However, small terrestrial arthropods were often detected.The reason for this may be that Red-crowned Crane accidently ingest small terrestrial arthropods while consuming plants, which may result in indirect species associations (Stenhouse et al., 2023).Previous studies have suggested that the main animal foods for Red-crowned Crane were fish and crabs during the breeding, migratory and wintering periods (Li et al., 2014, 2020; Luo et al., 2017; Xu et al., 2019), highly different from the results obtained here.However, the main animal foods of Red-crowned Cranes in Japan were not only fish but also invertebrates (such as insects) (Kataoka et al.,2022).The few aquatic animals (such as fish, shrimps and crabs)detected in this study might be due to the fact that the main foraging areas were in terrestrial environments.For wintering Red-crowned Cranes, the main plant food items were weedy plants and cultivated plants, and the main animal food items were mollusks, annelids and terrestrial arthropods, indicating a relatively wide range of dietary ecological niches.This is consistent with previous dietary studies based on observation and microhistological identification (Li et al., 2014; Luo et al., 2017).
In recent years, farmlands in protected areas have been considered as supplementary habitats for cranes (Gong et al., 2020; Zhou et al., 2021).This phenomenon was described as the adaptation of cranes to changes in food resources (Yang and Zou, 2020).In terms of reserve management, we suggest maintaining stubble farmlands and farmlands planted with winter wheat for wintering Red-crowned Cranes.In addition, as plants ofZeaaccounted for a significant proportion in January, we recommend that supplementary feeding should be continued to ensure the survival of Red-crowned Cranes in winter.
The general limitations of dietary metabarcoding have been reviewed extensively (Alberdi et al., 2019; Lamb et al., 2019).Low taxonomic coverage and false negatives often occurred using this technique (Corse et al., 2019; Stenhouse et al., 2023).Therefore, a one-locus-several-primer approach was developed in DNA metabarcoding studies (Corse et al., 2019).However, primer design and amplicon identification could be only implemented if a comprehensive library was available.It is important to note that no primer pair can provide a completely unbiased and comprehensive account of a species’diet due to highly degraded DNA, primer biases, and differences in chloroplast and mitochondrion copy number per cell (Clare, 2014;Stenhouse et al., 2023).Our results for the dietary composition of wintering Red-crowned Cranes might not be comprehensive, because rbcL and COI were amplified by only one primer pair each.In addition,some foods could be consumed directly, such as earthworms, while other food items would be consumed indirectly, such as small spiders and thrips in animal foods.It was assumed that either small terrestrial arthropods might be predated by large ones and then by Red-crowned Cranes, or these might be accidently consumed during the cranes’feeding on plants (Jongbloed et al., 1996; Stenhouse et al., 2023).Therefore, metabarcoding could not precisely establish the food preferences of Red-crowned Crane.Besides, since we could not get close enough to Red-crowned Cranes when sampling, we could not rule out the possibility that fecal samples from the same individual were collected.Future studies should be performed to investigate the dietary composition of Red-crowned Cranes during the breeding, migratory and wintering periods, to provide further data for conservation of this threatened species.
In conclusion, DNA metabarcoding of fecal samples was found to be a practical way of deciphering the dietary composition of Red-crowned Cranes.Our results indicated that this species has a relatively broad dietary niche, whereas the available natural foods decrease in late winter, making supplementary feeding necessary to improve the wintering success rate of these birds.Our study also showed that the main animal foods were representatives of Theridiidae, Megascolecidae,and Agelenidae, differing sharply from the results of previous research.The results obtained here are applicable to the conservation of wintering population.However, the dietary composition of Red-crowned Crane during the breeding and migratory periods should be further investigated , as this additional information could contribute to the development of effective conservation strategiesfor this species.
Competing interest
All authors declare that they have no competing interest.
Data availability
GenBank accession number: PRJNA932046.
Funding
This work was supported by the National Natural Science Foundation of China (No.31800453), the Biodiversity Investigation, Observation and Assessment Program (2019–2023) of the Ministry of Ecology and Environment of China (2110404), and the Science and Technology Department of Sichuan Province (No.2022YFS0487).
Authors’contributions
HL conceived the study.HL, WZ and YZ acquired the funds.NX, YZ and PX conducted the sampling.WX and NX performed the experiments.HL, WX, NX and HJ carried out the bioinformatics analysis.HL and WX drafted the manuscript.CZ, YZ and CL reviewed and revised the manuscript.All authors read and approved the final manuscript.
Ethics statement
This study was approved by the Ethics Committee of Nanjing Forestry University.No animals were harmed or killed in this study.
杂志排行

Avian Research的其它文章
- Selecting the best: Interspecific and age-related diet differences among sympatric steppe passerines
- Morphology and morphometry of two hybridizing buntings at their hybrid zone in northern Iran reveal intermediate and transgressive morphotypes
- Quiet in the nest: The nest environment attenuates song in a grassland songbird
- Characteristics of cross transmission of gut fungal pathogens between wintering Hooded Cranes and sympatric Domestic Geese
- Short-term night lighting disrupts lipid and glucose metabolism in Zebra Finches: Implication for urban stopover birds
- Variaiton in the composition of small molecule compounds in the egg yolks of Asian Short-toed Larks between early and late broods