A test of genetic divergence of a bird existing in the Sichuan Basin and its surrounding mountain ranges
2024-01-22LuWngFngqingLiuLnZhoYlingXuTinyuZhngLongyingWen
Lu Wng, Fngqing Liu, Ln Zho, Yling Xu,c, Tinyu Zhng,c, Longying Wen,*
aKey Laboratory of Sichuan Institute for Protecting Endangered Birds in the Southwest Mountains,College of Life Sciences,Leshan Normal University,Leshan,614004,China
bChengdu Institute of Biology,Chinese Academy of Sciences,Chengdu,610299,China
cCollege of Life Sciences,Wuhan University,Wuhan,430072,China
Keywords:Genetic divergence Restriction site-associated DNA sequencing(RAD-seq)Sichuan Basin White-browed Laughingthrush
ABSTRACTIsland ecosystems, serving as natural laboratories, facilitate geographical isolation, ecological specialization, and species divergence.The Sichuan Basin, surrounded by mountain ranges, represents a typical continental island due to its marked environmental spatial heterogeneity.This heterogeneity may contribute to geographical isolation and habitat heterogeneity, resulting in genetic divergence within populations.Therefore, we used the White-browed Laughingthrush (Garrulax sannio) as a model specimen to investigate the genetic divergence in the Sichuan Basin and its surrounding mountain ranges, given its presence in various habitats within and beyond this basin.Employing a RAD-seq dataset of 140G.sannioindividuals from 17 distinct ecological zones in the Sichuan Basin and its surrounding mountain ranges, we conducted PCA, population structure analysis, phylogenetic tree construction, and gene flow analysis to comprehensively analyzeG.sanniogroups.Additionally, in conjunction with geographical and ecological data, we performed isolation by distance, isolation by environment, PCA, and latent factor mixed model analysis to identify factors influencing the genetic divergence among theseG.sanniogroups.In summary, the 17G.sanniogroups were categorized into high-elevation, medium-elevation, and lowelevation groups.Genetic divergence inG.sanniomay be attributed to both geographical distance and key ecological factors, particularly elevation and key climatic variables.Notably, the high-elevation group exhibited a greater number of SNPs and selected genes associated with the key ecological factors compared to the lowelevation group.TheADCY9gene and several associated key pathways were identified as crucial elements driving ecological adaptation (elevation and key climatic variables) in the high-elevation group.Furthermore,climate changes during the glacial cycles may have facilitated gene flow among these groups residing in the Sichuan Basin and its surrounding mountain ranges.Our findings provide evidence of genetic divergence inG.sannioinfluenced by the geographical distance and key ecological factors between the Sichuan Basin and its surrounding mountain ranges.These results lay the groundwork for future research on the molecular systematics of continental islands.
1.Introduction
Geographical isolation and ecological adaptation are two critical factors contributing to population diversity during evolution (Cun and Wang, 2010; Zhu et al., 2017).Island ecosystems, serving as natural laboratories, play a vital role in promoting geographical isolation,thereby fostering ecological specialization and species differentiation(Emerson, 2002).Research on the divergence and speciation of island species has gained significant attention in modern island biogeography and zoology (Avise, 2000; Emerson, 2002), and several significant research findings have been published (Emerson, 2002; Stuart et al.,2004; Chen and He, 2009; Losos and Ricklefs, 2009; Choi et al., 2021).For instance, Darwin’s (1859) research on Galápagos finches made notable contributions to the theory of evolution, and Losos and Ricklefs(2009) emphasized the importance of the role of island biogeography in adaptation, evolution, and diversification.While most island studies focus on oceanic islands, the broader concept of an island includes any habitat surrounded by barriers to dispersal, including relatively isolated habitats on a landmass, such as a continent island (Servedio, 2000;Pullin, 2002).
The Sichuan Basin, a prominent inland basin in China, is situated at a unique geographical junction and is encircled by mountain ranges,including Dalang, Qionglai, Longmen, Micang, Daba, Wushan, Wuyi,and Dalou Mountains.Previous studies have recognized the Sichuan Basin as an archetypal inland basin characterized by marked environmental spatial heterogeneity, resembling continent islands (Servedio,2000).The Sichuan Basin and its adjacent mountain ranges play a crucial role in geographical isolation, potentially leading to genetic divergence within populations.Additionally, substantial differences in elevation between regions can create habitat heterogeneity, acting as a genetic barrier to the dispersal of various species and limiting genetic exchange among populations (Li et al., 2022).Consequently, the Sichuan Basin and its surroundings offer a compelling environment to explore genetic divergence resulting from isolation effects or ecological variations.
Recent advancements in molecular methods have significantly enhanced our ability to investigate the genetic structure and phylogeny of vertebrates (Kang et al., 2017).Markers like simple sequence repeats(Reif et al., 2005), amplified fragment length polymorphisms (Guillot and Santos, 2010), inter-simple sequence repeats (Kar et al., 2005;Stolpovsky et al., 2010), random amplified polymorphic DNA (Jordano and Godoy, 2000; Gouin et al., 2001), and sequence-related amplified polymorphism (Liu et al., 2014; Xiang et al., 2020) have been employed in genetic studies across various species.Currently, restriction site-associated DNA sequencing (RAD-seq) is deemed valuable, especially when reference genomes are unavailable (Willing et al., 2011;Wang et al., 2017).Due to its high-throughput nature and cost-effectiveness, RAD-seq proves useful in genetic mapping (Kang et al., 2017), exploring genetic diversity (Cromie et al., 2013; Martin Cerezo et al., 2020), and developing molecular markers (Yang et al.,2017).Moreover, RAD-seq has played a pivotal role in population genomic studies, offering insights into phylogenetic relationships within and among species populations (Eaton and Ree, 2013; McCormack et al.,2013).RAD-seq has been applied to study population genetic divergence in various species, including the domestic Bactrian camel in different regions of China (Liu et al., 2019), and the population structure and selection signatures of Yunling goat in China (Chen et al., 2022).Advances in molecular biology theory and techniques have also contributed to our understanding of divergence and evolutionary mechanisms in island-dwelling animals, enriching island biogeography theory(Cooper EA and Uy, 2017; Martin et al., 2021; Moysi et al., 2023).However, studies utilizing RAD-seq data to examine the genetic pattern of avian species in the Sichuan Basin and its surroundings remain limited.
The White-browed Laughingthrush (Garrulax sannio), a member of the Timaliidae family, is widely distributed in most parts of southern China, northwest India and the Indo-China Peninsula today (Collar et al., 2019; Wen et al., 2020).G.sannioexists in various habitats, such as those with human inhabitation, secondary forests, bamboo patches,scrubs, grasslands, forest edges, and montane habitats (Wen et al.,2020).Its wide distribution makes it an ideal model for studying population genetic divergence in the Sichuan Basin and its surrounding mountain ranges.Previous studies onG.sanniohave examined aspects of behavior, ecology, and molecular characteristics, such as the relationship between morphological adaptation and geographic variation (Wen et al., 2020) and the complete mitochondrial genome sequence ofG.sannio(Wen et al., 2017a,b).However, limited evidence exists regarding the population structure and phylogenetic relationships among groups residing in different regions of the Sichuan Basin and its surrounding mountain ranges, hindering our comprehension of genetic divergence withinG.sanniogroups both inside and outside the Sichuan Basin resembles a continent island.Consequently, obtaining RAD-seq data forG.sanniodistributed in the Sichuan Basin and its surrounding mountain ranges is of paramount importance for understanding their genetic divergence.
In this study, utilizingG.sannioas our model, we employed RAD-seq data in conjunction with geographical and ecological datasets to investigate genetic divergence in the Sichuan Basin and its peripheral mountain ranges.Specifically, our objectives were: (i) to elucidate the genetic structure, phylogenetic relationships and gene flow amongG.sanniogroups inhabiting the Sichuan Basin and its surrounding mountain ranges; (ii) to identify the geographical distances and ecological factors influencing genetic divergence through the isolation by distance(IBD) model, isolation by environment (IBE) model, PCA analysis; and(iii) to elucidate the adaptive responses to identified key ecological factors using the latent factor mixed model (LFMM).To the best of our knowledge, this study provides the first evidence of genetic divergence amongG.sanniogroups in the Sichuan Basin and its surrounding mountain ranges.Our findings are anticipated to shed new light on the evolution of avian species and other vertebrates residing in continental islands.
2.Materials and methods
2.1.Genetic sampling
Blood samples were collected from 140G.sannioindividuals gathered from various locations within the study sites.Of these 140 individuals, 123 originated from 17 different locations, covering the natural distribution ranges of the Sichuan Basin and its surrounding mountain ranges.These locations spanned six provinces (Sichuan,Chongqing, Guizhou, Yunnan, Shaanxi, and Gansu) in southwest China.The total number of individuals from 17 groups were divided in this study.Owing to different sampling efforts, the distribution of samples was unequal among the group.The sample numbers and localities are mapped in Fig.1A.The sample name and detailed geographic location are listed in Appendix Table S1.
Based on the geographical regions, the samples primarily originated from four main sampling sites: (1) Qinling-Daba Mountain ranges: this group includes sampling sites from SLY (Lueyang, Shaanxi), SZY(Ziyang, Shaanxi), CGY (Guangyuan, Sichuan), GWX (Wenxian, Gansu),which are part of the Qinling-Daba Mountain ranges (North), and group CWY (Wanyuan, Sichuan) belonging to Daba Mountain ranges (East);(2) The Hengduan Mountains: this group includes sampling sites from DLJ (Lijiang, Yunnan), DLD (Ludian, Yunnan), CXC (Xichang, Sichuan),and CPZH (Panzhihua, Sichuan); (3) The Transitional zone of Yungui Plateau and the Sichuan Basin: this group consists of sampling sites from the QZY (Zunyi, Guizhou) group; (4) The Sichuan Basin: this group includes sampling sites from various other groups within the Sichuan Basin.Among these groups, CYB (Yibin, Sichuan), CLS (Leshan,Sichuan) and CQ (Chongqing, Chongqing City) belonging to the Sichuan Basin (South), CCD (Chengdu, Sichuan) (include individuals from Qionglai, Chongzhou, Pixian) and CMS (Meishan, Sichuan) belonging to the Sichuan Basin (Center), CYA (Yaan, Sichuan) and CYJ (Yingjing,Sichuan) belongs to Basin transition belt (West).
According to the differences in elevation, the groups ofG.sanniocan be categorized into three distinct ecological groups: the high-elevation group (bird species existing above an altitude of 2000 m), the medium-elevation group (bird species existing at altitudes ranging from 1000 to 2000 m), and low-elevation group (bird species existing below 1000 m) (Fig.1B).As a result, the groups located in the Sichuan Basin belong to the low-elevation group, while the groups from the surrounding mountain ranges can be further divided into three levels: the low-elevation group (Qinling-Daba Mountain), the high-elevation group(Hengduan Mountains), and the medium-elevation group (QZY, the transitional zone).The elevation data for these 17 sampling sites were obtained from WorldClim version 2.1 (Fick and Hijmans, 2017) and ArcGIS 10.6.1 (Appendix Table S2).
2.2.Library preparation and sequencing

Fig.1.Genetic sampling information.(A) Sampling locations of the 17 isolated groups ofG.sannioinhabiting in the Sichuan Basin and its surrounding mountain ranges.(B) Elevation levels of these 17 groups ofG.sannio.Illustration ofG.sannio© Bai Xiao from The CNG Field Guide to the Birds of China by Yang Liu and Shuihua Chen, used with permission.
Samples collected from eachG.sannioindividual were immediately frozen in liquid nitrogen and stored at the College of Life Sciences,Leshan Normal University (Leshan, Sichuan Province, China) in a-20◦C refrigerator until genomic DNA extraction.Genomic DNA was extracted from the samples using the cetyl trimethylammonium bromide(CTAB) method (Murray and Thompson, 1980).To ensure the reliability and precision of the sequencing data, we implemented three major quality control approaches for DNA sample qualification: (1) DNA purity and integrity were assessed through agarose gel electrophoresis analysis;(2) DNA purity was evaluated by measuring the OD260/OD280 ratio using the NanoDrop 2000 spectrophotometer; (3) DNA concentration was accurately measured using the Qubit 2.0 fluorometer.
The RAD library was meticulously constructed following a standardized protocol (Baird et al., 2008).In brief, the qualified DNA samples were digested with theEcoRI restriction enzyme.Subsequently, we conducted P1 adapter ligation, purification, and DNA shearing.Afterward, we selected inserted fragments with sizes ranging from 300 to 500 bp and extracted them.Finally, we performed P2 adapter ligation to the sheared fragments and carried out PCR amplification.Paired-end sequencing was executed on the Illumina HiSeq 4000 platform, with a read length of 150 bp at each end.
The initial output of the sequencing process underwent filtering to obtain high-quality clean reads.This process was performed based on three stringent criteria: (a) removing reads with ≥10% unidentified nucleotides (N); (b) discarding reads with >50% bases having a Phred quality score of ≤20; and (c) eliminating reads aligned to the barcode adapter (Li et al., 2009).
2.3.Clustering and assembly
After the sequencing process, reads were clustered into read tags by grouping them based on their sequence similarity using the cd-hit-est (Li and Durbin, 2009) to assess the quality of the sequencing data.As the inefficient assembly with few support reads in a cluster, we initially examined the number of reads in each cluster and selectively filtered clusters containing 10–400 reads.
For the analysis of heterozygous single nucleotide polymorphisms(SNPs), a partial genome ofG.sanniowas assembled.We used the VelvetoptOptimizer program (Zerbino and Birney, 2008) for local assembly on the selectedG.sanniosamples, with the following parameter settings:“VelvetOptimiser.pl -s 23 -e 31 -x 4”.Following the local assembly procedure, the final assembled sequence was filtered by discarding contigs shorter than 150 bp.
To assess the quality of the newly assembledG.sanniogenome, nonduplicated reads were mapped to the locally assembled sequences, and variations were subsequently detected.The mapping and variation detection procedures were conducted as follows: (1) aligning the reads to the assembled genome using “mem -t 4 -k 32 -M” or “aln -o 1 -m 100000 -t 4 -l 32 -i 15 -q 10”; (2) converting sam to bam files using“samtools -bs” and sorting the generated bam files with “samtools sort”;(3) removing duplication of the aligned reads (reads aligned to multiple locations) using “samtools rmdup”; and (4) performing SNP calling using “samtools mpileup -q 1 -C 50 -S -D -m 2 -F 0.002”.
2.4.SNP calling
To identify SNPs, clean reads from 139G.sannioindividuals were mapped to the newly assembled genome using the BWA Aligner (Li and Durbin, 2009), with the parameter setting “aln -o 1 -m 100000 -t 4 -l 32-i 15 -q 10”.The aligned reads were further filtered using “SAMtools rmdup” to remove duplicated reads.
Individual SNP variations were detected using SAMtools (Li et al.,2009), with the parameter setting “mpileup -m 2 -F 0.002 -d 1000”.To ensure the accuracy of SNP detection, we applied the following filter criteria: (1) each SNP must be supported by at least two reads but no more than 2000; and (2) the mapping quality of each SNP should be higher than 20.
2.5.Population genetics analysis
2.5.1.Principal component analysis(PCA)
Principal component analysis (PCA) is a mathematical calculation method that transforms large datasets into smaller ones.In this study,GCTA (Yang et al., 2011) was used to conduct PCA based on the SNPs of 17 groups ofG.sannio.
2.5.2.Population structure analysis
Population genetic structure was analyzed using Frappe software(Bryc et al., 2010) based on the SNP data of 17 groups ofG.sannio.The software program estimates individual ancestry and admixture proportions, assuming a range of genetic clusters fromK=2 toK=8.
2.5.3.Phylogenetic tree construction
Treebest-1.9.2 software (Jin et al., 2012) was employed to generate a distance matrix based on the SNPs of 17G.sanniogroups.Subsequently,a phylogenetic tree was constructed using the neighbor-joining method,with bootstrap values calculated over 1000 times.
2.5.4.Gene flow analysis
To assess the extent of gene flow among the various groups ofG.sannioin the Sichuan Basin and its surrounding mountain ranges, two analytical approaches were employed.First, inferred population splits and admixture from allele frequency data were collected using TreeMix(Pickrell and Pritchard, 2012) and SNPs from all individuals.Second,Genepop program version 1.0.5 was used to evaluate theFstof each SNP,and the parameterNm, representing the levels of gene flow among these groups, was calculated using the formulaNm=(1 –Fst) / 4Fst.Following the classification proposed by Wright (1978), theNmvalues were categorized into three grades: high (≥1.0), medium (0.250–0.99), and low(0.0–0.249) (Govindaraju, 1988).
2.6.Isolation mechanism testing
To investigate the potential effects of geographic distances and ecological variations (elevation and climatic variables) on genetic divergence, we conducted IBD, IBE, PCA, and genetic-environment association analyses.
2.6.1.IBD analysis
To assess the relationship between geographic and genetic distances(IBD), we computed the association between a matrix containing Slatkin’s linearizedFstvalues (Fst/ (1 –Fst)) and a matrix representing logarithmically transformed geographic distances (Jiang et al., 2019).Pairwise geographic distances were calculated using the “geosphere”package (Hijmans et al., 2017) in R, based on the latitude and longitude data of sampling points.The Mantel test was performed using the vegan package (v2.5-7) (Dixon and Palmer, 2003) in R, with 9999 permutations set for statistical analysis.
2.6.2.IBE analysis and PCA
Elevation and climatic variables were considered as key factors in this study.We combined PCA and IBE analysis to detect the potential effects of climatic variables on genetic divergence.While for the potential effects of elevation, we performed IBE analysis.
We obtained data on 19 bioclimatic variables and elevation information for 17 sampling sites from WorldClim version 2.1 at a spatial resolution of 30 s (Fick and Hijmans, 2017).Data extraction was conducted in ArcGIS 10.6.1 (Environmental Systems Research Institute Inc.,Redlands, CA, USA) (see Appendix Table S2).
Firstly, to examine the relationship between bioclimatic variables and population structure, we performed correlation analysis using the“cor” function in the R “corrplot” package (Wei and Simko, 2021).p-Values were calculated using the “cor_pmat” function in the “ggforce”package (Pedersen, 2022).Subsequently, PCA was carried out using the‘PCA’ function in R “FactoMineR” packages (Lˆe et al., 2008).The output was visualized using the R package ggplot2 (v3.3.3) (Wickham, 2016).
Furthermore, to identify specific key climatic factors contributing significantly to genetic distance, we conducted IBE analysis.To address potential biases stemming from intercorrelations among bioclimatic variables, we performed a variance inflation factor (VIF) analysis to address the issue of multicollinearity.The analysis generated VIF values for variables and removed highly correlated variables through a stepwise procedure using the “vifcor” function in the “Usdm” package(Naimi et al., 2014).Finally, ten variables (mean diurnal range, temperature seasonality, min temperature of coldest month, temperature annual range, mean temperature of wettest quarter, mean temperature of driest quarter, annual precipitation, precipitation of wettest month,precipitation of driest month, and precipitation seasonality) were selected.The selected ten bioclimatic variables were further used for IBE analysis.
Additionally, to assess the association between ecological variables and genetic distance (IBE), we conducted partial Mantel tests while considering the geographic distance in the R “vagen” package (v2.5-7)(Dixon and Palmer, 2003), with 9999 random permutations.The selected ten bioclimatic variables and elevation (among different elevation groups) were tested for correlation.For each variable, the environmental distance among the sites was calculated as the Euclidean distance between groups using the “dist” function in R (Koenig et al.,2017).Subsequently, the correlation between Slatkin’s linearized Fst values and environmental distance was assessed.This rigorous approach aimed to disentangle the respective contributions of spatial and ecological factors to the observed patterns of genetic divergence.
2.6.3.Genetic-environment associations
A local environmental adaptation study was investigated using the identified key ecological factors contributing the most to genetic variation.Firstly, we conducted an analysis of LFMM to identify correlations between genetic markers and candidate ecological variables.LFMM is a univariate analysis method for studying genotype-environment associations.All SNP markers and key ecological variables were used for association analysis in LFMM v.1.4 (Yoichi et al., 2021).Candidate adaptive SNP loci related to the key ecological factors were identified separately for the low-elevation and the high-elevation groups.
Subsequently, contig sequences corresponding to the extracted SNPs were obtained from the reference genome.Candidate selected gene sets,derived from gene structure annotation were aligned with the information from known databases, including NCBI, NR, SwissProt, KEGG,InterPro, Pfam, and GO, using BLASTP (parameters:E-value = 10E-5)(Camacho et al., 2009) and hmmsearch (Sun and Buhler, 2007) to obtain gene functional information.Specific selected genes in each group were then identified.
3.Results
3.1.Rad-seq data of G.sannio
The RAD-seq generated a total of 285.48 Gb clean data for the 140G.sannioindividuals after quality filtering.The clean data for each individual ranged from 1.04 to 7.20 Gb, with GC content varying from 39.27% to 46.2%.The sequencing data exhibited high quality, with Q20≥ 92.73% and Q30 ≥ 84.17%.Detailed sequencing statistics are provided in Appendix Table S3.Overall, the data volume from all samples was adequate, sequencing quality met standards, GC distribution was normal, and the dataset was successfully sequenced, providing reliable data for further analysis.After removing potential PCR duplication reads and retaining reads containing theEcoRI motif, we obtained anEcoRI ratio ranging from 82.03% to 96.90% (Appendix Table S4).
3.2.Assembly of the reference sequence
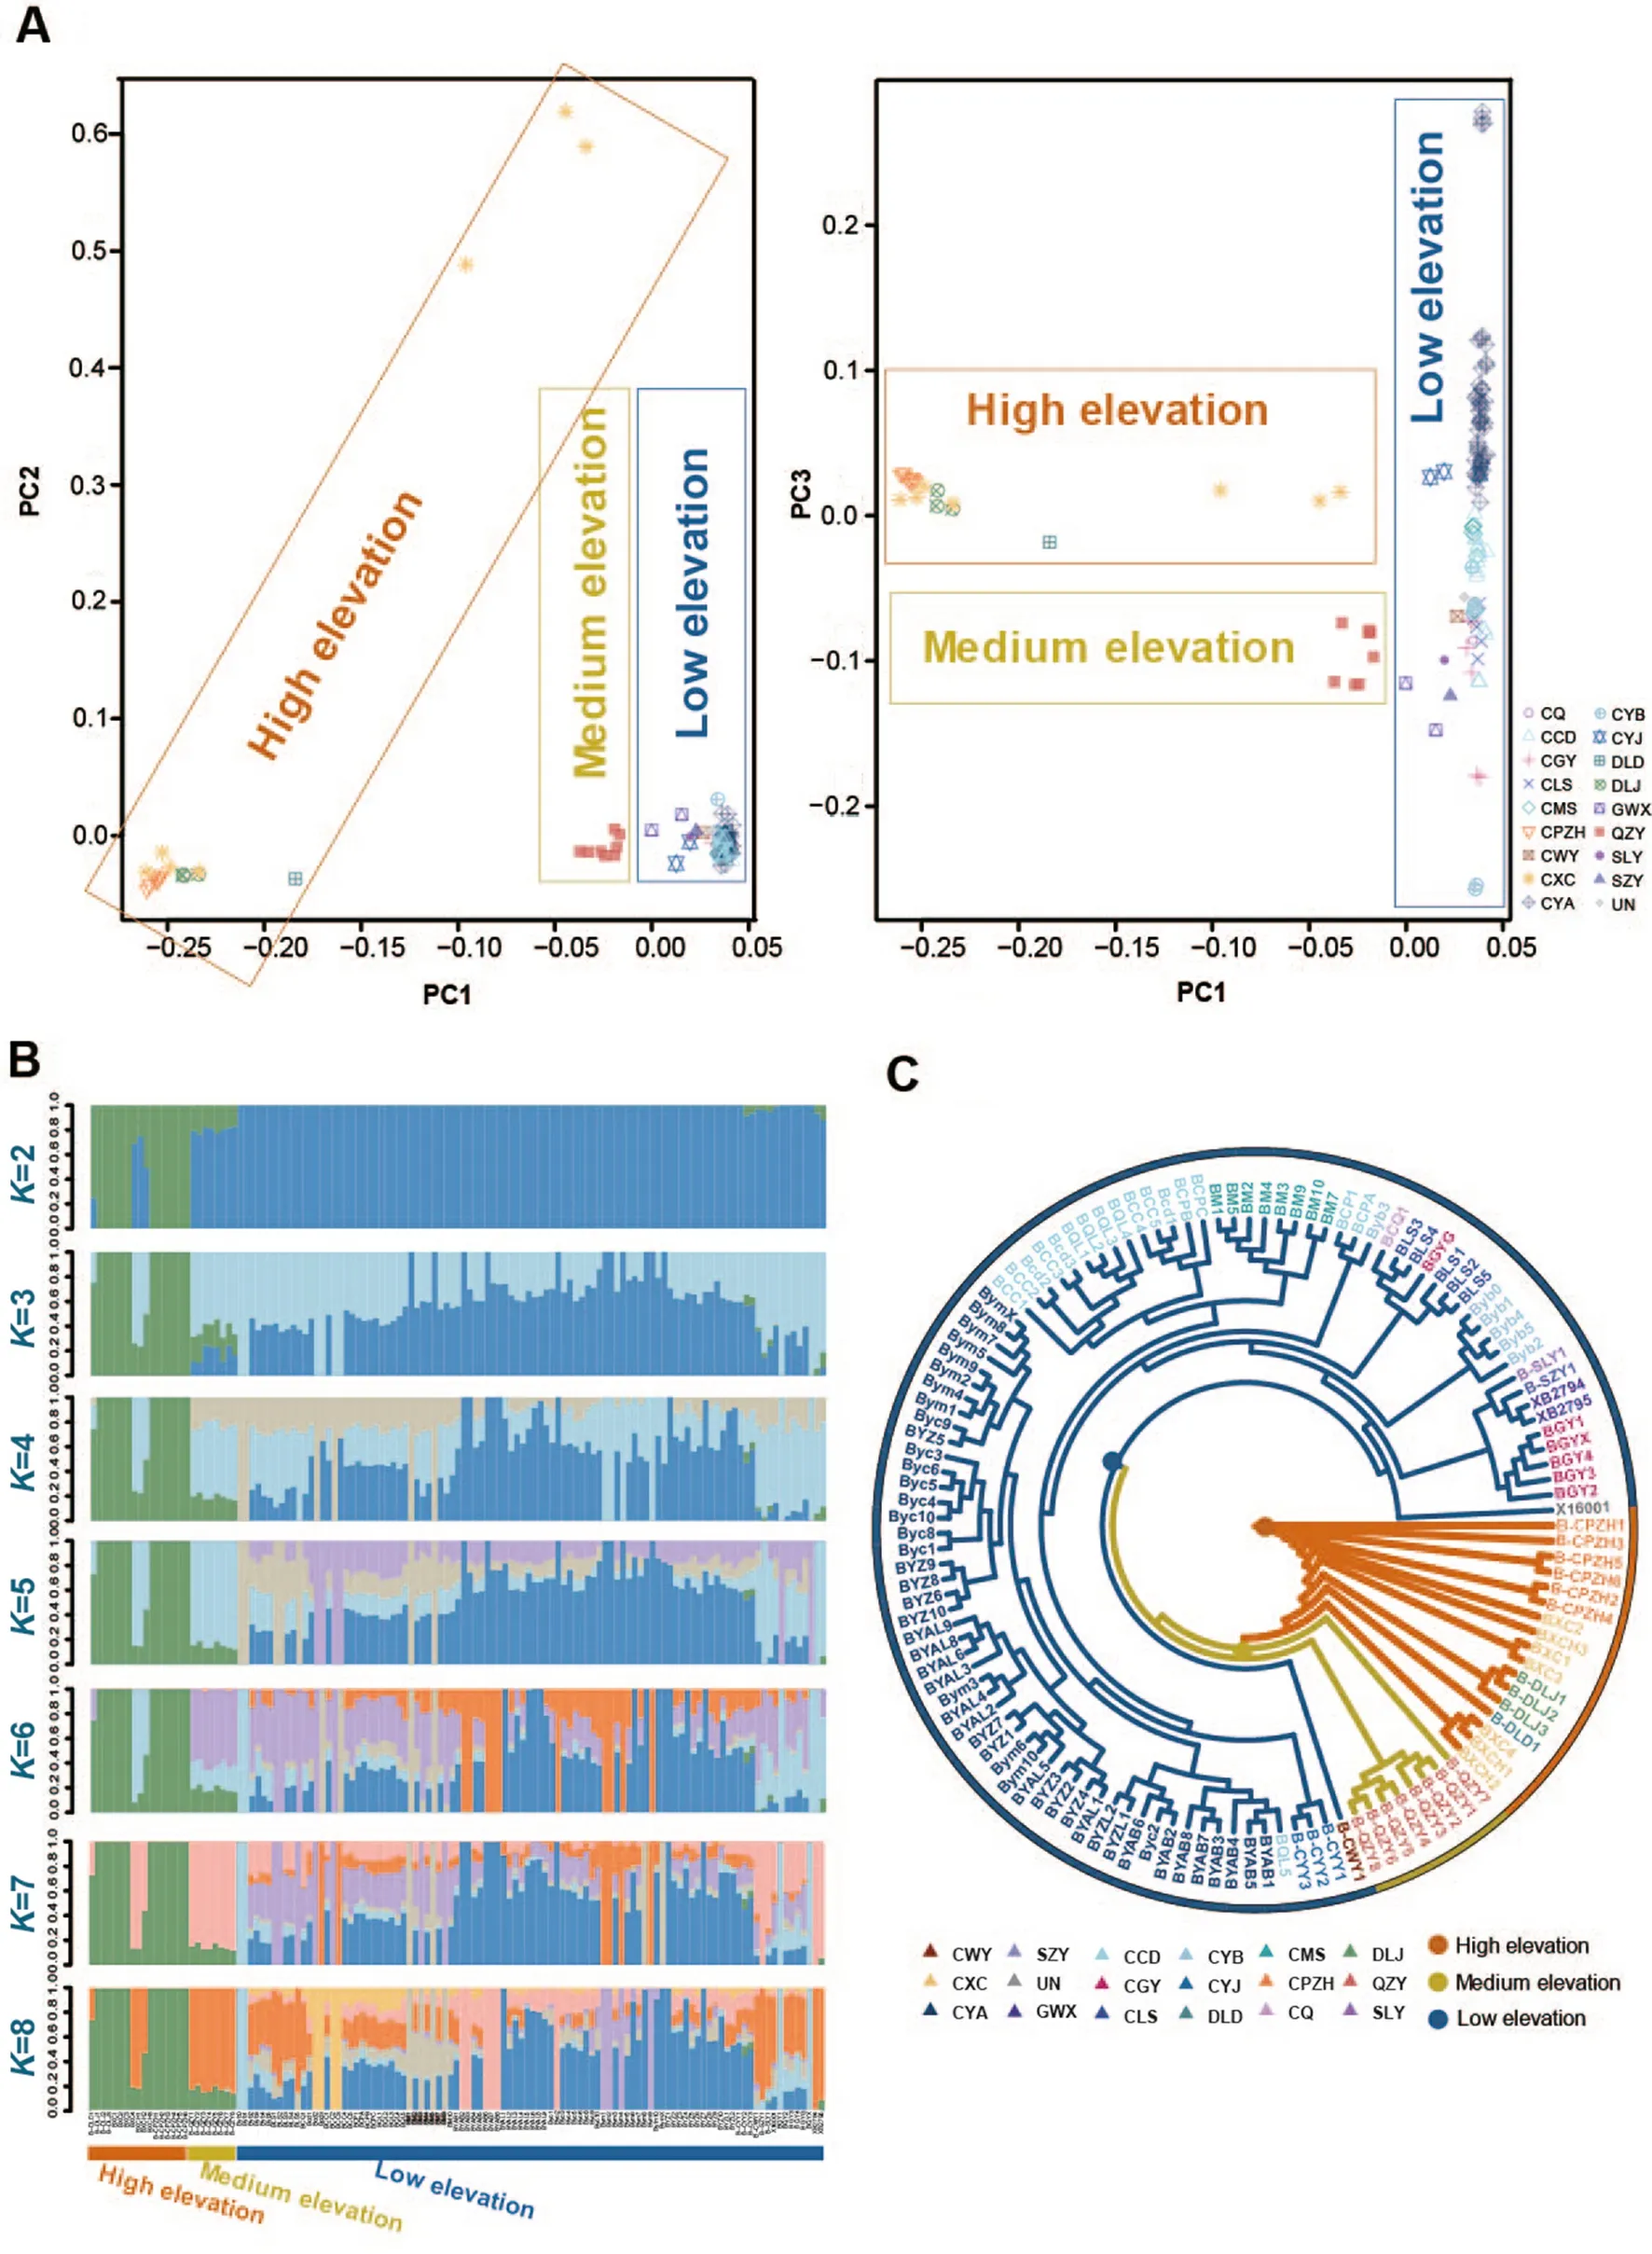
Fig.2.Population genetics analysis results.(A) PCA results for 17 groups ofG.sannio.Different colors represent different groups.(B) Group structure clustering in the 17 groups ofG.sanniowithKvalues set from 2 to 8.(C) Phylogenetic tree of 17 groups ofG.sannioinferred from the RAD-seq dataset.(For interpretation of the references to color in this figure legend, the reader is referred to the Web version of this article.)
We selected the high coverage-depth individual assembly as a reference for SNP detection, and individual BYAL7 was chosen as the reference genome.The reference assembly consisted of 538,886 contigs with an average length of 398 bp, and contig N50 reached 439 bp(Appendix Table S5).
To assess the accuracy of the newly assembled genome, we aligned pair-end clean reads onto the contigs.The average depth was 22.48, and approximately 99.59% and 88.12% of the reference assembly were covered by 1 and 4 or more reads, respectively (Appendix Table S6).The reference assembly also exhibited a high heterozygous SNP rate of 96.49%, indicating its high accuracy and reliability (Appendix Table S7).Consequently, the generated contigs were used for subsequent SNP identification.
3.3.SNP identification and validation
SNP calling analysis revealed that the mapped reads for the 17G.sanniogroups ranged from 1,077,784 to 41,072,144, with mapping rates spanning from 4.26% to 86.5%.The average depth ranged from 6.81 to 20.89 X, with Coverage 1X varying from 40.1% to 99.0% and Coverage 4X ranging from 1.59% to 82.55% (Appendix Table S8).We excluded 14 samples with unknown sampling sites due to low mapping rates, leaving 125 samples for SNP calling.In total, SAMtools identified 977,611 SNPs across all individuals, which were used for subsequent analyses of genetic structure, phylogeny of population, and gene flow.
3.4.Principal component analysis(PCA)
PCA results revealed that the 125 samples, representingG.sannioindividuals from 17 sampling sites, were primarily categorized into three groups based on genetic structure (Fig.2A).The low-elevation groups were clustered together, while the high-elevation groups (DLD,DLJ, CXC, and CPZH) were clustered together.The low-elevation and the high-elevation groups seem to be more dispersed, indicating a high level of genetic divergence.Additionally, the QZY group from Zunyi,Guizhou Province, located in medium-elevation areas, formed a further distinct lineage.In summary, based on PCA results,G.sanniogroups were broadly divided into three clusters: high-elevation group, mediumelevation group, and low-elevation group.
3.5.Population structure
Population structure analysis results (Fig.2B) indicated a clear distinction between high-elevation groups (DLD, DLJ, CXC, and CPZH)and the other 12 low-elevation groups forKvalues ranging from 2 to 8,signifying different genetic compositions between the high-elevation and low-elevation groups.However, the medium-elevation group(QZY) exhibited a uniquely admixed composition.Additionally, an admixture of genetic background was noted among these groups.
3.6.Phylogeny of population
The constructed phylogenetic tree illustrated clear differentiation between high-elevation clades (Hengduan Mountain groups) and lowelevation clades (low-elevation groups primarily distributed in the Sichuan Basin and Qinling-Daba mountain range).The mediumelevation clade (QZY group) appeared to represent a unique lineage(Fig.2C, Figs.S1A and B).
The high-elevation clade including one branch, CPZH, CXC, DLJ, and DLD.The low-elevation clade comprised five clusters, representing groups from Qinling-Daba Mountains (North), the Sichuan Basin(South), the Sichuan Basin (Center), the Basin transition belt (West), and Daba Mountain ranges (East).Additionally, a few individuals (such as BGYG, BCP1, BCPA, Byb3, and BQL5) were intermixed into other clusters, indicating gene flow between these clusters.
He went in and wandered about through all quarters, and through bazaars149 and lanes and squares, in the least knowing from whom he could ask information about the riddle of Mihr-afruz
3.7.Gene flow results
TreeMix analysis demonstrated genetic exchanges among theG.sanniogroups, indicating significant ancient admixture events(Fig.3A).Additionally, Genepop analysis results indicated varying levels of gene flow, ranging from 0.065 to 48.317 among the 17G.sanniogroups (Fig.3B, Appendix Table S9).According to Wright, gene flow was observed among these groups, with a notable gene flow between the QZY group and the CMS group, indicating genetic exchanges between groups within and outside of the Sichuan Basin.
In summary, these results confirmed the presence of ancient gene flow among theG.sanniogroups, particularly between groups distributed within and outside of the Sichuan Basin.
3.8.Geographic and ecological correlates with genetic divergence
3.8.1.Geographic distances and genetic divergence
The Mantel test showed a significant correlation between the pairwise genetic distance and the geographic distances (P< 0.05), suggesting that isolation by distance (IBD) played a significant role in shaping the genetic divergence ofG.sannioamong the 17 groups (Appendix Table S10).These finding highlights the impact of geographic isolation on the genetic structuring of theG.sanniogroups.
3.8.2.Ecological variables and genetic divergence
Significant correlations were observed among the 19 bioclimatic variables (Fig.4A).Moreover, the genetic structure ofG.sannioexhibited patterns that correlated with elevational gradients, resulting in distinct groupings into high-elevation, medium-elevation, and lowelevation strata.Simultaneously, PCA results further supported that the elevational gradient elicits changes in climate factors, which,notably, exhibit a parallel alignment with the genetic structure (Fig.4B and C).These findings primarily suggested climate factors had correlations with genetic divergence.
Moreover, within the 17 groups ofG.sannio, significant correlations were identified between genetic distance and several ecological variables through partial Mental test.Specifically, significant correlations were observed between genetic distance and elevation (P<0.01), mean diurnal range (P<0.05), minimum temperature of coldest month (P<0.05), annual precipitation (P< 0.05), and precipitation of wettest month (P< 0.05) (Appendix Table S10).These results suggested that elevation and specific key climatic factors (mean diurnal range, min temperature of coldest month, annual precipitation, and precipitation of wettest month) are key ecological factors contributing to genetic divergence in theG.sanniogroups.
3.8.3.Candidate genes and biological processes related to the ecological gradient
The LFMM model and gene annotation analysis revealed a higher number of SNPs and selected genes were associated with elevation,mean diurnal range, min temperature of coldest month, annual precipitation, and precipitation of wettest month in the high-elevation group when compared with those in the low-elevation group (Appendix Table S11).Moreover, several specific selected genes were observed between the high-elevation and low-elevation groups in relation to the five key ecological factors (Fig.5A).Notably, a key gene,ADCY9, related to the adaptation of ecological factors for the high-elevation group was identified.These findings further underscore the differential genetic responses to key ecological factors between groups inhabiting different ecological ranges.
Furthermore, enrichment analysis also highlighted differences in the top ten KEGG pathways associated with these five key ecological factors between the high-elevation and low-elevation groups.Intriguingly, the high-elevation group exhibited enrichment in KEGG pathways such as oxidative phosphorylation pathway associated with high elevation adaptation (Fig.5B), as well as cardiac muscle contraction and adrenergic signaling in cardiomyocytes linked to the adaptation to key climate factors (Fig.5C, D, E, F).
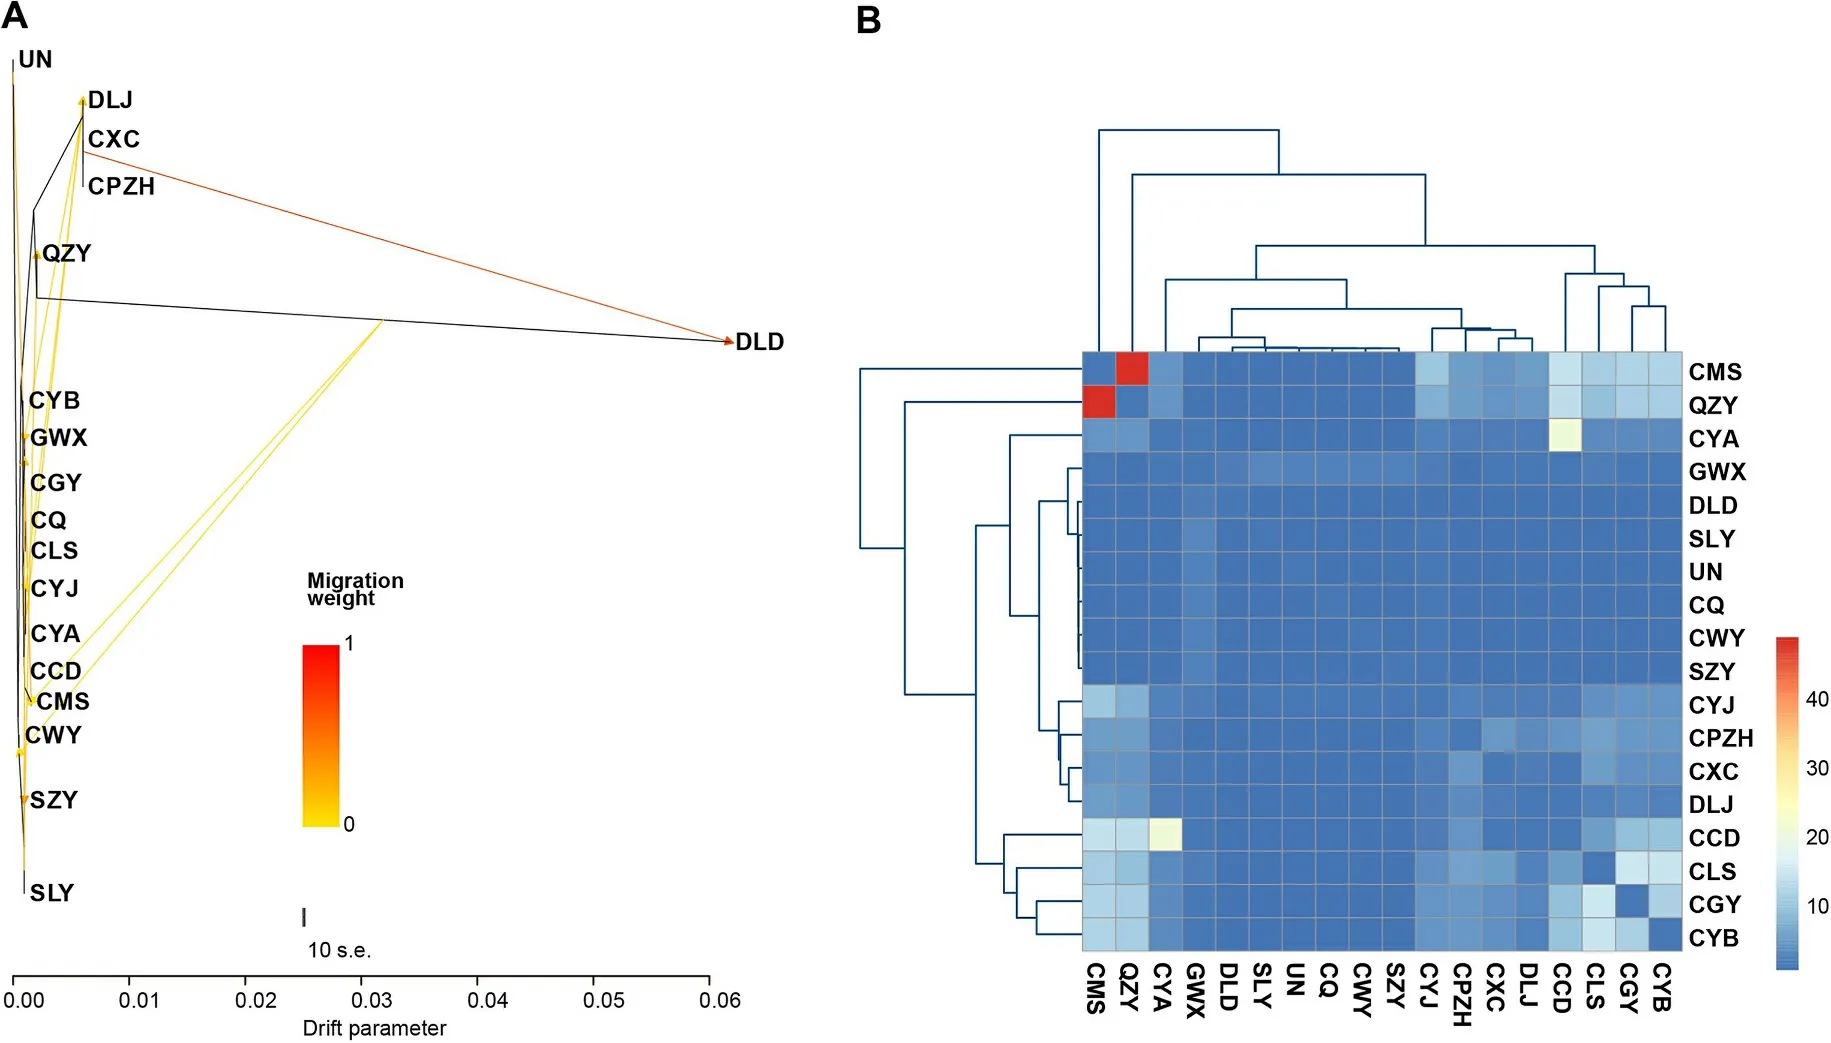
Fig.3.Genetic exchanges among 17 Groups ofG.sannioInferred from the RAD-seq dataset.(A) Gene flow results obtained from TreeMix analysis.(B) Gene flow results obtained from Genepop analysis.
4.Discussion
The Sichuan Basin in southwestern China is situated to the northeast of the Eastern Himalayas and is an island basin surrounded by several mountain ranges.The mountain ranges encircling the Sichuan Basin contribute to its complex topography, which in turn leads to genetic divergence.Therefore, the unique geological features of the Sichuan Basin and its peripheral mountain ranges make it an ideal location for investigating the genetic divergence of avian species.In this study, we reported on the genetic structure and gene flow ofG.sanniowithin the Sichuan Basin and its surrounding mountain ranges based on RAD-seq data.Additionally, when combined with geographical and ecological data, we unveil the factors that account for the genetic divergence ofG.sannio.The overview of this study is shown in Fig.S2.This study also provides theoretical and technical support for exploring the molecular systematics of the continental islands similar to the Sichuan Basin.
4.1.RAD-seq data of G.sannio
With advancements in molecular biology and bioinformatics, nextgeneration sequencing has become a powerful tool in animal genetic research, including topics such as population genetic divergence, phylogeny of population, evolutionary history, and adaptive evolution(Schuster, 2008; Grada and Weinbrecht, 2013; van Dijk et al., 2014;Zhang et al., 2014; Qu et al., 2021; Campagna and Toews, 2022).Numerous studies provide evidence that RAD-seq technology can be applied to discover the population genetic structure and polygeny in species, whether they possess a reference genome or not (Hanes et al.,2022; Ortiz et al., 2022; Zhang et al., 2022).In this study, we obtained high-quality clean data totaling 285.48 Gb using RAD-seq, generating 977,611 SNPs for analyzing population structure and phylogeny of population.To the best of our knowledge, this study is the first to present RAD-seq data and report the genetic structure ofG.sannioacross its distribution range in southwest China, providing a foundation for future genetic research on this species.
4.2.Genetic structure of G.sannio groups
In this study, when combined with PCA and population structure analysis results, we clearly divided the 17 groups ofG.sanniointo three clusters.This indicates that the high-elevation group (Xichang, Panzhihua, Lijiang and Ludian) from the Hengduan Mountains may share a very similar genetic composition, while the other 12 low-elevation groups from the Sichuan Basin and the Qinling-Daba Mountains have a closer genetic relationship.Additionally, the medium-elevation group(QZY) situated in the transitional zone appears to be a uniquely admixed group.Furthermore, the constructed phylogenetic tree aligns with the PCA and population structure analysis results.In summary, we have essentially categorized the 17 groups ofG.sanniointo three clusters:high-elevation, medium-elevation, and low-elevation groups.These results also signify genetic divergence among these studiedG.sanniogroups.
4.3.Factors accounting for genetic divergence
Previous studies have demonstrated that population divergence can be attributed to ecological adaptation and geographical barriers (Zhu et al., 2017).The Sichuan Basin is a lowland plain surrounded by mountain ranges: the Hengduan Mountains to the west, the Qinling Mountains to the north, the Daba Mountains to the northeast, the Wushan Mountains to the east, the Dalou Mountains to the southeast,and the Yunnan-Guizhou Plateau to the southwest (Li et al., 2022).The topographical complexity of these mountain ranges has led to the creation and development of diverse habitats (He and Jiang, 2014) along steep ecological gradients (He et al., 2019).Additionally, the elevation differences between the basin and surrounding mountain ranges have created habitat heterogeneity, acting as a genetic barrier that limits species movement and reduces gene flow between the populations(Bennett and Provan, 2008; He et al., 2019).This aspect may contribute to genetic differences among populations.Numerous studies have also demonstrated the significant role played by China’s southwest mountains, including the Sichuan Basin, in shaping avian interspecific diversity (Qu et al., 2011; Alstr¨om et al., 2016; Wu et al., 2017).
In our study, genetic differences were observed among highelevation, medium-elevation, and low-elevation groups ofG.sannioin the Sichuan Basin and its surrounding mountain ranges.Consistent with genetic differentiation, the previous study has inferred that morphological differentiation resulting from ecological factors is evident inG.sanniodistributed in southwest China (Wen et al., 2020).Thus, we preliminary proposed that the ecological variation, especially elevation,may induce divergence inG.sanniogroups within and outside of the Sichuan Basin.Additionally, published studies have indicated that geographical isolation and other ecological differences may also contribute to genetic divergence among populations (Nanninga et al.,2014; Manthey and Moyle, 2015; Kramer et al., 2023; Liu et al., 2023).Therefore, we further conducted a series of analyses to identify the specific factors contributing to the genetic divergence of theseG.sanniogroups, primarily considering factors such as geographical distance and ecological factors (elevation and climatic conditions).
To examine the influence of geographical isolation and ecological factors on genetic divergence, we conducted several analyses, including IBD, IBE, and PCA.The IBD analysis results confirmed a significant association between the genetic divergence ofG.sanniogroups and their geographical distance.Furthermore, when considering ecological factors, we observed a distinct division among theG.sanniogroups into high-, medium-, and low-elevation categories.A subsequent partial Mental test further strengthened the strong relationship between elevation distance and genetic distance.Additionally, PCA revealed a notable correlation between climatic factors and genetic structure.Notably, mean diurnal range, minimum temperature of the coldest month, annual precipitation, and precipitation of wettest month were identified as specific key climatic factors.
In summary, our findings strongly suggest that both geographical distance and ecological factors, specifically elevation and key climatic variables, play crucial roles in driving genetic divergence among the 17 groups ofG.sannioin the Sichuan Basin and its surrounding mountain ranges.These results indicate that genetic divergence resulting from geographical distance and ecological gradients is evident in theG.sanniogroups within the Sichuan Basin and its surrounding mountain ranges.
4.4.Genetic adaptation related to key ecological factors
Natural selection plays a pivotal role in generating the existing genetic variation within and between populations, thereby influencing local adaptation (Zhang et al., 2014; Yu et al., 2016; Ma et al., 2022).This fundamental mechanism dictates the survival and reproductive success of individuals possessing genetic traits that confer advantageous fitness in specific environments (Yu et al., 2016; Ma et al., 2022).In this study, we identified significant genetic divergence resulting from five key ecological factors between high-elevation and low-elevation groups.Correspondingly, a greater number of SNPs and selected genes were associated with these five key ecological factors in the high-elevation group compared to the low-elevation group.Additionally, various specific selected genes were observed in different groups.These findings provide valuable insights into the ecologically-driven evolutionary processes and underscore the role of key ecological factors in shaping genetic adaptation in theG.sanniogroups analyzed in this study.
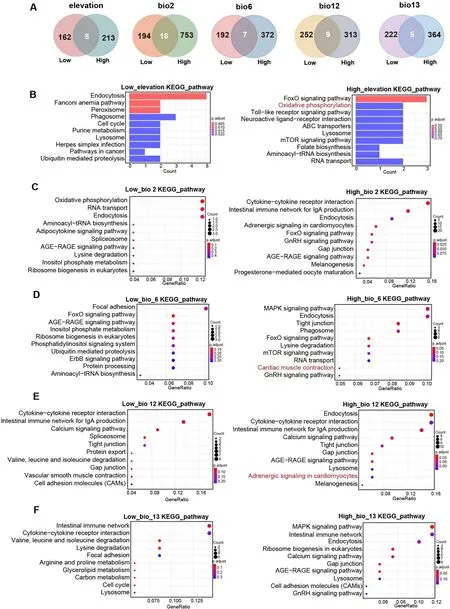
Fig.5.Adaptation response to five key ecological factors.(A) Specific selected genes associated with five key ecological factors in high-elevation and low-elevation groups.(B) The top ten enriched KEGG pathways associated with elevation in high-elevation and low-elevation groups.(C) KEGG pathways associated with bio2.(D)KEGG pathways associated with bio6.(E) KEGG pathways associated with bio12.(F) KEGG pathways associated with bio13.Low: Low-elevation groups; High: Highelevation groups; bio2: mean diurnal range; bio6: minimum temperature during the coldest month; bio12: annual precipitation; bio13: precipitation of wettest month.
Furthermore, we identified a key gene,ADCY9, linked to the adaptation to mean diurnal range and annual precipitation in the highelevation group.High-elevation regions, including areas in Xichang,Panzhihua and Yunnan, are characterized by vast mountain ranges, high elevations, lower seasonal temperatures, and drier conditions (He et al.,2022).ADCY9, a member of the cyclase gene family, exhibits predominant expression in various tissues, including the lung, thyroid, large-B cells, and 24 other tissues (Tang et al., 2023).Notably,ADCY9has been implicated in the modulation of lipolysis at the adipose tissue level,as well as in the regulation of thermogenesis and glucagon signaling in vertebrates (Sazzini et al., 2020).Therefore, this selected gene is speculated to be a potential contributor to the unique adaptations observed in the high-elevation group in response to the challenging environmental conditions in their natural habitats.
The high-elevation group displayed distinct KEGG pathways,including oxidative phosphorylation associated with elevation adaptation, as well as pathways related to cardiac muscle contraction and adrenergic signaling in cardiomyocytes associated with climate adaptation.The frigid and hypoxic conditions prevailing in high-elevation habitats pose significant metabolic challenges for endothermic vertebrates (O’Brien et al., 2020).Notably, oxidative phosphorylation, which facilitates the oxidation of nutrients and subsequent energy release, has been extensively studied in certain high-altitude mammals and avian species (Cheviron et al., 2008; Yang et al., 2016).Cardiac muscle contraction and adrenergic signaling in cardiomyocytes pathways are related to adaptation to the high-elevation environment with hypoxia and low-temperature conditions (Yu et al., 2016; Ma et al., 2022).These findings suggest the existence of specific molecular pathways and biological processes contributing to the adaptive responses ofG.sanniogroups inhabiting high-elevation environments, shedding light on their unique genetic strategies for coping with elevation-related challenges and climatic variations.Using these results, we confirmed that these five key ecological factors play important roles in driving divergence and adaptive potential among theseG.sanniogroups.
4.5.Phylogenetic relationship and gene flow
The phylogenetic tree strongly supports the division of the 17 groups ofG.sanniointo high-elevation and low-elevation groups (including the Sichuan Basin and Qinling-Daba Mountain groups).However, the medium-elevation group (QZY) appears to possess a unique lineage.These phylogeny of population results provide a clue for the evolutionary history ofG.sannio.Based on the phylogenetic tree constructed in this study, we propose that the ancestor ofG.sannioin southwest China split into two lineages: one evolved into the ancestor ofG.sanniothat spread across the Hengduan Mountains and Yunnan-Guizhou Plateau, while another lineage migrated eastward to the Sichuan Basin and subsequently northward, establishing populations in the Sichuan Basin and Qinling-Daba Mountains.During the Quaternary glacial period, the Ice Age reshaped the ecosystems and led to glodal climatic changes (Koppes et al., 2008).Some species developed strategies,including cold adaptation responses or dispersal, in response to these changes.However, the climate fluctuations in the Sichuan Basin were less pronounced compared to other regions (Jablonski, 1993), and some species maintained stable distribution ranges during this period (Wang et al., 2021).Furthermore, the Sichuan Basin appears to have served as a potential refugia for some species during the Quaternary glacial cycles to cope with climatic extremes (Wen et al., 2017a,b).Therefore, we speculate that one clade ofG.sanniomigrated to the Sichuan Basin,possibly in response to the colder Pleistocene climate.
Additionally,G.sannioin Zunyi appears to be an admixed group.Strong gene flow is evident between the Zunyi group and groups in the Sichuan Basin (such as Chengdu and Meishan), indicating the presence of gene flow inG.sannio.Surprisingly, we detected high rates of ancient gene flow among these groups, suggesting the possibility of ancient hybridization.It is likely that the observed gene flow in theseG.sanniogroups living in the Sichuan Basin and its surrounding mountain ranges was influenced by shifting climatic conditions during the Pleistocene glacial cycles.During glacial periods, several species may have been pushed into the Sichuan Basin due to its lower elevations.However,during the warmer interglacial periods, avian species wound migrate to the mountainous regions surrounding the Sichuan Basin (Neigel and Avise, 1986; Wang et al., 2001; Qu et al., 2011).This response to changing climate conditions during the glacial cycles would result in ancient gene flow among these studiedG.sanniogroups.Therefore, it is reasonable to assume that Pleistocene climatic changes played a role in genetic exchanges amongG.sanniogroups.Further research is required to confirm this speculation by calculating the divergence time of these groups using more high-quality genomic data.
5.Conclusions
In conclusion, our study elucidates the genetic patterns ofG.sanniogroups in the Sichuan Basin and its surrounding mountain ranges.Our results showed that the 17G.sanniogroups can be classified into three clades: the high-elevation group, medium-elevation group, and lowelevation group.Genetic divergence appears to be driven by both geographical distance and five ecological factors (elevation and key climatic variables).Moreover, the high-elevation group exhibits a higher abundance of SNPs and selected genes associated with these five key ecological factors compared to the low-elevation group.Notably, the selected geneADCY9and several associated key pathways have been identified as crucial contributors to the ecological adaptation process in the high-elevation group.This provides evidence of genetic divergence within and outside of the Sichuan Basin inG.sanniogroups.Our findings also suggest that Pleistocene climatic changes may have played a role in genetic exchanges amongG.sanniogroups.This research lays the foundation for future studies on the genetic divergence of other continental island avian species.
Authors’contributions
Longying Wen conceived and designed the research; Lu Wang and Fangqing Liu contributed to RAD sequencing and genetic analyses.Lu Wang wrote the manuscript.Lu Wang and Lan Zhao conducted the ecological analyses.Longying Wen, Fangqing Liu, Yaling Xu, Tianyu Zhang collected samples.All authors contributed to revising the manuscript and approved the final manuscript.
Ethics statement
All blood samples were collected according to the international,national and institutional rules considering animal experiments, clinical studies and biodiversity rights.The study protocol was approved by the Leshan Normal University.
Funding
This work was supported by the National Science Foundation of China (31372171), Leshan Normal University research grants(205210094, ZZ201805, CGZZ202002, 205220114, DGZZ202006).
Data and materials availability
Genome assembles and DNA sequencing data were uploaded to the National Genomics Data Center (NGDC) under accession number PR JCA015831.Other tables are available in the supplementary data.
Declaration of competing interest
The authors declare that they have no known competing financial interests or personal relationships that could have appeared to influence the work reported in this paper.
Acknowledgments
We appreciate the support of Dr.Chaohao Du from Leshan Normal University for assistance.We thank Prof.Fumin Lei from Institute of Zoology, Chinese Academy of Sciences for generously donating several samples, and Novogene for their support in genome sequencing.We thank Dr.Pengzhen Huang for providing R script of the Mental test.We especially thank Yong Wang for thoughtful comments on this manuscript.
Appendix A.Supplementary data
Supplementary data to this article can be found online at https://doi.org/10.1016/j.avrs.2023.100144.
杂志排行

Avian Research的其它文章
- Selecting the best: Interspecific and age-related diet differences among sympatric steppe passerines
- Morphology and morphometry of two hybridizing buntings at their hybrid zone in northern Iran reveal intermediate and transgressive morphotypes
- Quiet in the nest: The nest environment attenuates song in a grassland songbird
- Characteristics of cross transmission of gut fungal pathogens between wintering Hooded Cranes and sympatric Domestic Geese
- Fecal DNA metabarcoding reveals the dietary composition of wintering Red-crowned Cranes (Grus japonensis)
- Short-term night lighting disrupts lipid and glucose metabolism in Zebra Finches: Implication for urban stopover birds