Energy balance model to assess the resistance of ballistic protection materials
2023-12-27BogdanStirbuIreneNdindabahiziTomVancaeyzeeleCyrilRobbe
Bogdan Stirbu,Irene Ndindabahizi,Tom Vancaeyzeele,Cyril Robbe
Department of Weapon Systems and Ballistics, Royal Military Academy, Brussels 1000, Belgium
Keywords:Energy NATO Ballistic Protection materials Statistics NIJ Bootstrapping
ABSTRACT NATO standards "AEP-2920 Procedures for the Evaluation and Classification of Personal Armor" and NIJ Standard -0101.06,indicate the method to statistically assess the resistance of personal ballistic protection materials.To be validated and accepted through these procedures,a personal ballistic protection material should withstand an impact of a specific projectile with a probability of a partial penetration confidence level higher than 90%.The present study introduces an energy equilibrium method to assess the confidence level for the probability of partial penetration of ductile and brittle materials.The experiments performed in the Ballistics laboratory of the Royal Military Academy in Belgium,use a modified pendulum method that allowed the quantification of the energy balance before and after the ballistic impact.The results were then compared with the ones obtained using the method specified by the NATO standard and NIJ 0101.06,mentioned above.The outcome of this comparison shows the tendency of the values obtained by the pendulum method to faithfully follow the values obtained according to NATO and NIJ specifications.The presented method is not based on statistical estimations,but instead,an exact method,of computing the energy absorbed by the tested material.This is an advantage for the cases when the material to be evaluated is expensive or it is in the development phase and mass production is not possible.
1.Introduction
The NATO AEP-2920 and NIJ Standard -0101.06 are providing the guidelines to assess the ballistic performance of personal protection materials [1,2].
The ballistic testing of the personal protection materials is presented in NATO AEP-2920 standard as the probability of complete penetration of the material within a specified velocity range.Having a stochastic behaviour,the phenomenon of perforation is characterized by dispersion.The NATO standard indicates the Probit regression method to estimate the highest value of the likelihood function [1].
The NIJ Standard-0101.06 describes a similar testing method as STANAG 2920 with the exception that it uses a logistic regression on the acquired data using the maximum likelihood to estimate the velocity coefficient [2].
Both standards are using a probabilistic approach to estimate the velocity at which a projectile has a 50%chance to perforate the ballistic protection material.
Considerable effort was spent by the scientific community to develop improved statistical models that estimate the perforation probability.Diane Mauchant,in her work,Analysis of Three Different Regression Models to Estimate the Ballistic Performance of New and Environmentally Conditioned Body Armor [3] is presenting a comparative analysis between the three most important regression models,Probit,Logit,and c-log-log,in which they concluded that each method gives consistently satisfactory results for the same data set.
Maldague et al.[4]are studying the prediction accuracy of Probit and STANAG 2920 methods.They calculated the minimum number of shots required for each method,to ensure accuracy and repeatability.They concluded that a minimum of 14 shots are required to obtain an accuracy of ±5 m/s and the repeatability improved with an increased number of shots.
Tahenti et al.[5] proposed a mathematical methodology that models the projectile evolution during the impact phase on the target as a Brownian motion process.In their work,the statistical Chi-square and Kolmogorov-Smirnov goodness of fit test was employed in a Monte-Carlo simulated sample and an experimental one.Their numerical model fitted well with the experimental data for the entire range of velocities fromV0toV100,making it suitable for estimating the projectile's perforation probability for any impact velocity.
The common ground of the presented work is that they start from an existing experimental set of results,used either to estimate theV50employing the different regression models and compare the results between them or to validate their simulated results.Behind everyV50estimation,no matter what the computation method is,sits a set of experimental data.
Aramid and ceramic-based materials are other alternatives to metallic ballistic protection materials.Refs.[6,7] the methodology to assess the ballistic performance of aramid fabrics and composite materials.The method presented is based on computing the energy absorbed by the material as a function of the depth and diameter of the indentation generated by the protection material during the impact with the projectile,in the backing material which in this case is plasticine [2].
Performing the test described in the two standards,and using them to validate each method presented above,require that the ballistic protection material be rectangles of 500 mm×500 mm in size.As presented in Ref.[4],a minimum number of measurements is required to ensure the accuracy and repeatability of the results.For cheaper and mass-produced ballistic protection materials,this size doesn't pose any problems.
The difficulty to perform these tests comes when they must be done on expensive materials that are time-consuming to produce or in the development phase,where the size and number of the samples are important parameters to consider.
G.J.Czarnecki [8] proposed semi-empirical procedures to estimate the ballistic limit based on a single shot only.His model is relying on the energy balance model.He assumes that the ballistic protection material absorbs a fixed amount of energy to ensure its penetration.Also,any change of the impact energy higher than the energy required for the penetration must be identified in the residual energy of the projectile and fragments.
A single-shot model to estimate the ballistic limit of a material is not statistically significant.The kinetic energy balance method,presented in the following paragraphs takes into account the conclusions of Ref.[8]but uses an increased but limited number of shots to assess the performance of the material.It,therefore,solves the problems generated by the limited size and number of samples required,while being statistically more relevant.This method originated from the ballistic pendulum model introduced in 1742 by Benjamin Robin(1707-1751)in his book"New Principles of Gunnery",which was used to evaluate the velocity of a projectile[9].
S.R.Bodner et al.as well as P.S.Symonds et al.[10,11] used the pendulum to test the deflection magnitude of steel and titanium plates to impulse loads.Dimitrios Kakogiannis[12]in his work used the pendulum method to assess the energy absorption of composite structures that can dissipate the energy of an explosion.They concluded that the pendulum method gives reliable measurement results.
The authors of the references that were just mentioned used their experiments with affordable materials such as aluminium or steel.The challenge comes from the materials whose manufacturing process is costly and producing them in large quantities beforeV50validation is unfeasible.
The method presented in this work is an exact method to determine the velocity of the projectile that has a 50%probability to perforate the ballistic protection material.
Four types of materials were evaluated.Three of them were inexpensive steels (St36,St52,and 304 L) and an assembly of SiC and AlMg5-Al2O3that had a high manufacturing cost and for which a limited number of plates were available for testing[13].
Overall,this is a comparative study to evaluate and validate the kinetic energy balance model against the statistical models presented in STANAG 2920 and NIJ Standard-0101.06.
2.Methods
2.1.STANAG 2920|NIJ Standard-0101.06
This work is intended to identify the result accuracy of the kinetic energy balance model against the results obtained using the test methods described in STANAG 2920 and NIJ Standard-0101.06.
Ballistic testing is based on the approach whereby the complete penetration within a specified velocity range is determined using specified projectiles fired at soft armour and/or hard armour,personal armour items,components,or material samples [1,2].
The ballistic test arrangement presented in the two standards is similar and is depicted in Figs.1 and 2 show the equipment of the ballistic laboratory used for the measurements .
It is comprised form a launcher,which in our case consists of a 7.62 mm×51 mm instrumented barrel,placed at 7.8 m away from the target.This distance will ensure that the yaw angle of the projectile will be at its minimum,maintaining at the same time a relatively small space requirement.
Between the barrel muzzle and the target,an infrared velocity measurement screen system is interposed,which will measure the velocity of the projectile.
The projectile is a bullet-simulating projectile-rifle (BSP-R)developed in the framework of a previous study [14].Its design is presented in Fig.3.It is manufactured from a single solid block of 34CrNiMo6steel.This type of steel will ensure the penetration of the target material suffering only plastic deformations.This property is useful for reasons that will be discussed when the energy balance model will be introduced,further into the present work.
The velocity of the projectile is varied by adjusting the propulsive powder quantity.
The assessed materials are 500 mm × 500 mm plates of St37,St52,304 L,and 50 mm × 50 mm SiC glued with Nolax® onto 120 mm×120 mm AlMg5-Al2O3plates,with thicknesses,10 mm,4 mm,and 4 mm for the steels,and 5 mm for the SiC and AlMg5-Al2O3respectively [13,15].To evaluate the energy absorption of the St36,St52,and 304 L steels the size of the samples was reduced to 120 mm × 120 mm.For each of these materials,appropriate projectile velocities were used to ensure the specifications of the standards.
The STANAG 2920 specifies that the target must be strapped to a witness plate (WP) material (0.5 mm thick aluminium plate) in a retainer.The distance between the target and the WP should be at least 14 cm.The surface area of the back face signature (BFS container,Fig.1) material in its retainer shall be orthogonal to the line of fire.
Fig.1.Example of experimental arrangement used for ballistic testing [1].

Fig.2.Experimental arrangement used for ballistic testing: Launcher (left);Drello LS velocity screens (centre);Target (right).
Fig.3.Depiction of a 7.62 mm calibre BSP-R.
The result of each impact is to be qualified as a complete penetration (CP) or a partial penetration (PP).Complete penetration (CP) of the plate occurred when the projectile,a fragment of the projectile,or a fragment of the armour material penetrates,is embedded,or passes through the used WP material.
The steel test plate will be impacted in a pattern also specified by the STANAG 2920 and presented in Fig.4 left (see Fig.6) (see Fig.7) (see Fig.8) (see Fig.5).

Fig.4.Impacting pattern: Steel plates (left);Brittle materials (right).
Fig.5.Pendulum design: Pendulum base (left);Pendulum outer frame (centre);Assembly (right).
Fig.6.Fragment retaining box (left);Recuperated fragments (centre and right).

Fig.7.High-Speed camera video file post-processing.Displacement tracking of the pendulum and the projectile.
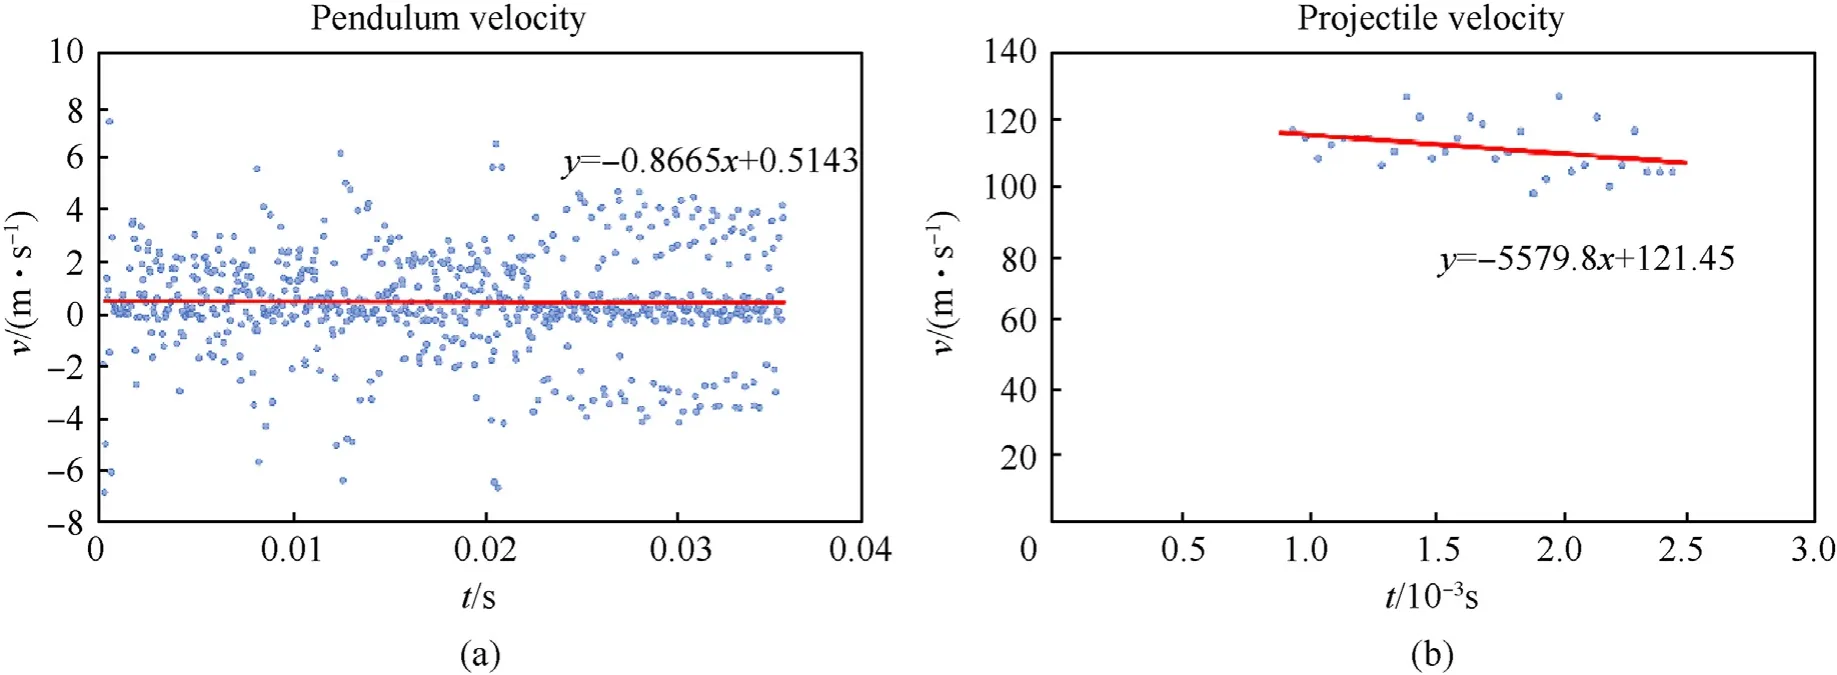
Fig.8.Velocity estimates: (a) Pendulum;(b) Residual velocity of the projectile.

Fig.9.Perforation probability of ST52.: Logit regression method (left);Probit regression method (right).
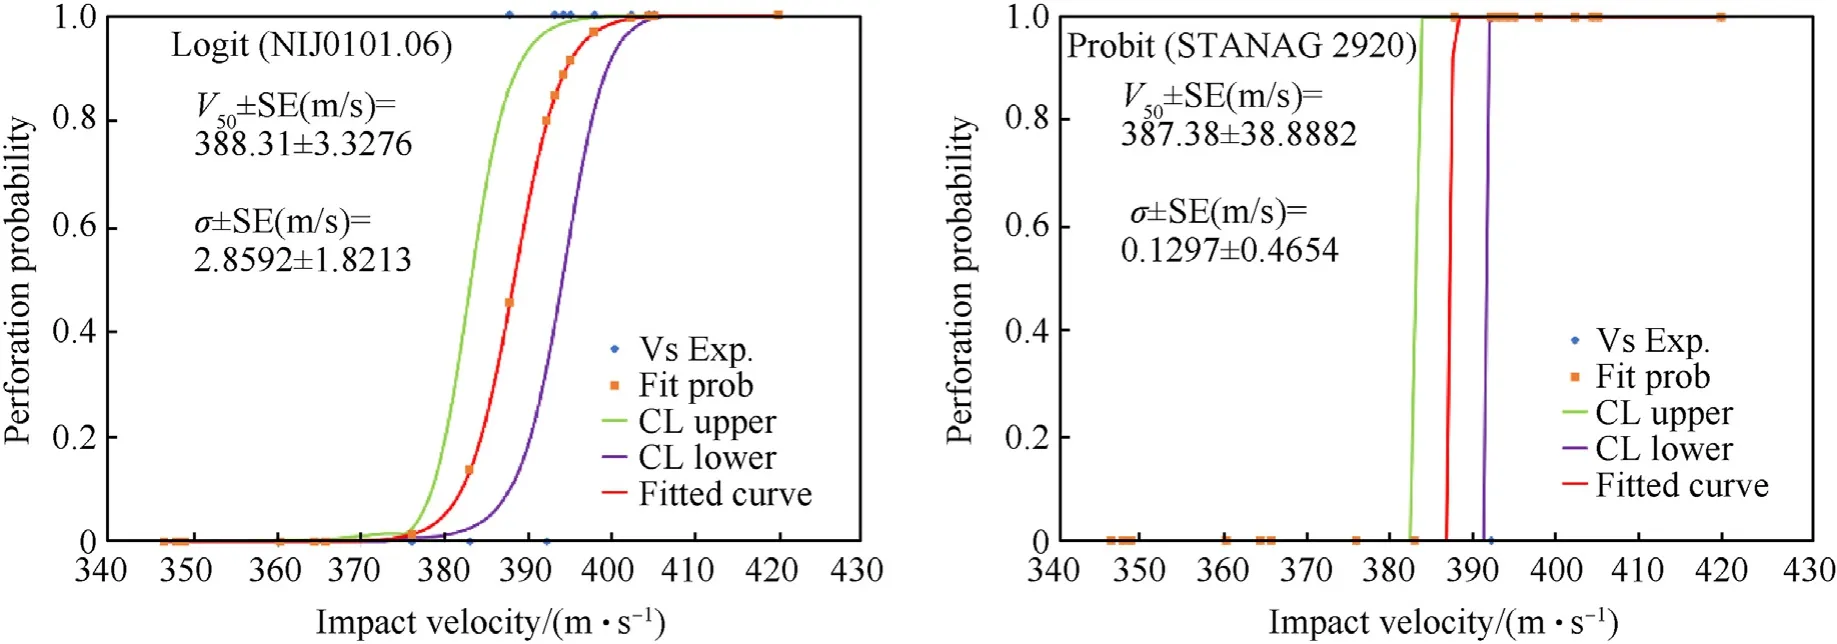
Fig.10.Perforation probability of 304 L: Logit regression method (left);Probit regression method (right).
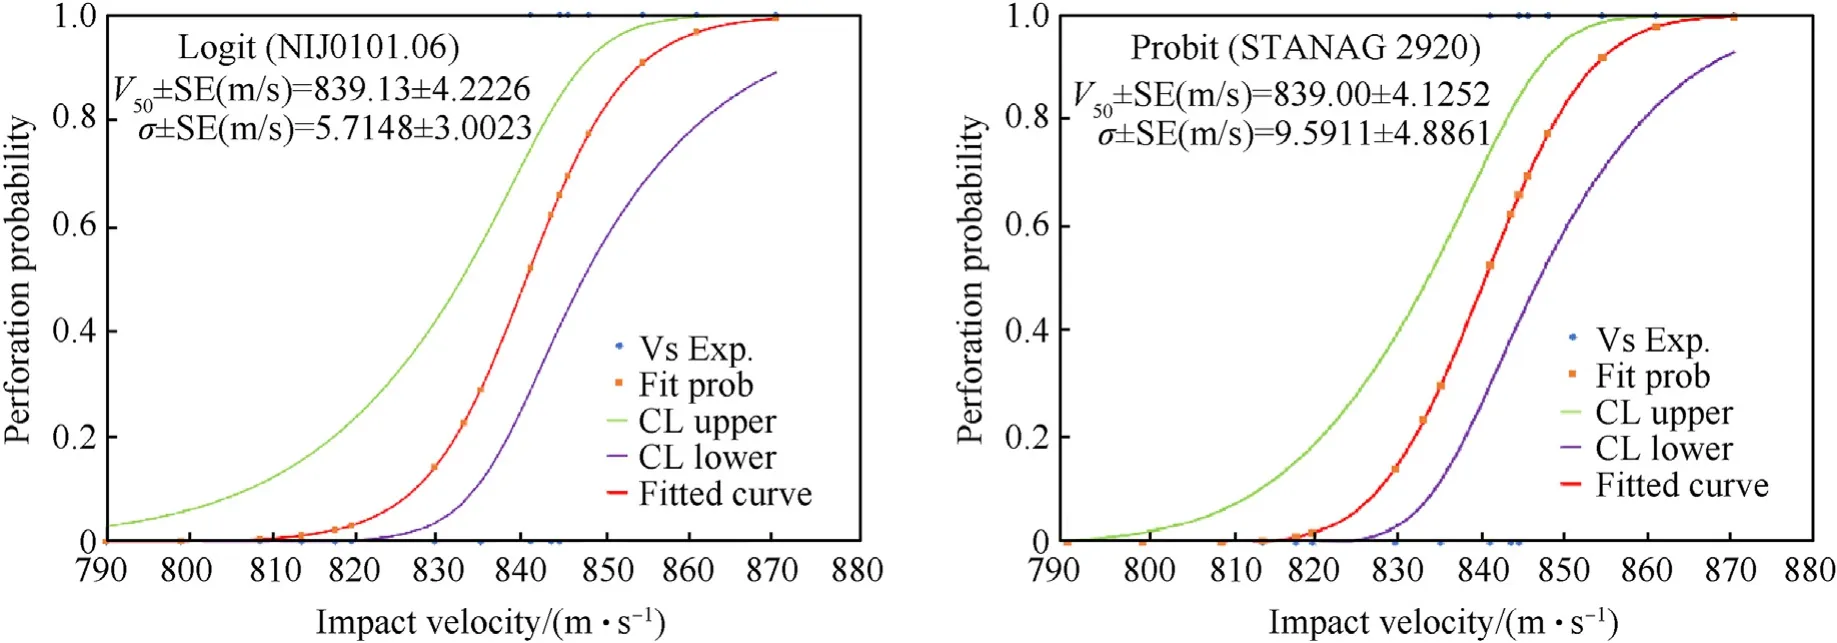
Fig.11.Perforation probability of ST37: Logit regression method (left);Probit regression method (right).

Fig.12.Perforation probability of SiC-AlMg5-Al2O5: Logit regression method (left);Probit regression method (right).
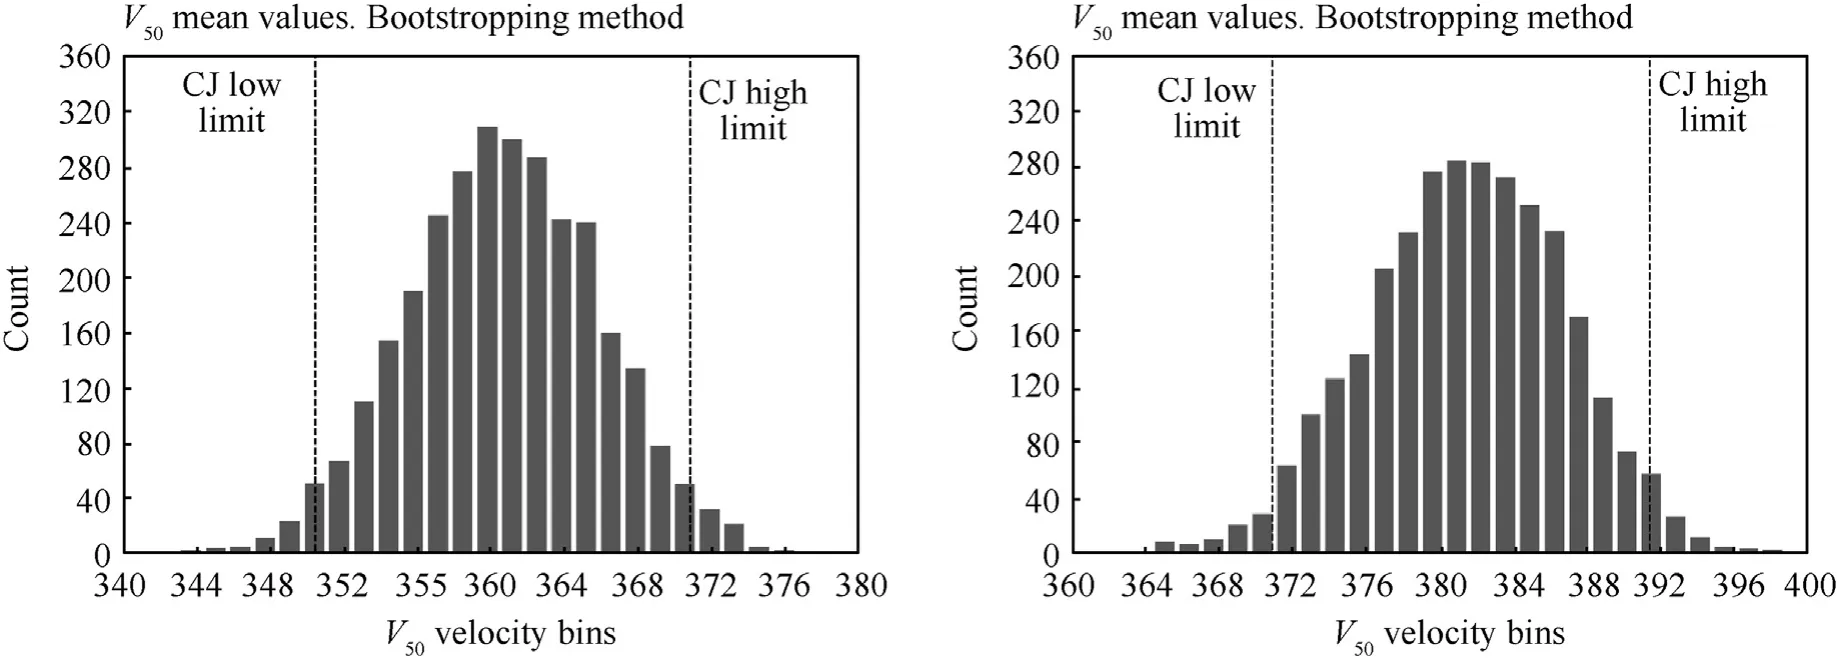
Fig.13. V50 distribution and confidence interval limits: Bootstrapping method,ST52 (left),304 L (right).
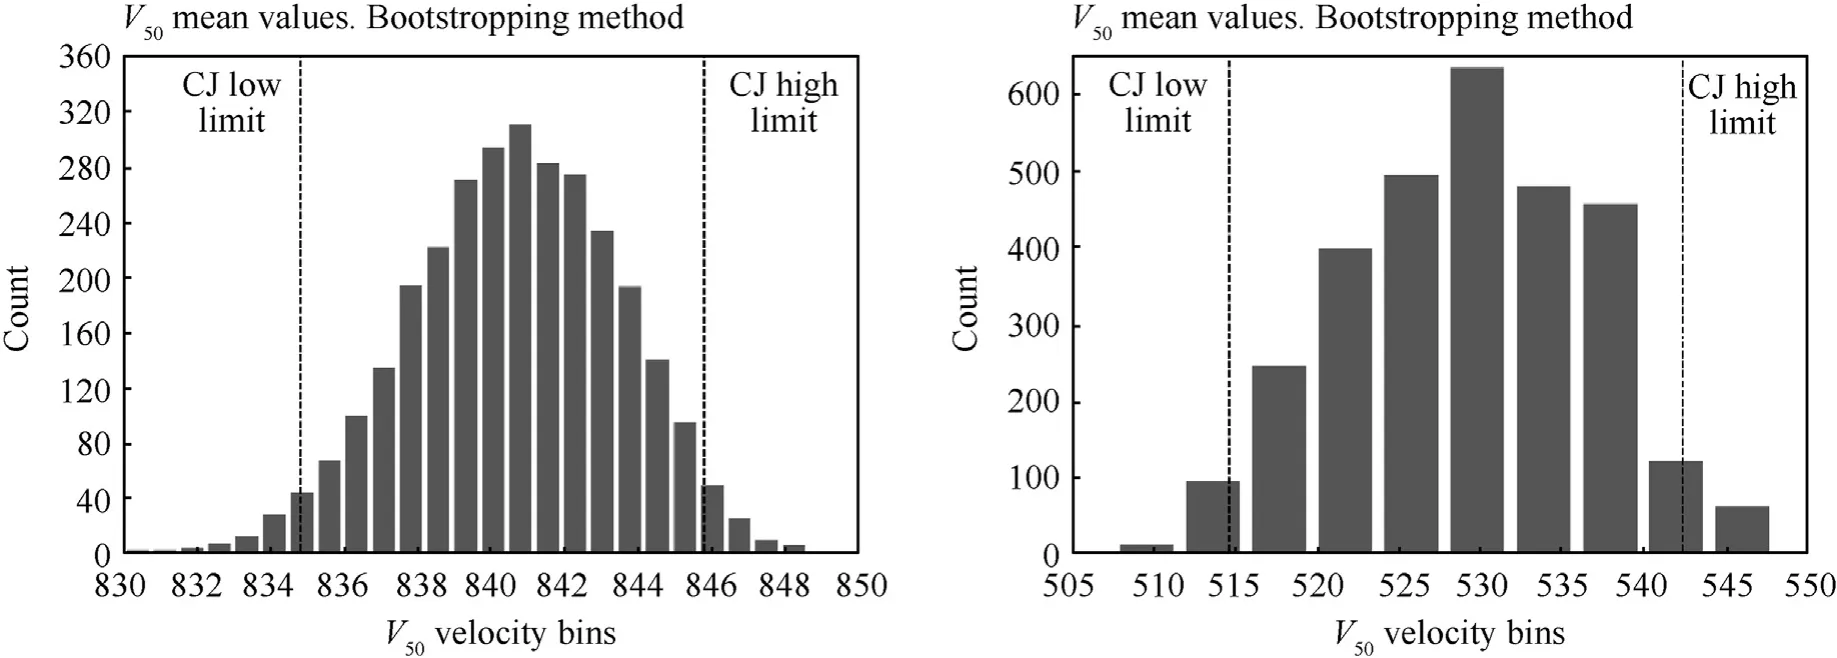
Fig.14. V50 distribution and confidence interval limits: Bootstrapping method (left ST37);SiC-AlMg5-Al2O5 (right) [11,13].
Because the manufacturing time and cost for the brittle materials were high,the size of the tested plates is reduced to a square of 120 mm×120 mm.To accommodate them,a mounting system was designed to receive the plates and the witness plate,presented in Fig.4 right.
Both standards,STANAG 2920 and NIJ 0101.06 are using Probit and Logit regression models to estimate theV50,by computing the maximum likelihood for perforation from the velocity-perforation/no perforation pairs observed during the tests.
2.2.Energy balance model
The energy balance model test setup is similar to the one described in STANAG 2920 and NIJ Standard-0101.06 with the particularity that the target system indicated in the standards is replaced by a pendulum,the witness plate by a retaining box.A high-speed camera is also added,to film and track the projectile and resulting fragments after impact.
The pendulum is fixed to the laboratory's ceiling with four steel cables that in width run outwards,with an approximate angle of 5°,towards the ceiling.This outwards angle makes the pendulum more stable.The impact will occur at the centre of mass to avoid inducing a rotational movement to the pendulum.
Steel cables are capable to withstand the great applied forces and they facilitate the damping of the vibrations that occur in the pendulum during the impact.Their length should be as large as the environment allows.This will make the pendulum's vertical displacement and induced potential energy(PE)neglectable for any small horizontal displacement.To ensure that the horizontal displacements are kept to a minimum,weight can be added to the pendulum.
Each cable is previewed with turnbuckles that allow adjusting their length for levelling the pendulum.
The design accommodates ballistic test plates with maximum dimensions of 120 mm × 120 mm.
The tested sample will be placed between the pendulum base(Fig.5-left) and the pendulum outer frame (Fig.5-centre).
The BSP-Rs were launched with a velocity of 840 m/s to ensure the weapon system's nominal velocity.7.62 mm×51 mm cartridge cases were used to accommodate the propulsive powder.The tested velocities are sufficient for the BSP-R to perforate the test plate.
The deformed projectile and resulting fragments will be collected from the retaining box (see Fig.6) placed under the pendulum.They will be weighed on a precision scale(0.01 g)type"Adam Equipment ADP 360/L",before and after the impact,and their mass will be used to compute their respective energies.
The projectile's impact with the ballistic protection material is filmed with a high-speed camera which one at a frame rate of 20,000 frames/s,placed orthogonally to the projectile's trajectory.This framerate allows tracking and estimating the displacement of the pendulum and projectile.The velocity measurement uncertainty associated with the high-speed camera has an elevated degree of precision,being at the same time robust and reliable [16].
The video file is analysed afterwards with motion detection software.This allows for estimating the displacement of the pendulum and the projectile (see Fig.7).
The velocity of the pendulum and the projectile is computed using the "Tracker®" [17] motion detection software.
Just after the impact,the projectile view is hidden by the pendulum and both the projectile and pendulum have a decelerating motion.Therefore,a decreasing linear regression,the red line on the graphs(see Fig.8),was applied to determine the value of the intercept term that represents the velocity of the projectile or pendulum,just after the collision occurred.
The estimated velocities using linear regression will be used to calculate the energy transferred to the pendulum assembly(pendulum and ballistic protection material) by the projectile and the residual projectile energy.
Unlike the classic pendulum,the potential energy (PE) is neglected because of the pendulum's small rotational angle (θ).
From the continuous mechanics we have the strain energy equation.
where the first term represents the total kinetic energy (KEt) corresponding to the energy of the projectile before the impact,the second term is the strain energy (SDEt)and the last one is the potential energy,which in our case is negligible.
Eq.(2) can be written as follows:
The kinetic energy balance for the studied system is the following:
where KEt(unit: J) is the kinetic energy of the projectile before impact,KEpend(unit: J) is the kinetic energy of the pendulum,KEf(unit:J)is the kinetic energy of the fragments,KEproj(unit:J)is the kinetic energy of the projectile after impact,and SDEt(unit:J)is the total strain energy used to deform the target material and the projectile.
STANAG 2920 and NIJ 0101.106 standards assume that theV50estimation considers both energies (SDEt),the kinetic energy for the deformation of the projectile and the material's deformation.
Combining Eqs.(3) and (4) we obtain.
In other words,the above equation can be written as
whereFmatandxmatare the force and deformation of the projectile and the material,Fpandxpdare the force and deformation of the projectile.
Applying Newton's third law,we can write thatFp=Fmat,and Eq.(6) can be written as follows:
wherempandvp=ap·tare the mass velocity and acceleration of the projectile before impact andtis the impact duration,vmatandvpdare the deformation rates of the material and projectile.
Knowing that the projectile and material are deforming at the same rate(vmat=vpd) Eq.(7)can be written as
From Eq.(8) it is clear that the deformation of a projectile and tested material depend on the impact velocity of the projectile and the rate of deformation of the both.During tests the projectile was launched at velocities that ensured the complete penetration of the tested material.Noting withv2perf=vp·vmatEq.(8)can be rewritten as follows:
From Eqs.(4)and(9)we can deduct the projectile velocity(vperf)for which it will perforate the ballistic protection material,as follows:
*wherempis projectile mass before impact.
We will obtain severalvperfestimations equal to the number of measurements performed.The average of these values will be calculated and represents the best estimate forV50.
The number of recorded results for the energy balance method is not statistically significant.For this reason,the bootstrapping method was used to generate a statistically significant number of results.Bootstrap is a statistical inferences method like the Monte Carlo simulation,with the essential difference in the generation of random variables from a given distribution (assumed known a priori) such as the Normal,chi-squared,student-t,etc.Whereas bootstrap uses random sampling with replacement [18].
Bootstrapping is resampling and replacing values from a single dataset to create a larger number of simulated data sets.This process allows for calculating standard errors,constructing confidence intervals,and performing hypothesis testing for numerous types of sample statistics [18].
3.Results
3.1.STANAG 2920|NIJ Standard-0101.06
For each one of the three tested materials employing the specifications of STANAG 2920/NIJ Standard 0101.06,the quantity of propulsive powder was adjusted according to the standard's recommendation.
Table A1 in Appendix A1,is presenting the obtained results for every tested material.
The "0" and "1" values in the "perfo/no perfo" column of the table are equivalent to "no perforation" and "perforation" of the ballistic protection material,respectively.
The results in Table A1 are used to compute the perforation probability as a function of the impact velocity.TheV50and standard deviation(σ)are estimated by employing the PROBIT method for STANAG 2920 and LOGIT for NIJ Standard-0101.06.Computations were performed using an Excel application developed by the"Defense Research and Development Canada" organization [19].
The red curves in Figs.9-12 represent the perforation probabilities computed using the two regression models.The green and purple curves are the upper and lower confidence interval limits.
The "SE" term added to theV50and standard deviation (σ) estimates,represents the standard error of these values.
3.2.Energy balance model
To estimate theV50using the kinetic energy balance model,the video files recorded by the high-speed camera were analysed using dedicated software,which was capable of estimating the velocity of the moving components of the system and their specific standard error.
wherenis the number of measurements.
TheV50and standard error (SE) obtained for the four ballistic protection materials tested using the energy balance models are presented in Tables A2-A5 Appendixes 2-5.
In the tables,the first four columns are related to the status of the system before the impact.In the next eight columns,the parameters after the impact are recorded.The value"NaN"in Table A4 replaces either masses or velocities of fragments that remained attached to the projectile.
The energy estimations before and after the impact as well as theV50values are comprised in the following four columns.
Because the impact of the projectile with a brittle target will generate multiple fragments with different masses and velocities,for the computation of their energy the total fragment mass and their average velocity were considered.
4.Discussions
Table A1 is showing the number of individual measurements used for theV50estimation,for all the tested materials,using Probit and Logit regression models.On the other hand,when the kinetic energy balance model was employed,the number of performed measurements decreased to 8 for the ductile materials and 4 for the SiC-AlMg5-Al2O3.
Tables A2-A5 are presenting the results taken into consideration in the kinetic energy balance model.Their number is low compared with the minimum number estimated in Ref.[4].One of the perspectives of this study is to verify the accuracy and sensitivity of the kinetic energy balance method.
The average values ofV50estimated by using the kinetic energy bootstrapping methods are compared with the results when the STANAG 2920 and NIJ 01.01.06 methods were used.The results are presented in Tables 1-4,for each one of the material types that were evaluated.
Bootstrapping allows generating multiple data series starting from one series with a small sample size,by random resampling with replacement.In this way,multiple averages of each data series are computed,which in turn will be used to compute their distribution and confidence interval.
Starting from thevperfmeasured for each of the four materials tested,3000 series of values were generated for which the same number of averages were calculated.Then the distribution and confidence interval,of these averages were calculated and presented in Figs.13 and 14.The average of the 3000 average values is considered to be the best estimate ofV50of the material.
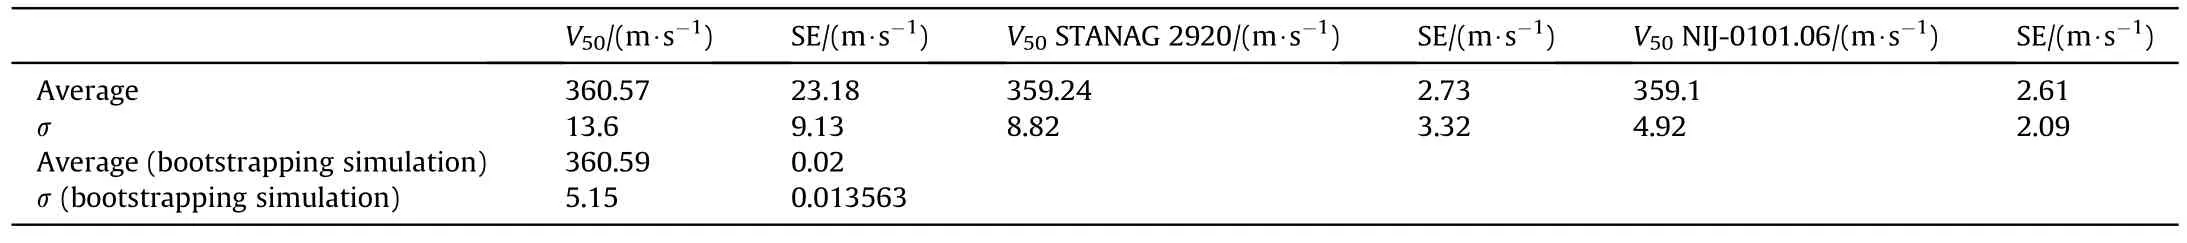
Table 1 ST52-V50,standard deviation and standard error values.
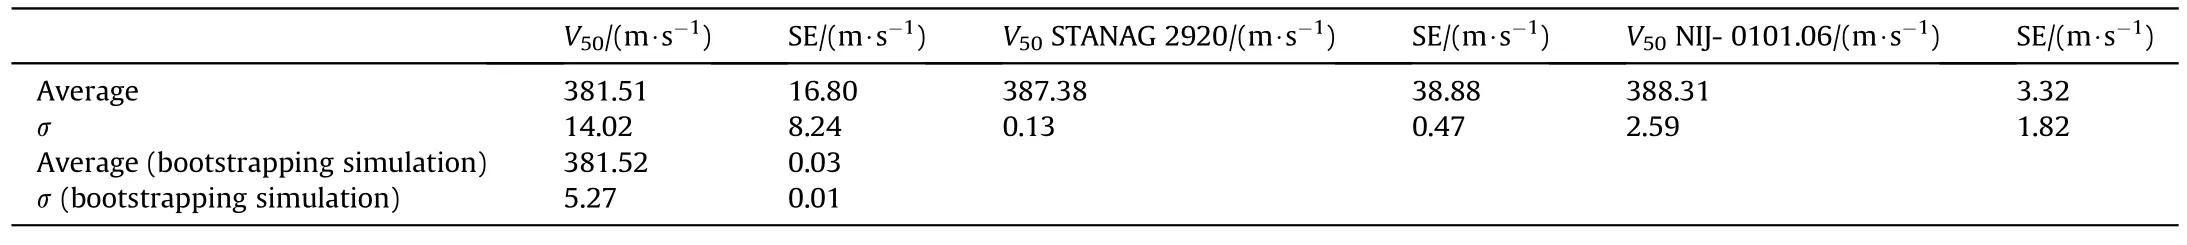
Table 2 304 L-V50,standard deviation and standard error values.
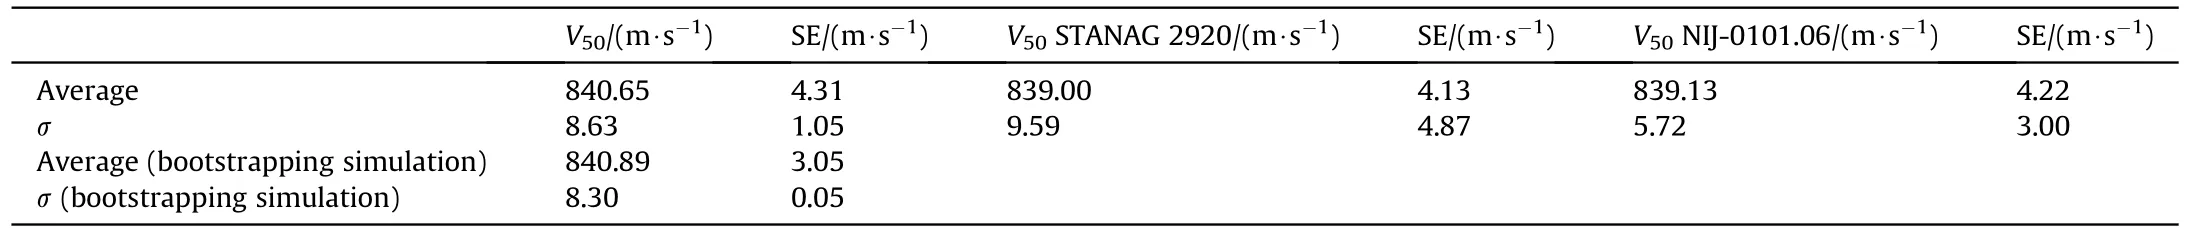
Table 3 ST37-V50,standard deviation and standard error values.
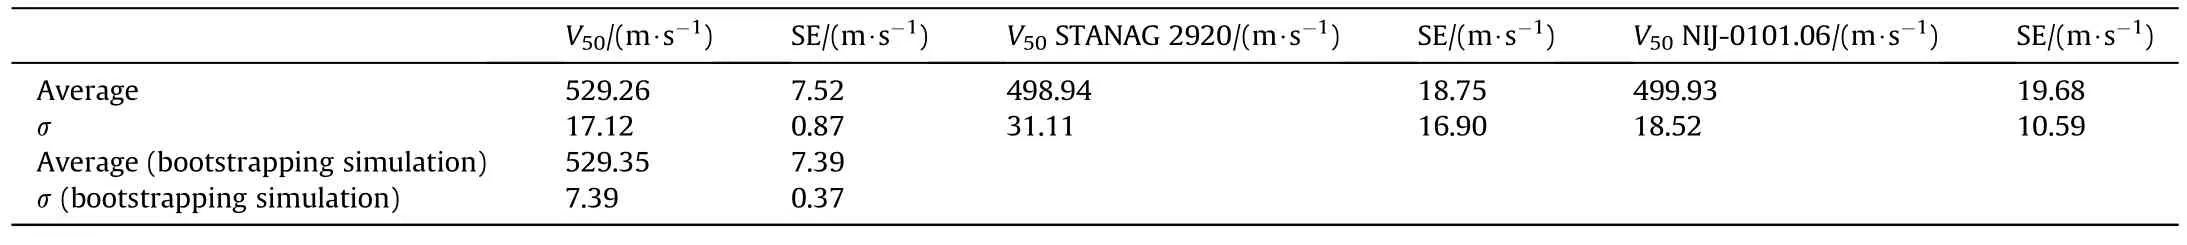
Table 4 SiC-AlMg5-Al2O5-V50,standard deviation and standard error values.
The last two rows of the first three columns in Tables 1-4 are presenting the mean values ofV50estimates obtained employing the bootstrap method.
Tables 1-3 show a good correlation between theV50estimated values by any of the three methods employed.
The probability distributions ofV50of the three materials are presented in Figs.13 and 14.
The histograms in Figs.13 and 14 are showing the distribution of the mean estimatedV50values generated using the bootstrapping method.Their distribution is normal,concentrated around the mean values of about 360 m/s for the 4 mm thick ST52,381 m/s for the 4 mm thick 304 L,841 m/s for the 10 mm thick St37 and 529 m/s for the 10 mm thick,right SiC-AlMg5-Al2O5assembly.The values are remarkably close to the ones calculated from the direct STANAG 2920 and NIJ 01.01.06 measurements for the St52,304 L,and St36.

Table 5 Confidence intervals comparison,St52.

Table 6 Confidence intervals comparison,304 L.

Table 7 Confidence intervals comparison,St37.

Table 8 Confidence intervals comparison,SiC-AlMg5-Al2O5.
Not the same conclusion is valid for,SiC-AlMg5-Al2O3where there is a difference of about 20 m/s between the kinetic energy balance and STANAG 2920/NIJ 01.01.06 methods.This situation occurred due to the small number of values Eq.(4) in the data set used and the assumptions made.Because a large number of generated fragments during the impact,not all of them were tracked to estimate their velocity.Instead,only the largest ones were considered,and their global mass was assumed to be equivalent to the difference between the mass of the tested plate before and after the impact.A second assumption was made on the fragment velocity estimation,which was assumed to be equal to the average velocity of the fragments that were tracked.
The confidence intervals estimated for the kinetic energy balance method by using bootstrapping were compared with the confidence intervals calculated using the "Defense Research and Development Canada" Excel application and presented in Tables 5-8.
Tables 5-7 are showing a good correlation between the averageV50values calculated from the direct measurements using the kinetic energy balance model and the confidence intervals estimated by the PROBIT and Logit regression models.
A positive evolution can be observed for the confidence interval estimated for the SiC-AlMg5-Al2O3,whose upper limit is slightly higher than the limits estimated by the other two regression models,and the lower limit is included in the confidence intervals of the same regression models.
An improvement of the model regarding the estimation ofV50for the brittle materials is to increase the number of recordings or to have a better estimation of the total kinetic energy of the fragments.
5.Conclusions
(1) The present works proved that the kinetic energy balance model generates accurate results for a smaller number of recordings.This presents an economical advantage for materials whose manufacturing process costs are elevated,like the SiC-AlMg5-Al2O3[15,20],which is in the development and testing phase.
(2) STANAG 2920 and NIJ 0101.06 regression models return a singleV50estimation after computing the maximum likelihood of perforation from several measurements.The kinetic energy balance model is capable to estimate a value forvperffrom every single measurement.The average of these values is the best estimate forV50.
(3) For Probit and Logit regression models a sufficiently large number of measurements are required [4] to ensure an overlapping zone.On the other hand,the kinetic energy balance model can predict aV50value with a lower number of measurements.
(4) The kinetic energy balance model together with bootstrap analysis provides accurate results with a confidence level like the consecrated regression models presented in STANAG 2920 and NIJ 0101.06.
(5) A too-low number of measurements will result in poor accuracy of the estimation.This behaviour is presented in Figs.13 and 14 and Tables 4 and 8.
(6) Using the energy balance approach to estimate theV50requires more expensive equipment and it is more timeconsuming for the post-processing of the results than the methods presented in STANAG 2920 and NIJ 0101.106.
(7) Because it requires a significantly lower number of measurements (minimum 7) to accurately predict theV50than the Probit and Logit models,and taking into consideration the economical aspect of the ballistic protection materials,it is a good alternative method to the regression models.
Appendix A1
(8) It was shown that theV50estimation for ductile materials using the kinetic energy balance model and BSP-R,is accurate because,after the impact,only one fragment is dislocated from the target material.The impact of the BSP-R with a brittle target will remove multiple fragments of different masses and velocities.Using the total mass of the fragments and the average velocities gives good predictions ofV50.To improve the method to compute the energy of each fragment by assigning to each one its respective mass and velocity.
(9) Future work can be done to compare the energy balance model with the STANAG and NIJ standards for the aramid composite fabrics.Once the method will be validated for these materials,the energy balance model will find implementation in works where manufacturing of the materials is expensive and time-consuming.
Declaration of competing interest
The authors declare that they have no known competing financial interests or personal relationships that could have appeared to influence the work reported in this paper.
Acknowledgements
SiC-AlMg5-Al2O3material was provided to our ballistic laboratory by the Swiss Federal Laboratories for Materials Science and Technology courtesies of Mr Marc Leparoux.
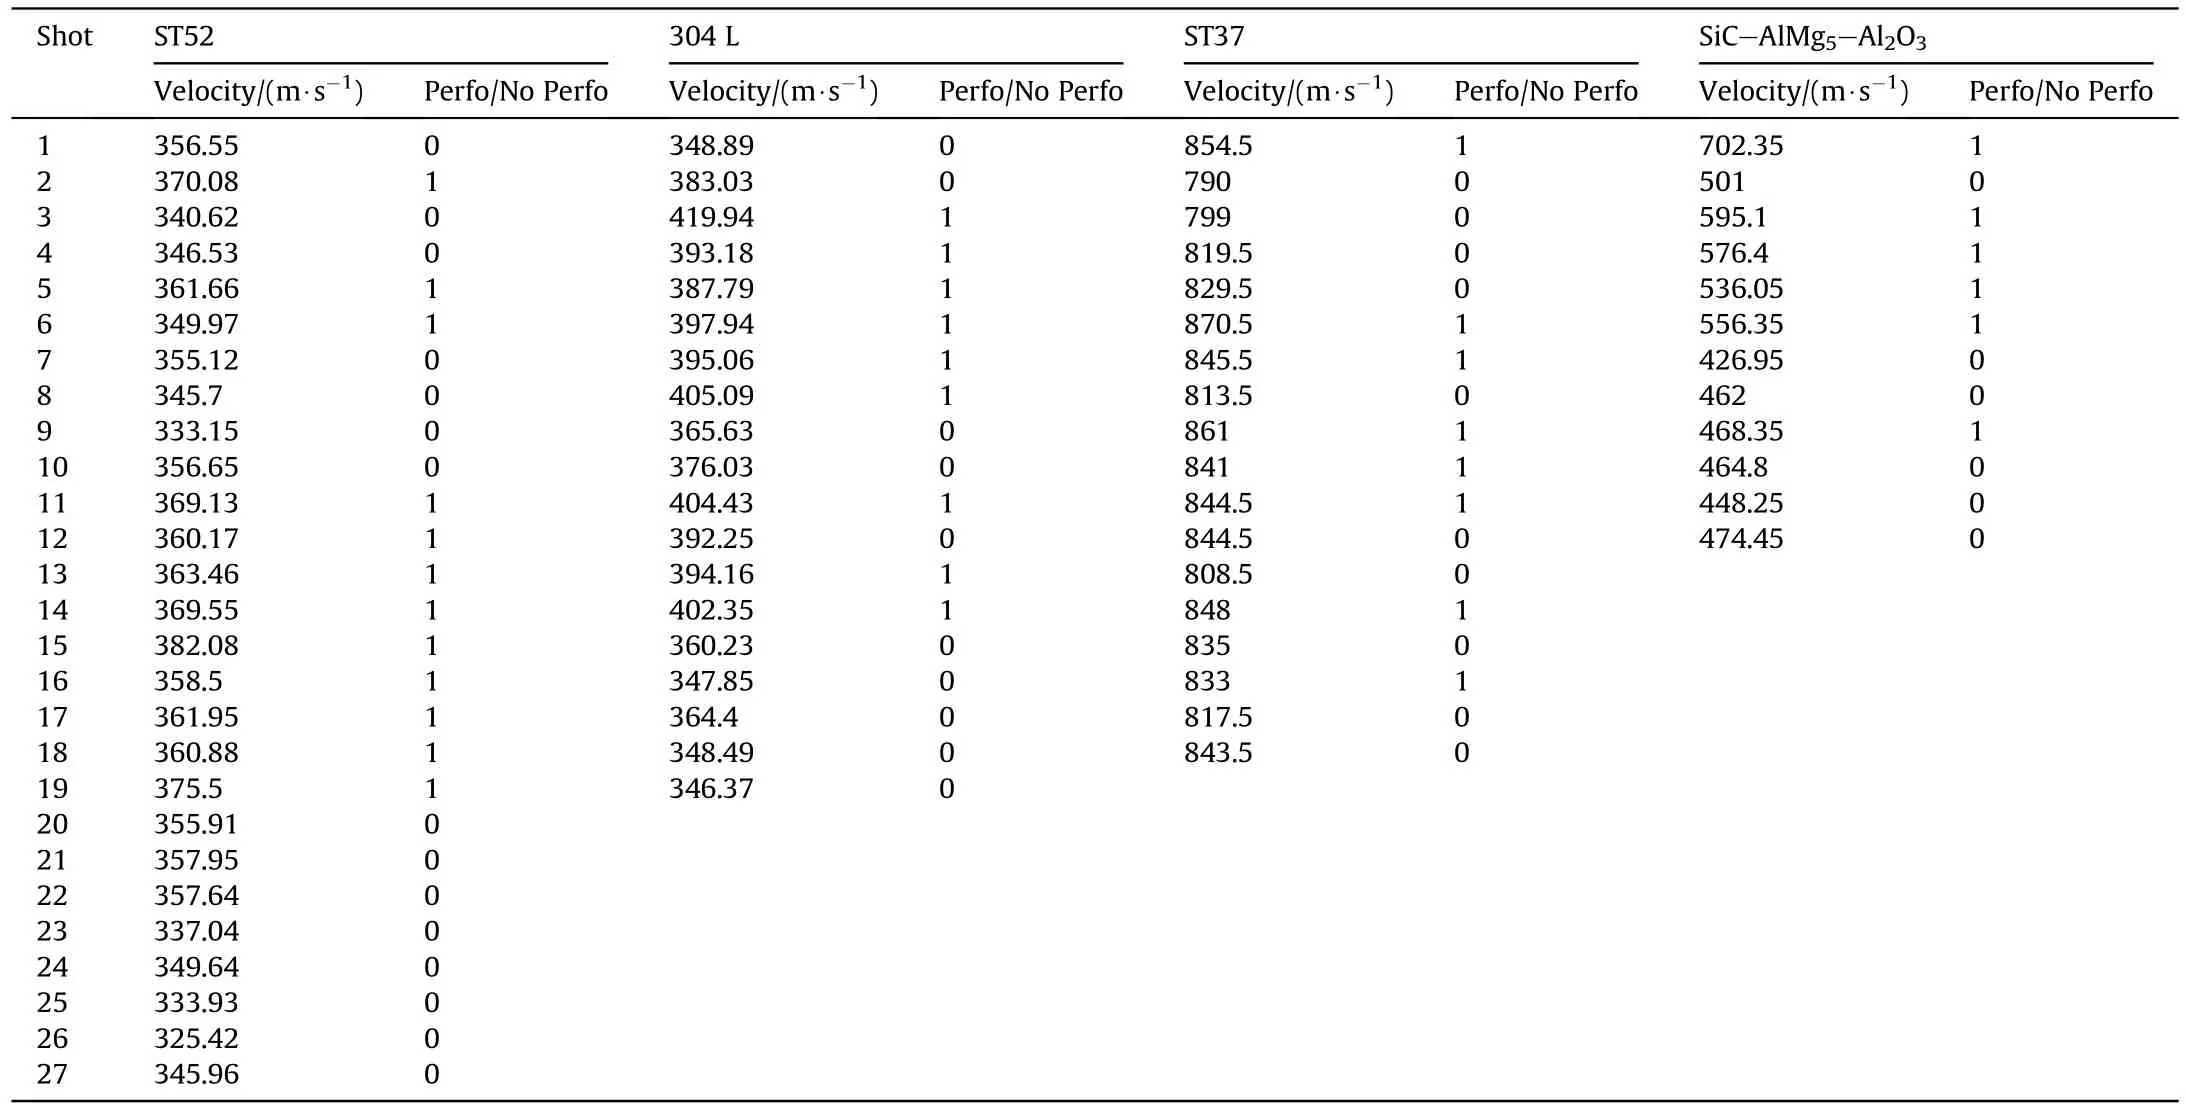
Table A1 Peroration/No Perforation results as a function of impact velocity.
Appendix A2
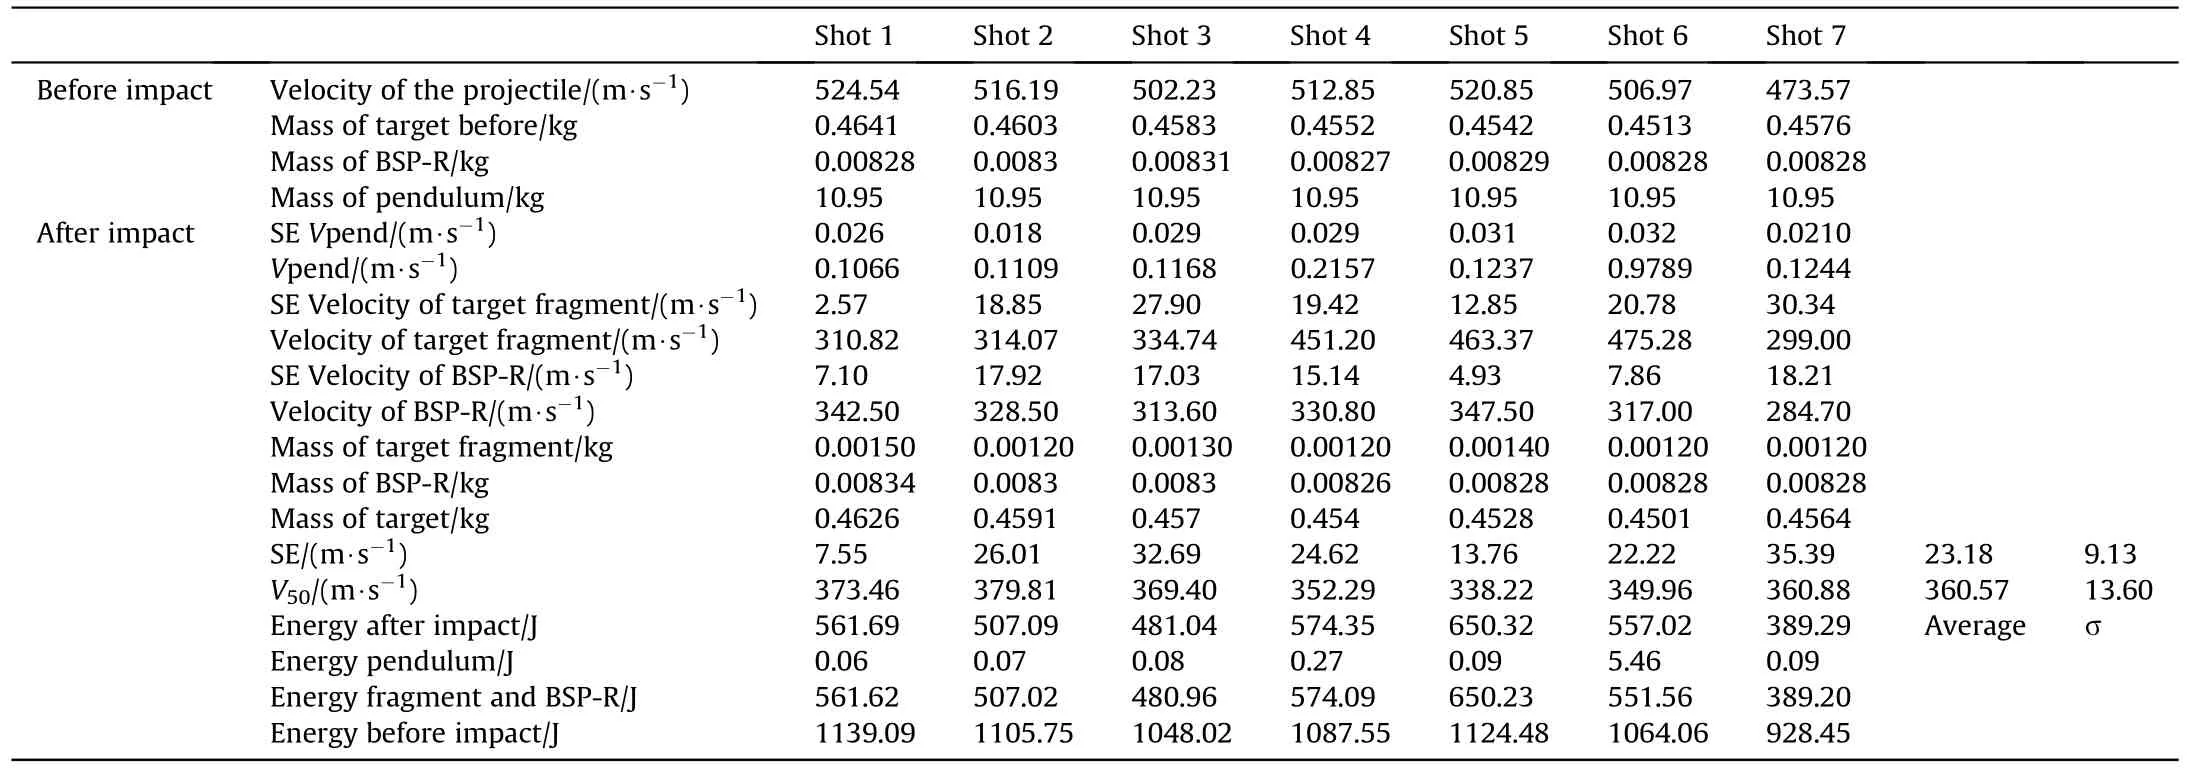
Table A2 V50 results for St52.
Appendix A3

Table A3 V50 results for 304L material.
Appendix A4

Table A4 V50 results for St37 material.
Appendix A5
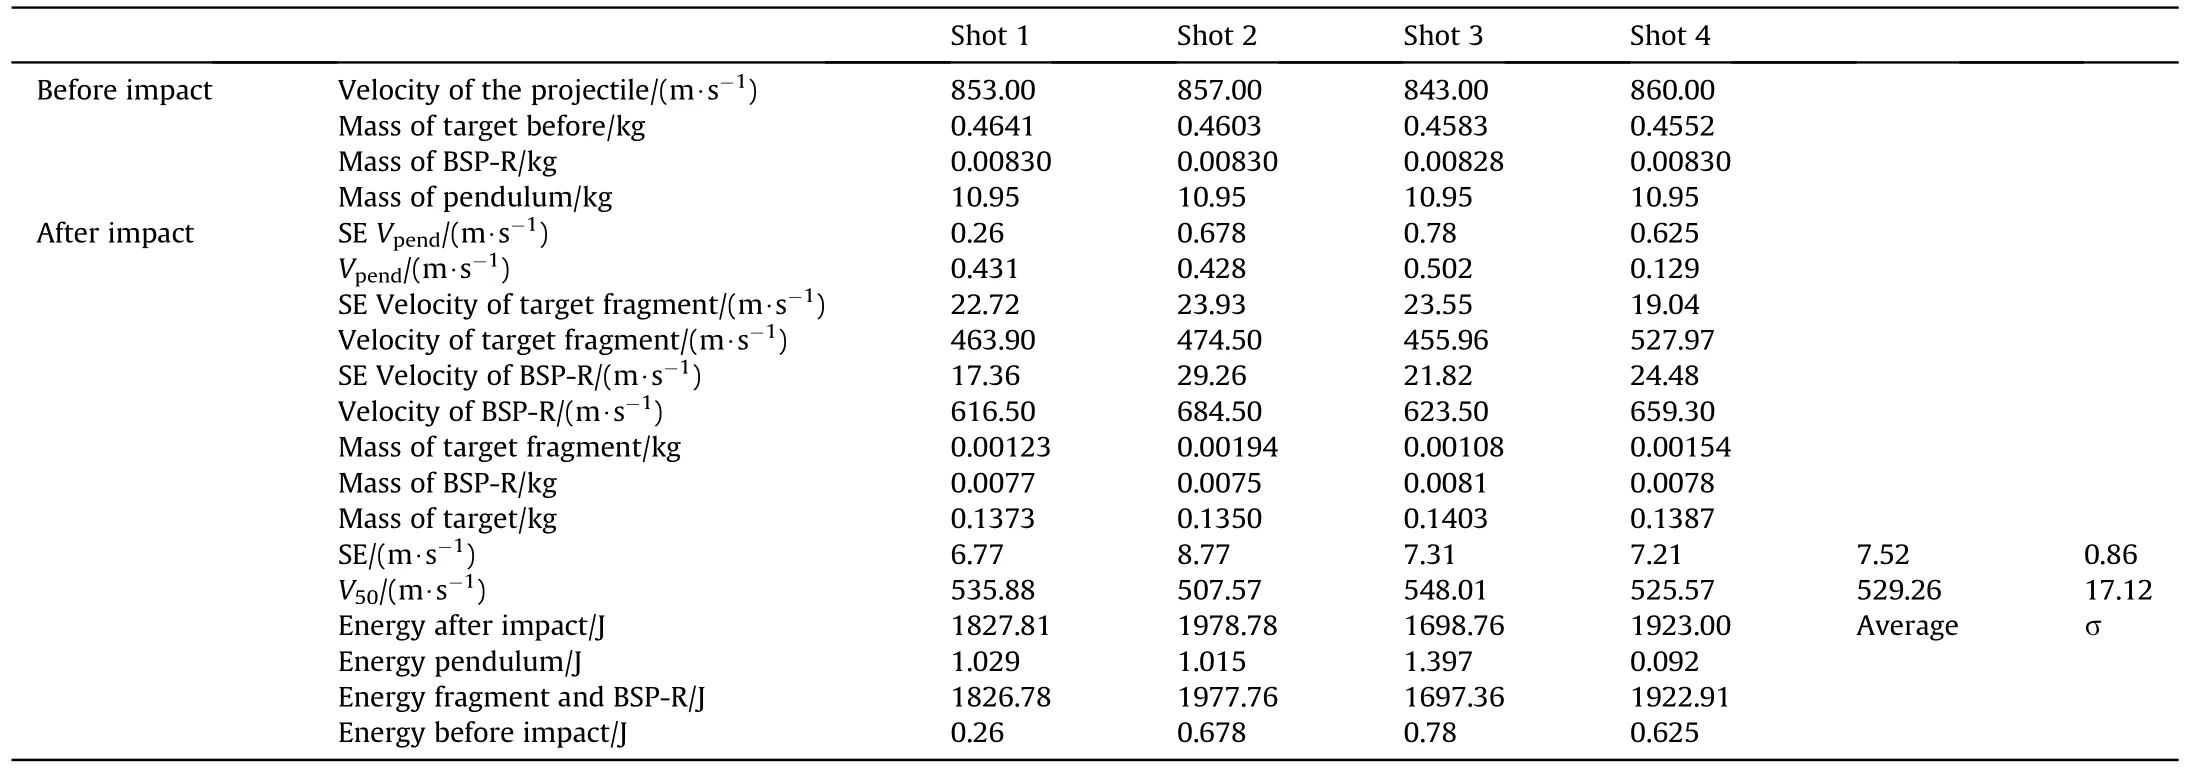
Table A5 V50 results for SiC-AlMg5-Al2O5 material.
杂志排行

Defence Technology的其它文章
- Interaction of water droplets with pyrolyzing coal particles and tablets
- Multifunctional characteristics of 3D printed polymer nanocomposites under monotonic and cyclic compression
- The concept of sUAS/DL-based system for detecting and classifying abandoned small firearms
- Modelling and predicting the dynamic response of an axially graded viscoelastic core sandwich beam
- Development of bimetallic spinel catalysts for low-temperature decomposition of ammonium dinitramide monopropellants
- Thrust characteristics of nano-carbon/Al/oxygenated salt nanothermites for micro-energetic applications