Influence of quenching medium on the dendrite morphology,hardness,and tribological behaviour of cast Cu-Ni-Sn spinodal alloy for defence application
2023-12-27BipinSankarKarthikShankarVamuSunilHemanthKashyapNikhilNairAdarshNairAbhinav
Bipin Sankar,Karthik V Shankar,Vamu Sunil,Hemanth Kashyap S,Nikhil Nair,Adarsh A.Nair,Abhinav P M
Department of Mechanical Engineering, Amrita Vishwa Vidyapeetham, Amritapuri, India
Keywords:Quenching Water Brine SAE 40 oil Grain size Hardness Wear rate Spinodal decomposition CuSn Spinodal alloy CuNiSn
ABSTRACT Cu-Ni-Sn spinodal alloys (Spinodal bronze) are potential materials with robust applications in components associated with defence applications like bearings,propellers,bushes,and shafts of heavily loaded aircraft,off-road vehicles,and warships.This paper presents a comparative study using water,Brine solution,and SAE 40 oil as the quenching media in regular bronze (Cu-6Sn) and spinodal bronze(Cu-9Ni-6Sn) alloys.Morphological analysis was conducted by optical microscopy,transmission electron microscopy (TEM),and X-ray diffraction technique (XRD) on bronze and spinodal bronze samples immersed in the three different quenching media to understand the grain size and hardness values better.Tribological analysis was performed to analyze the effect of quenching media on the wear aspects of bronze and spinodal bronze samples.The hardness value of the brine-aged spinodal bronze samples was as high as 320 Hv,and the grain size was very low in the range of 60 μm.A quantitative comparison between brine-aged regular bronze and brine-aged spinodal bronze showed that the hardness(Hv) was almost 80%higher for brine-aged spinodal bronze.Further,the grain size was approximately 30%finer for spinodal bronze when compared with regular bronze.When the load was increased in spinodal bronze samples,there was an initial dip in wear rate followed by a marginal increase.There was a steady increase in friction coefficient with a rise in load for brine-aged regular bronze and spinodal bronze samples.These results indicate that brine solution is the most effective quenching medium for cast Cu-Ni-Sn spinodal alloys.
1.Introduction
Copper and its alloys have a perfect blend of mechanical,electrical,and tribological properties like strength,conductivity,machinability,and corrosion resistance,making it an apt and automatic choice for industrial applications.Amongst the copper alloys,bronze,a cost-effective alloy of copper and tin(Cu-Sn),has high electrical and thermal conductivity,better mechanical strength values like tensile strength and yield strength,high dimensional precision,and is resistant to corrosion as well.This makes bronze suitable for manufacturing components like bushings,bearings,and propellers related to automobile,aircraft,marine,and defence applications.Studies have also shown that Cu-Sn has been employed as anti-wear and friction-reducing material.However,bronze is susceptible to hazards like bronze disease,a green film formation on the surface when exposed to moist air,which can adversely affect the above-mentioned properties.Copper beryllium (Cu-Be) alloys are another category with prospective industrial applications,but these alloys also possess health hazards.
Cu-Ni-Sn spinodal alloys developed by the Bell Laboratory have evolved as a potential and prospective alternative to Cu-Be alloys.The mechanical properties such as tensile strength,yield strength,ductility,and hardness that Cu-Ni-Sn alloys,strengthened by spinodal decomposition,are equivalent to Cu-Be alloys[1-4].There are toxic and hazardous challenges associated with Cu-Be alloys,unlike in Cu-Ni-Sn alloys [3].Cu-Ni-Sn alloys are highly tolerant and resistant to corrosion with marginal friction and wear characteristics and high toughness values.Bearings used in defence appliances demand lighter weight,high robustness,superior strength,more resilience,and resistance to damage,and the spinodal bronze alloys satisfy these criteria positively [3-5].Numerous significant studies have already been done to analyze and assess Cu-Ni-Sn spinodal alloys' morphological and mechanical characteristics [6-8].A conventionally wrought spinodal hardened Cu-Ni-Sn alloy has a superior yield strength of 758 MPa compared to the commonly used aluminium bronze with a yield strength of 621 MPa,indicating that weight can be lowered for components used in the aerospace and automobile industry by employing Cu-Ni-Sn alloys [9].Commercialising wrought Cu-Ni-Sn spinodal alloys had drawbacks due to the formation of hot cracks during rolling and forging operations.Casting and powder metallurgy then evolved as a potential alternative for manufacturing Cu-Ni-Sn spinodal as it eliminated hot crack formation to an extent enabling the fabrication of more significant section components.Microstructural analysis of the copper-based spinodal alloys is more invasive and definite using Transmission Electron Microscopy (TEM) in comparison to optical microscopy(OM) and Scanning Electron Microscopy (SEM) as the modulated spinodal structure in the Nanoscale making visibility complex.
Studies analysing the tribological characteristics of Cu-Ni-Sn spinodal alloys have been limited [10-12].Ilangovan et al.[12]conducted a tribological study on sand-cast Cu-7Ni-4Sn spinodal bronze.It was confirmed that specific wear rate(SWR)was mainly influenced by ageing time,sliding velocity,and load applied.Singh et al.[13,14] has investigated the dry sliding wear behaviour and microstructural analysis of Cu-Ni-Sn spinodal alloy against SS 440C steel.When these 2 specimens slide against each other,a transfer layer possessing Nano crystalline grains is formed at the interface.The authors have found that this transfer layer is the primary source of wear debris and contains oxides.A Cu-15Ni-8Sn spinodal alloy was considered for the investigation.When a load of 980 N was applied at a sliding velocity of 0.25 m/s in the Argon atmosphere,the coefficient of friction (COF) was 0.34,and when the sliding velocity decreased to 0.10 m/s,c.o.f reduced to 0.294.These values indicate a reduction in wear rate with respect to the decrease in sliding velocity.Further,the authors confirmed that the wear's severity would be higher whenever the load is high under dry conditions [13,14].
Defence components often demand high strength and high conductivity.The cu-9Ni-6Sn alloy was chosen for this work because for these reasons.Cu-9Ni-6Sn spinodal possesses strength as high as 1200 MPa and conductivity of 8.4% IACS.Appropriate thermo mechanical processing enables the tensile strength of Cu-9Ni-6Sn to be adjusted as well.Cu-9Ni-6Sn alloy also possesses a very high Rockwell hardness value of 30 HRC[15].These characteristics make Cu-9Ni-6Sn alloy a suitable choice in defence applications.
The typical heat treatment procedure broadly involves homogenisation,solutionising,and ageing.Quenching is another critical intermediate process in which the alloy specimen is rapidly cooled to maintain and enhance the mechanical properties and the phase distribution.Some commonly employed quenching media are water,brine solution,SAE40,and paraffin [16,17].The quenching media should be selected to minimise residual stresses formed during phase transformation [18].Using water and oil as quenchants has its merits and demerits.A martensitic structure is formed when water is employed as the quenching medium.Still,the additional tempering operation must be performed to get the desired properties,which incurs more cost.In contrast,oil as a quenchant leads to adverse mechanical properties due to insufficient cooling rates[18].These limitations have led to trials of brine solution,polymeric solutions,and SAE oils as prospective quenching media.
The role of quenching media in the tribological behaviour of cast bronze and spinodal bronze (Cu-Ni-Sn) alloys is still to be explored and investigated.This investigation aims to conduct a tribological analysis of cast Cu-6Sn and Cu-9Ni-6Sn alloy subjected to quenching in 3 different media.The three quenching media are water,brine solution,and SAE 40 oil.Subsequently,the effect of load on wear rate (WR) and coefficient of friction (COF),sliding velocity on WR and COF,and the effect of quenching media on WR and COF are studied.The hardness value corresponding to the three quenching mediums was also determined.
2.Formulation of work
2.1.Material selection procedure
The toxic properties and high cost associated with Cu-Be alloys lead to the present work's choice of Cu-Sn and Cu-Ni-Sn spinodal alloys.Cu-Sn alloys(Bronze)are abundant in availability and nontoxic in nature.These bronze alloys possess high thermal conductivity,better corrosion resistance,and excellent elasticity.However,the Cu-Sn alloys fabricated through continuous casting feature defects like diminished surface quality,porosity,and inverse segregation [19,20].The Cu-Ni-Sn spinodal alloy has superior strength,toughness,conductivity values,and less cost than Cu-Be alloys.The selection of copper ternary alloy composition was based on the spinodal decomposition perspective and the weight percentage of tin and nickel(Sn from 2 to 8 wt%,Ni from 2 to 20 wt%)[19,20].The alloy sample composition of Cu-6Sn and Cu-9Ni-6Sn was preferred for this work.
2.2.Preparation of Cu-Sn and Cu-Ni-Sn alloy by casting
Permanent mould casting (PMC) was employed for fabricating Cu-6Sn and Cu-9Ni-6Sn alloy.The alloy composition was melted in a clay graphite crucible with an industrial electric furnace.PMC is identical to sand casting but utilises permanent mould with high thermal conductivity,enabling repeated use and thermal cycling.The higher the thermal conductivity,the higher the heat transfer rate and the lesser the time for solidification.As shown in Fig.1(a),the industrial electric furnace was maintained at 1250°C following the Cu-Ni-Sn ternary phase diagram[12].Fig.1(b)and 1(c)depicts the casting sequence,and Fig.1(c) shows the cast rods for experimental investigation.Cast Cu-Sn and Cu-Ni-Sn rods of the desired dimensionsφ36 mm×156 mm in length were obtained by pouring the molten metal into the permanent mould coated with LUBRIKOTE die coat material.The cast and machined Cu-6Sn,and Cu-9Ni-6Sn rods are shown in Fig.2.After the metal casting process,the developed alloys were subjected to spectrochemical analysis using optical spectroscopy (SPAS-02 spectrometer).Four samples were tested from each alloy,and an average value was calculated.The spectroscopy results of the developed Cu-6Sn and Cu-9Ni-6Sn alloys are reported in Table 1.The authors observed from Table 1 that the composition of the developed alloys was found to be within the variation of ±0.2 wt%-0.3 wt% from the original composition.
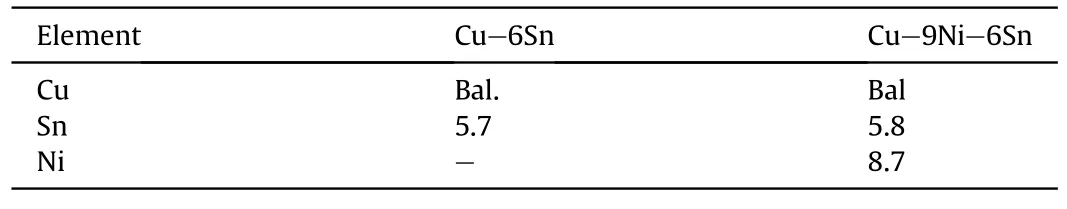
Table 1 Average spectroscopy results of developed alloys.
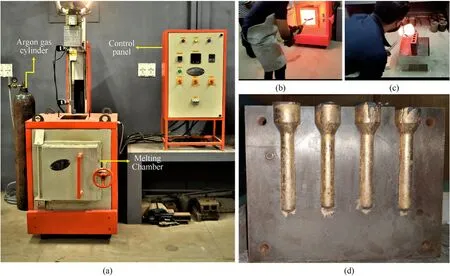
Fig.1.Image showing: (a) Industrial melting furnace;(b),(c) Sequence of casting;(d) Cast rods.
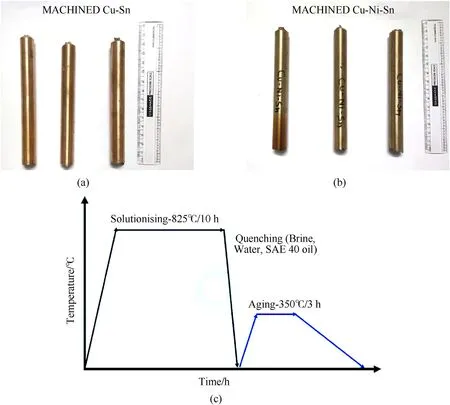
Fig.2.Image showing: (a),(b) Cast and machined rods;(c) Heat treatment process.
2.3.Heat treatment process
The cast Cu-6Sn and Cu-9Ni-6Sn rods were subjected to various stages of heat treatment commencing with homogenisation,solutionising,quenching,and finally ageing.The solutionising process was done at 825°C for 10 h[21],followed by a quenching or rapid cooling to maintain the α phase in the supersaturated condition.The quenching media were water,SAE 40 oil,and brine solution.The water quenching was done after the specimens were heated to 825°C and immersed in a water bath of 30°C for 10 min.The heated specimens were immersed in a brine solution of 20°C for 10 min for brine quenching.The heat-treated specimens were oil quenched at room temperature for 10 min.The quenched rods were then aged at 350°C for 3 h.Fig.2(c) depicts a schematic diagram of the heat treatment process followed in this present investigation.The heat treatment process,as well as the cast rod fabrication,took place under inert argon conditions.Fig.3 depicts the experimental methodology followed in this present investigation.Advanced instrumental characterisation (XRD and TEM)techniques were used to characterise the developed Cu-6Sn and Cu-9Ni-6Sn alloys.Table 2 shows the heat treatment conditions of the produced alloys.
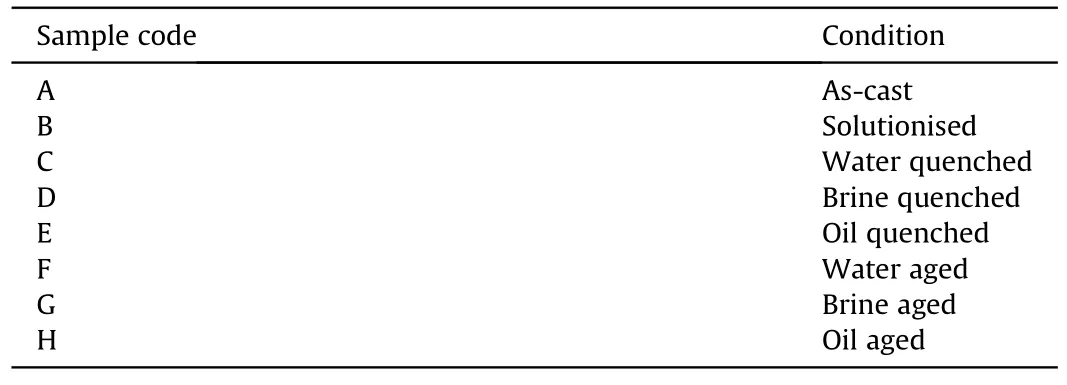
Table 2 Various conditions of samples used.
Fig.3.Experimental methodology.
2.4.Metallurgical analysis
The morphological analysis was conducted using Carl Zeiss optical microscope.The permanent mould-cast alloy specimens of Cu-6Sn and Cu-9Ni-6Sn were ground using a bench grinder.Subsequently,burrs were removed from the samples using a polishing machine.Emery sheets of various grades (coarse to fine grades A46,A54,A70,A80,A90,and A100) were utilised to finish the alloy specimens further.The final alloy specimens equipped for microstructural analysis were done in alumina using a disc polisher that smoothened the specimen surface set for microstructure analysis.X-ray diffraction(XRD)was conducted using a Philips PW 1710 diffractometer with a graphite-diffracted beam monochromator and a copper anode tube.Side bands were observed using step scan mode.The XRD analysis was conducted at 40 kV voltage with a current of 40 mA.The scan rate was set as 1°·min-1.The phase identification was carried out using XRD with Cu Kβ radiation.The TEM analysis was performed on the cast Cu-6Sn regular bronze and Cu-9Ni-6Sn spinodal alloy.Specimen discs of the spinodal bronze alloy diameter 3 mm were prepared for transmission electron microscopy through standard jet polishing in a solution containing 30% nitric acid and 70% methanol at approximately -30°C.A beam of electrons was then passed through the disc specimen casing,an interaction between electrons and discs.Images formed from these interactions were magnified by an objective lens that appeared on the fluorescent screen.A Philips 400 T analytical microscope operating at 125 V was employed for the TEM analysis,including microstructural imaging and selected area diffraction patterns (SADPs).
2.5.Conduct of hardness test
A Vickers microhardness tester (Mitutoyo Model: HM-210A)was employed to determine the microhardness of the cast alloy specimens.The hardness tester provided a diamond indenter to create micro-level indentations on the alloy specimens.The indentation depth was analysed using a combination of LED illumination and an objective lens.The hardness tester was loaded with 50 gf for a dwell time of approximately 15 s.The alloy specimen surfaces were polished by emery sheets of 2000-5000 grit size.As and when the diamond indenter touches the specimen surface,measurement was taken of the indentation using a microscope.Four test trials were conducted across five locations to measure the hardness.The average of these readings was taken as the hardness value of the specimens in terms of HV.
2.6.Conduct of tribological test
A pin-on-disc apparatus (DUCOM,TR-20NEO) was used for the tribological test,as shown in Fig.4.The test was conducted as per the ASTM G-99 standard,and the alloy specimens were machined toφ12 mm×35 mm length each.An electronic weighing machine of up to 0.1 mg was used to weigh the specimens.The steel disc of the apparatus (EN31 hardened steel) was maintained at constant RPM using a controller.The alloy specimen was kept against the disc jammed between the jaws,and the inclination effect was negotiated through uniform screwing.The weights were gradually added to the machine to ensure constant loading to the arm.During the test,lubricants were not used to maintain a dry condition.Consistent contact between the alloy specimens and the disc was ensured through the applied load when wear occurred.The procedure was tested with various wear testing parameters,as shown in Table 3.The wear test for all the conditions was performed thrice,and the average value was calculated.
The worn-out surface was characterised using field emission scanning electron microscopy(FESEM)and energy-dispersive X-ray spectroscopy(EDS).FESEM and EDS analysis were also employed to determine the elemental composition of the tribo layer.
3.Results and discussions
3.1.Metallurgical analysis of Cu-6Sn and Cu-9Ni-6Sn spinodal bronze
The microstructure of alloys primarily depends on three factors.These include temperature,time of ageing,and deformation before or during heat treatment [22].Optical microscopy (OM) was employed to study the microstructure of regular bronze Cu-6Sn and spinodal bronze Cu-9Ni-6Sn.The as-cast structures shown in Fig.5(a) and (b) indicate the presence of dendrites in traditional bronze and spinodal bronze,respectively.Besides Cu-6Sn,previous research on Cu-10Sn cast alloys also had a dendritic structure in the as-cast form [20,22].Further,an investigation conducted by Pal et al.[23]indicates the presence of sharp grain boundaries and subgrains with wider grain boundaries on the optical microstructure of cast Cu-15Ni-2.7 Sn alloy and Cu-15Ni-9Sn alloy,respectively.
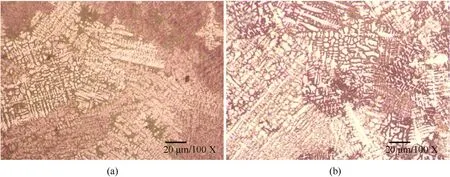
Fig.5.Optical image of dendritic microstructure in as-cast condition for (a) Regular Cu-6Sn alloy;(b) Cu-9Ni-6Sn alloy.
Upon solutionising,these dendritic structures disappeared from Cu-6Sn and Cu-9Ni-6Sn,as shown in Fig.6(a)and 6(b),to form a single-phase solid solution.It was reported that Cu-10Sn alloy,upon homogenisation and solutionising,possessed a microstructure without dendrites [23].Further,Chieu et al.[22],based on investigating a homogenised and solutionized Cu-9Ni-6Sn alloy,confirmed that the optical microstructure is a single-phase solid solution.
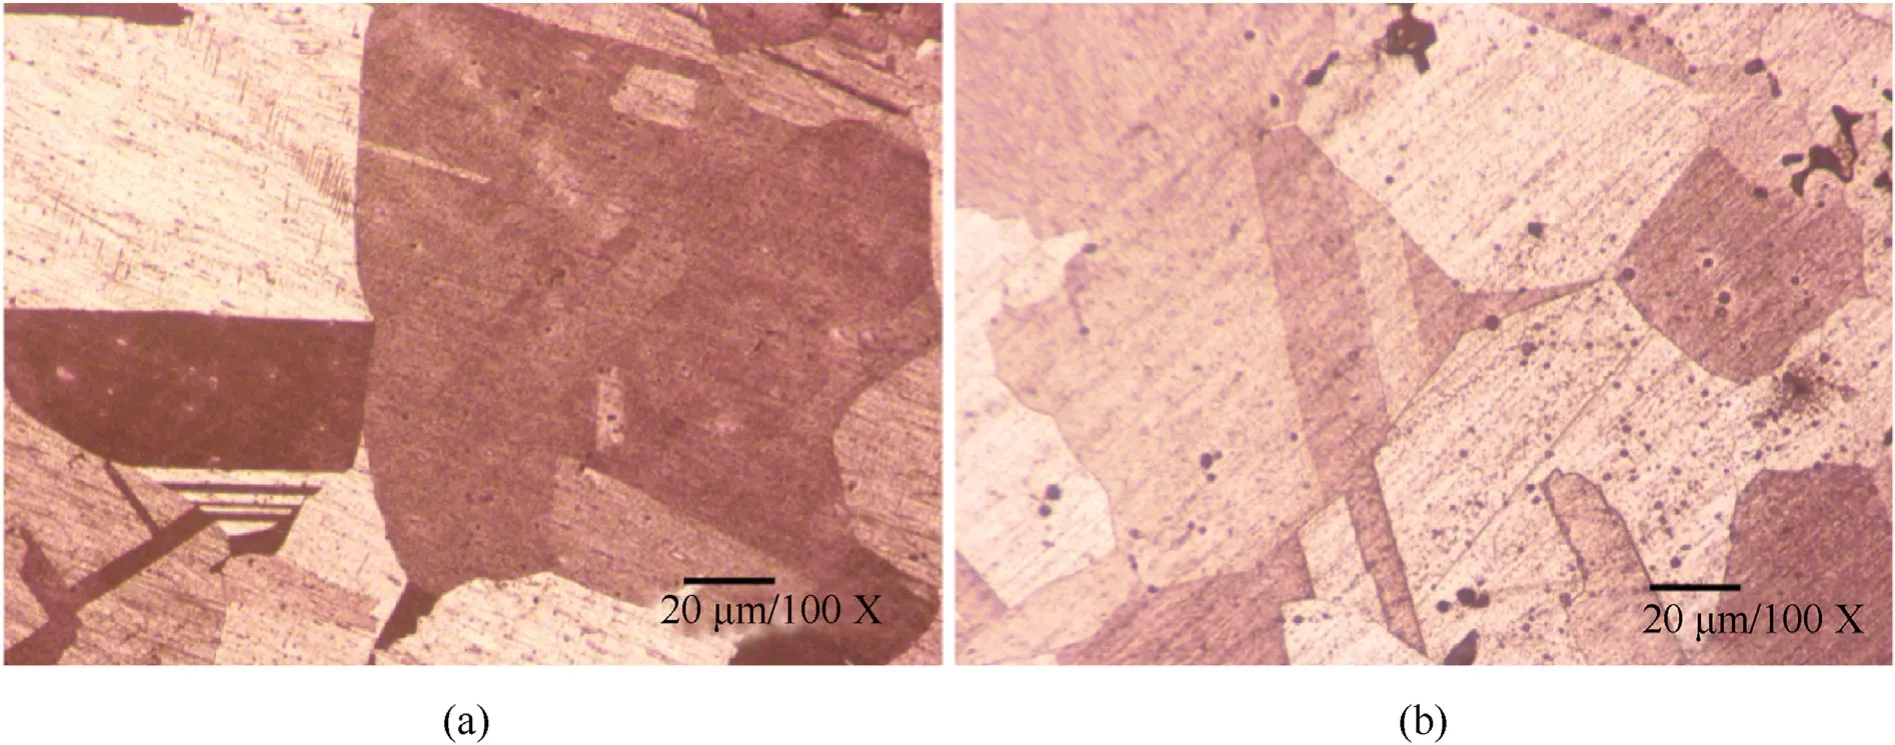
Fig.6.Optical image of solutionised microstructure of (a) Regular Cu-6Sn alloy;(b) Cu-9Ni-6Sn alloy.
An as-quenched microstructure is significant for an alloy because it influences properties like fatigue resistance and toughness in the as-tempered stage.In the case of copper alloys,when the quenching medium used is water,Cu alloys become softer.Water-quenched copper alloys may possess a fine-grain structure.Park et al.[24] observed that bronze alloys with 15 wt%to 24 wt% tin content is water quenched at 700°C;the optical microstructure possesses β and β martensite phases having a needle-like structure.The subsequent reduction in tin content to 15 wt% further diminished the presence of the martensite phase.Based on the combined inference from this pattern and optical microstructure in Fig.7(a),it may be concluded that as-quenched(water) Cu-6Sn alloys will possess a negligible martensite phase.Fig.7(b) also indicates uniformity in microstructure for waterquenched Cu-9Ni-6Sn alloy.
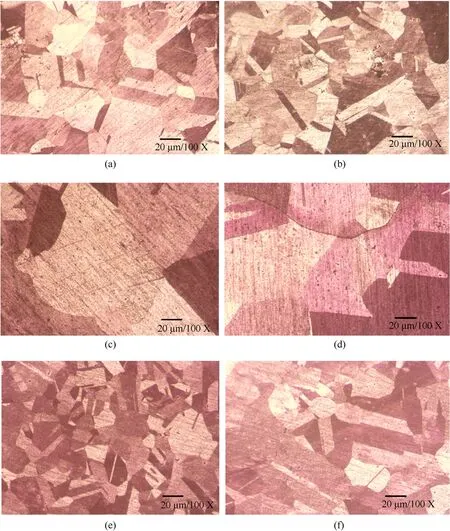
Fig.7.Optical microstructure of (a) Cu-6Sn quenched in water;(b) Cu-9Ni-6Sn quenched in water;(c) Cu-6Sn quenched in oil;(d) Cu-9Ni-6Sn quenched in oil;(e) Cu-6Sn quenched in brine;(f) Cu-9Ni-6Sn quenched in brine.
Oil quenching does not cause many distortions to the specimen as water quenching.But the rate of cooling is relatively slower.Oilquenched samples may exhibit peak hardness during the initial stages of aging[25].Fig.7(c)and 7(d)indicate a minimal uniformity in the microstructure with a more refined grain structure for SAE 40 oil-quenched Cu-6Sn and Cu-9Ni-6Sn alloys.Unlike water quenching,Brine quenching has minimal distortion effect on the specimen.Fig.7(e)and 7(f)represent a fine-grained microstructure for both brine-quenched Cu-6Sn and Cu-9Ni-6Sn alloys.
After homogenisation and quenching treatment,the Cu-6Sn and Cu-9Ni-6Sn samples were subjected to the ageing process.Ageing is a heat treatment process to enhance strength and hardness.Fig.8(a) indicates that dendrites may resurface on waterquenched bronze upon ageing.This resurfacing of dendrites may be attributed to the temperature gradient formed during solidification.It also shows that some precipitates are formed along the grain boundary.Coarse grains can be seen on oil-quenched and brinequenched bronze upon ageing,as shown in Fig.8(c) and 8(e).After the homogenisation and solutionising process,the microstructure of a Cu-Ni-Sn spinodal alloy will possess an α phase with a supersaturated solid solution.Upon ageing,the cellular structure gradually develops in the microstructure of Cu-Ni-Sn spinodal alloys with equilibrium α and γ phases at the grain boundaries.Spinodal decomposition forms a modulated structure with metastable γ phase having DO22structure formed at the tin-rich region[10,11].The more the ageing time,the more the cellular network in the microstructure.However,such a cellular structure can hardly be seen in the optical microstructures of Cu-9Ni-6Sn aged alloy shown in Fig.8(b),8(d)and 8(f).This leads to doing a TEM analysis to interpret the microstructure better.
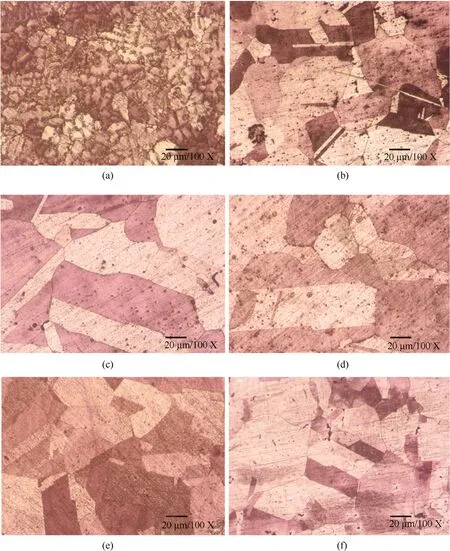
Fig.8.Optical microstructure of the aged sample of (a) water-quenched Cu-6Sn alloy;(b) water-quenched Cu-9Ni-6Sn alloy;(c) Oil quenched Cu-6Sn alloy;(d) Oil quenched Cu-9Ni-6Sn alloy;(e) Brine Cu-6Sn quenched alloy;(f) Brine Cu-9Ni-6Sn quenched alloy.
3.2.Grain size measurement
Table 4 and Fig.9 show the grain size value of cast Cu-6Sn and Cu-9Ni-6Sn spinodal alloy.It was observed that the brine quenched and brine aged spinodal bronze had the smallest grain size in the range of 75 μm and 60 μm,respectively.The cooling rate is a crucial factor that influences the grain size of the alloy.The faster the cooling rate,the smaller the grain size and the number of precipitated phases in the matrix.Among the three quenching media chosen,brine had the fastest cooling rate,which was the principal reason for the smaller grain size.The higher cooling rate of the brine solution may be attributed to the high concentration of NaCl (salt) which possess a wide operating temperature range.
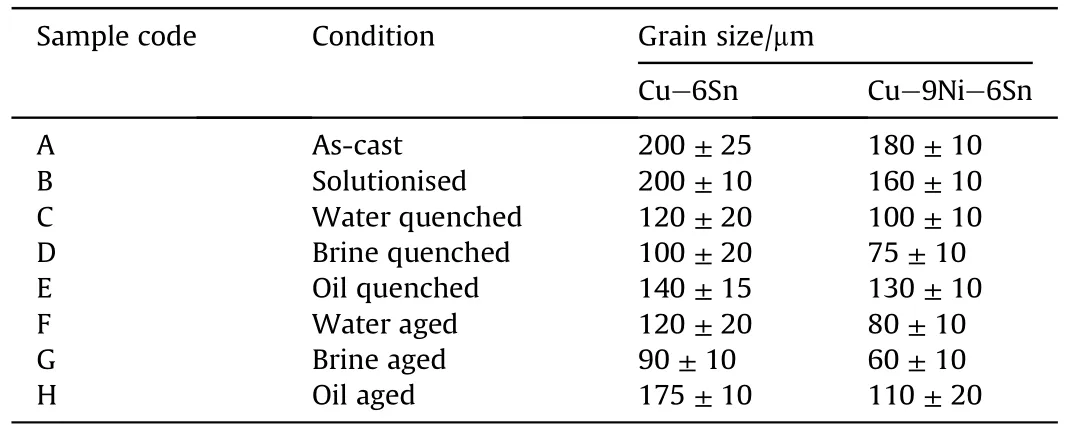
Table 4 Grain size values of developed alloys.
Fig.9.Comparison of grain size for different samples.
3.3.TEM analysis of Cu-9Ni-6Sn spinodal alloy in quenched and aged condition
3.3.1.Brine quenched Cu-9Ni-6Sn alloy
Transmission electron microscopy(TEM)was conducted on the Cu-9Ni-6Sn alloy brine quenched specimen.TEM images in Fig.10 indicate bright,dark,and even grey regions.The bright regions possessed the solute-depleted β phase,whereas the grey-colored regions contained the super saturated β phase,with a facecentred cubic (FCC) crystal structure.The TEM images in Fig.10 did not indicate discontinuous precipitation (DP),as DP colonies could hardly be seen.Fig.10(a) and 10(b) show the presence of Shockley partial dislocations capable of gliding divided by faulted regions which indicate that the stacking fault energy of Cu-9Ni-6Sn alloy may be lower than pure copper.This dip in stacking fault energy may be attributed to adding tin.The scratch line marks shown in Fig.10(c) point toward the twinning dislocations predominant in copper alloys.Twinning is an orientation-dependent deformation that could be in the size of nanometers,observable primarily through TEM only.It can also be inferred that complete decomposition of the solid solution may have taken place in the as-quenched stage since no structural features can be seen in the TEM micrographs shown in Fig.10.The Selected area electron diffraction(SAED)pattern of brine quenched spinodal bronze alloy is shown in Fig.11(a) and 11(b).Fig.11(a)depicts the pattern of Cu,and Fig.11(b)shows the pattern for β-Cu,which infers a relatively high concentration of tin.It was observed that the β-Cu phase decreased significantly upon ageing.

Fig.10.TEM micrograph of brine quenched Cu-9Ni-6Sn spinodal alloy.
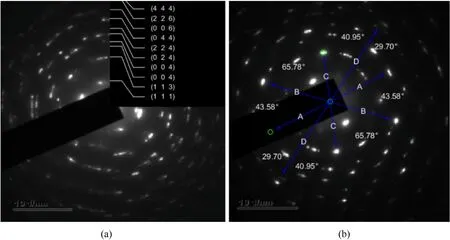
Fig.11.SAED pattern for (a) Cu;(b) β -Cu;in brine quenched Cu-9Ni-6Sn spinodal alloy.
3.3.2.TEM analysis of brine-aged Cu-9Ni-6Sn alloy
Fig.12(a)-12(d) shows the TEM image of brine-aged Cu-9Ni-6Sn spinodal alloy.The image clearly indicates that the significant characteristic of the brine-aged Cu-9Ni-6Sn alloy is the modulated microstructure.It can be further inferred that there is a homogeneous distribution in the matrix,which indicates that nucleation will happen neither at the grain boundaries nor at the dislocations The combined factors of modulated microstructure,homogeneity and absence of nucleation barrier confirm the occurrence of spinodal decomposition.The bright regions shown in Fig.12(a) and 12(b) correspond to the modulated tin-rich region,whereas the dark regions shown in Fig.12(c)correspond to the tinlean regions.The metastable discontinuous γ phase cannot be seen in any TEM micrographs.Further,the bright spots in Fig.12(a)and 12(b) corresponds to the DO22structure and the grey spots corresponds to overlapped L12structure.The presence of both DO22and L12structures points to spinodal decomposition.Besides,the dark regions in Fig.12(c) indicate the presence of an intermetallic compound,Ni3Sn.The SAED patterns in Fig.13(a)and 13(b)confirm the perfect copper and Ni3Sn intermetallic phase for the aged spinodal bronze alloy.Spinodal decomposition is further authenticated by spinodal satellites on the TEM film by short time exposure(for almost 15 s),as indicated in Fig.13(b).The bright dots in Fig.13(b) represent the reflections of the DO22ordered structure.The TEM analysis conducted in the present investigation was in accordance with the studies of Zhao and Notis (1998).

Fig.12.TEM images of aged Cu-9Ni-6Sn alloy quenched in brine.

Fig.13.SAED pattern for (a) Cu;(b) Ni3Sn in aged Cu-9Ni-6Sn spinodal alloy quenched in brine.
The SAED pattern in Fig.13(b)confirms the intermetallic phase Ni3Sn.Ni3Sn phase develops as a plane layer with fragile column grain,with its grain size only half the grain size of Ni3Sn2.The interfacial properties between Ni3Sn and Ni are significant in optimising the crack to avoid crack formation.An ionic bond in the Ni3Sn phase possesses a cubic structure.Studies have shown that Ni/Ni3Sn interface has very high bonding strength with strong resistance to crack formation [26].
3.3.3.XRD analysis
XRD pattern observed in regular bronze(Cu-6Sn)and spinodal bronze(Cu-9Ni-6Sn) is illustrated in Fig.14(a) and 14(b),respectively.Spinodal bronze is distinct from regular bronze because of the Ni3Sn intermediate phase,which might be in the form of elongated precipitates.The formation of the Ni3Sn phase may be attributed to the higher composition of Nickel in the alloy compared to Sn.When the concentration of Ni is high,the thickness of the Ni3Sn layer can also increase [27].There is a positive correlation between the growth of the Ni3Sn phase and the diffusion of Ni.Further,the addition of Nickel can increase the crystallisation temperature of Cu-Ni-Sn alloys,which act as a catalyst for forming the intermediate Ni3Sn phase.Besides,Nickel has a more substantial influence on the tin when compared with copper,fueling the diffusion of intermetallic phases like Ni3Sn in Cu-Ni-Sn alloys.Therefore,the principal reason behind the formation of the Ni3Sn phase is the diffusion process of Ni in spinodal bronze.
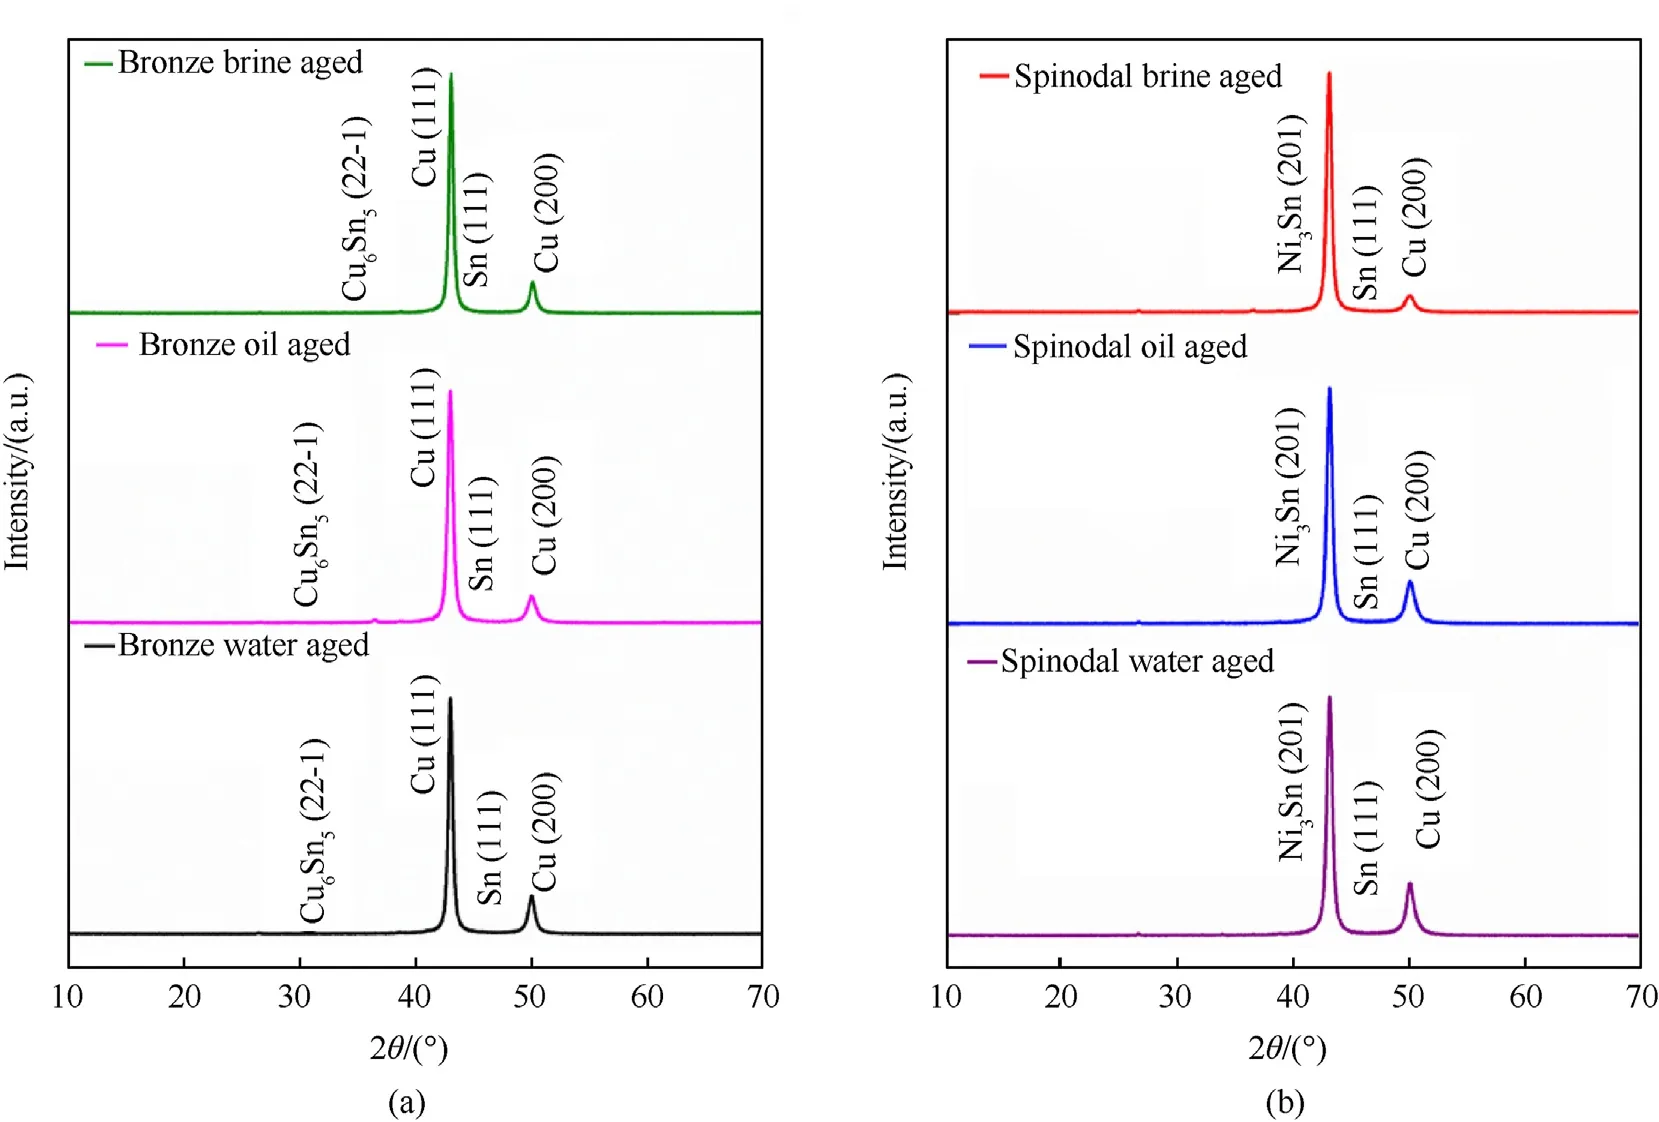
Fig.14.XRD analysis of (a) regular bronze (b) spinodal bronze.
3.4.Hardness test
The hardness value of regular bronze (Cu-6Sn) and spinodal bronze (Cu-9Ni-6Sn) will be on the higher side due to solid solution(SS)strengthening and spinodal decomposition,respectively.Spinodal decomposition impacts properties such as the hardness and yield strength of the copper alloys due to the formation of DO22and L12-ordered structures.The modulated microstructure formed from spinodal decomposition is one of the principal reasons behind the high hardness of spinodal bronze.The hardness values of regular bronze and spinodal bronze are shown in Fig.15 and Table 5,and it was observed that brine-quenched and brine-aged Cu-9Ni-6Sn specimens had the highest hardness.This is mainly attributed to the fact that grain size is the smallest for brinequenched specimens due to its rapid cooling rate.Since the grain size is smaller,the grain boundaries formed are more,which increases hardness.Further,the intermetallic compound Ni3Sn formed could also be a reason for improved hardness.Since the grain size of the Ni3Sn phase is finer,and there is a dominant grain boundary diffusion,the hardness of the brine quenched and aged Cu-9Ni-6Sn increases.
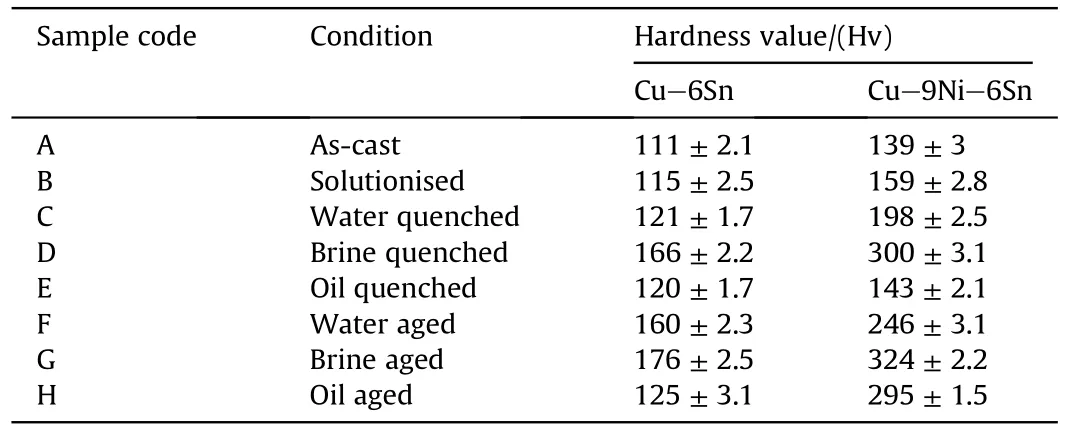
Table 5 Hardness values of developed alloys.
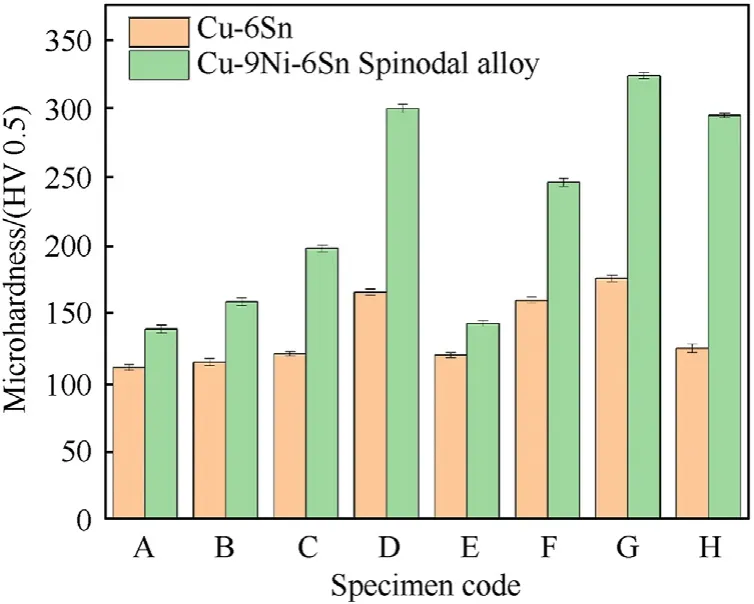
Fig.15.Hardness values of various specimens.
3.5.Tribological analysis
The tribological study is significant in the context of energy management,reliability,and life of a component,making it a pivotal analysis in military applications.It focuses on three significant aspects: wear,friction,and lubrication.Static and kinetic friction leads to the deterioration of material surfaces,known as wear,which could be adhesive or abrasive wear.Sliding velocity and load influence friction between components,thereby,the wear of material.When sliding velocity increases,there will be a subsequent increase in the temperature of the interacting surfaces,irrespective of the ambient temperature.In most cases,there is a proportional relationship between applied load and wear rate.The contact conditions experienced and intense applications of military components signify the importance of studying the effect of load and sliding velocity through tribology tests.
3.5.1.Effect of load on wear rate and coefficient of friction
Scanning electron microscopy (SEM) and Energy dispersive XRay analysis (EDX) on the wear track surface and wear debris provide an insight into the wear mechanism involved in Cu-6Sn and Cu-9Ni-6Sn alloys.Zhang et al.[10]have confirmed an inverse relationship between the wear rate and hardness of the alloys by Archard's adhesion theory of wear.In defence applications,very high localised pressure and localised temperature are common and frequent,leading to microscopic projections which result in adhesive wear.The wear rate of both alloys was determined from mass loss using Eq.(2),where WR=wear rate in mg/Nm,
Load in Newton,and sliding distance in meter
Military equipment and components need to withstand wear and corrosion.Wear rate happens because of the heat dissipation in components,causing delamination.Table 6 depicts the wear rate and coefficient of friction values of regular bronze alloy (Cu-6Sn)and spinodal alloy (Cu-9Ni-6Sn) with standard deviation for varying loads at different quenching mediums.Fig.16(a) indicates that the wear rate increases with an increase in load for bronze alloy(Cu-6Sn)irrespective of water,SAE 40 oil,and brine solution as quenching media.Fig.16(b) indicates an initial dip in wear rate with an increase in load for spinodal bronze (Cu-9Ni-6Sn alloy)irrespective of water,SAE 40 oil,and brine solution as quenching media.When the load was increased beyond 20 N,the wear rate increased substantially.Adhesive wear was the principal wear mechanism associated with Cu-9Ni-6Sn alloy.The initial dip in wear rate for spinodal bronze could be attributed to the formation of the tribe-oxide layer or mechanically mixed layer (MML).The EDS analysis of the MML/oxide layer is shown in Fig.17.
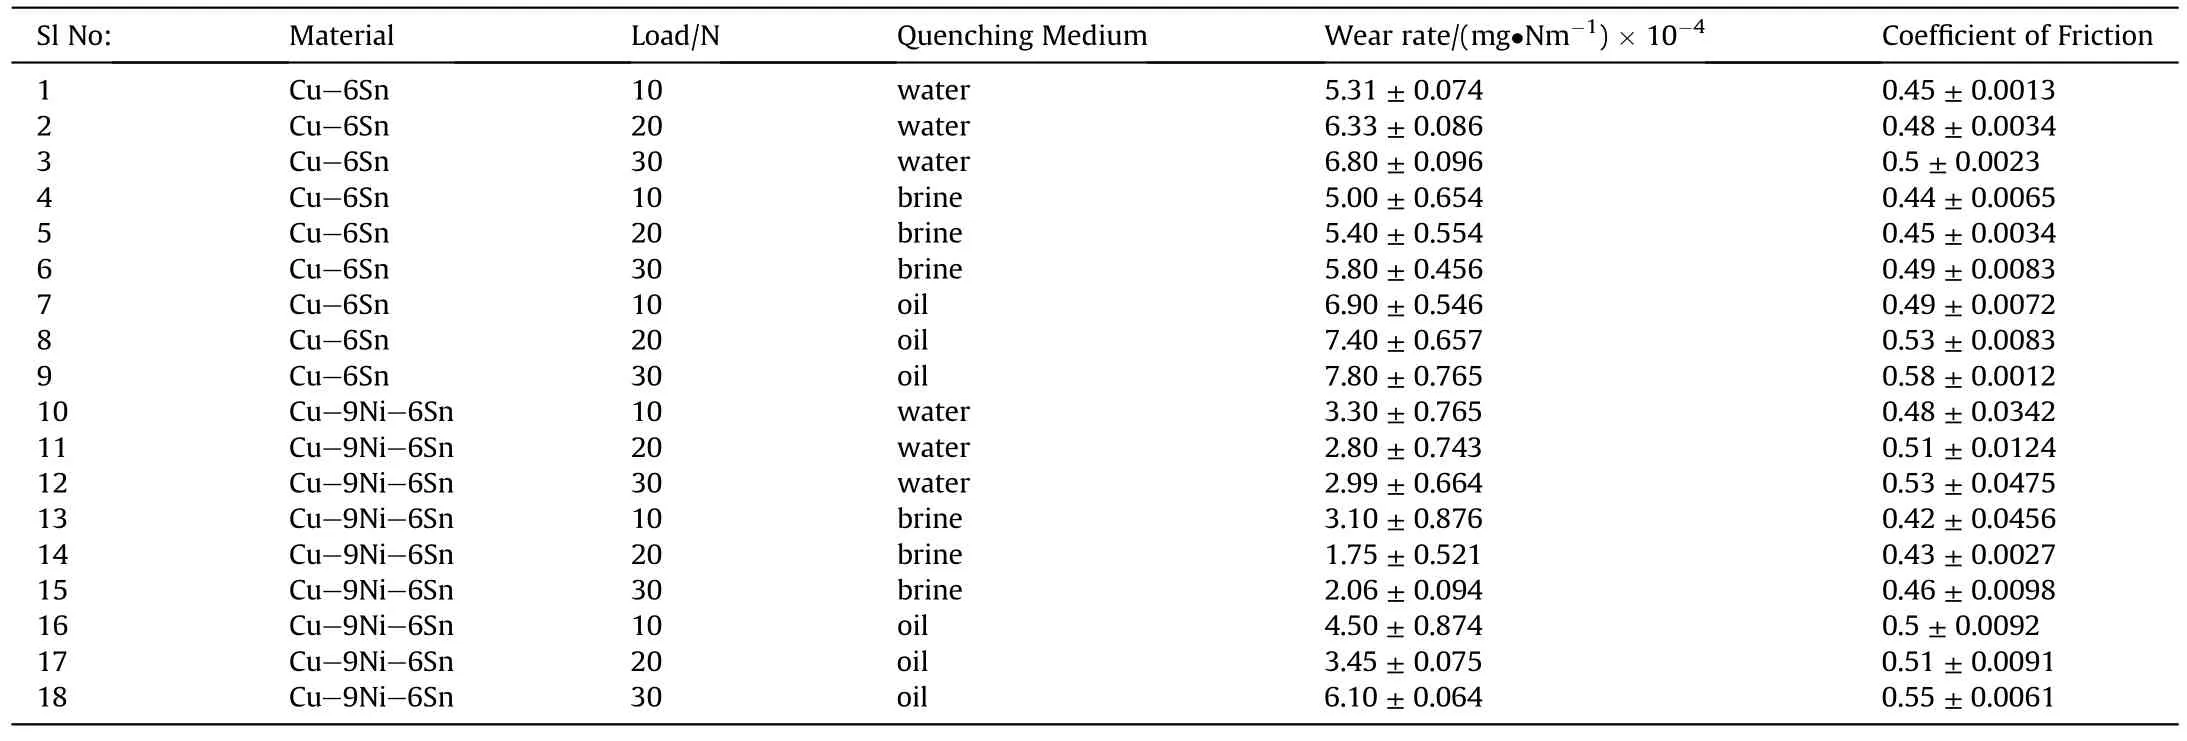
Table 6 Variation of wear rate and COF with varying load for quenching medium.
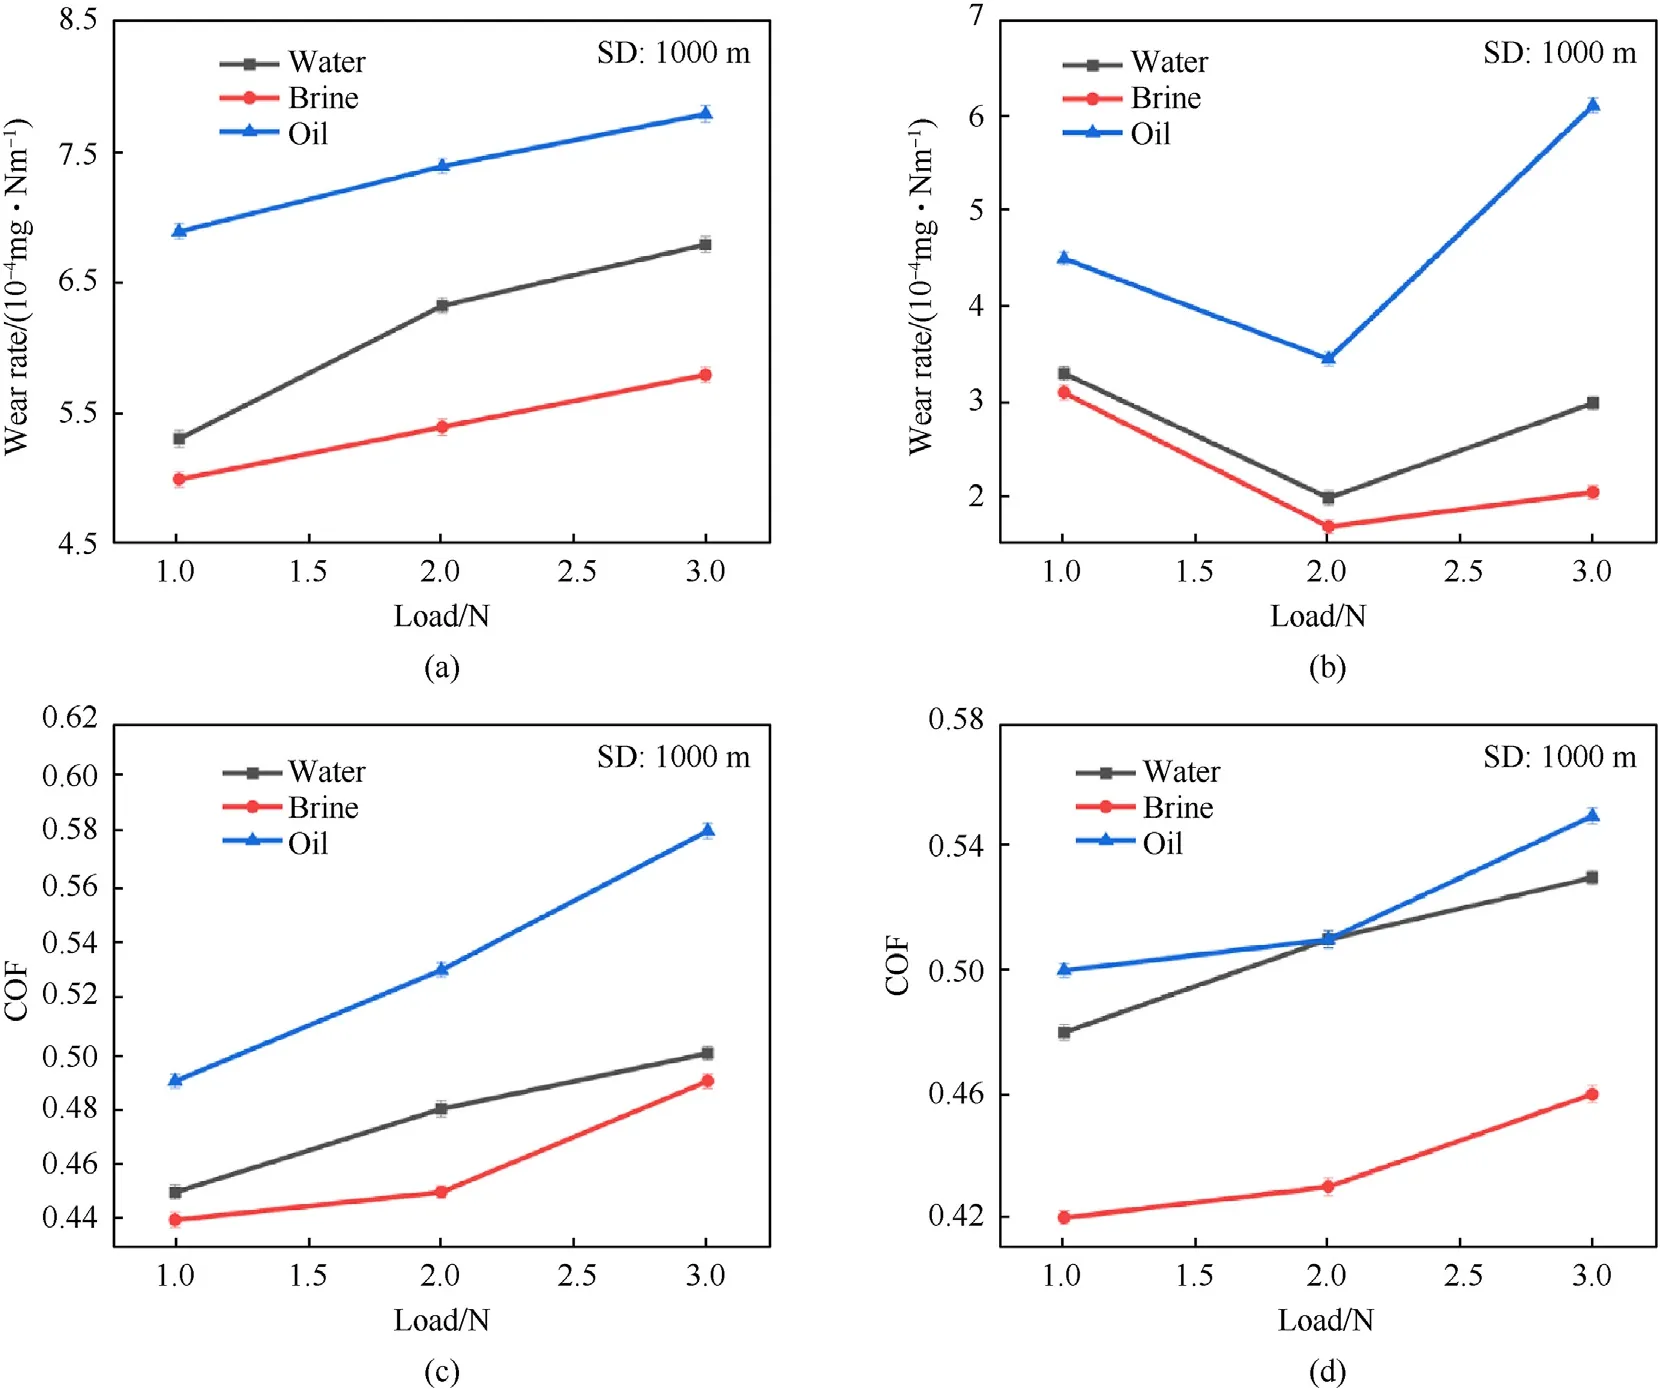
Fig.16.Effect of load on wear rate and coefficient of friction.
Fig.17.EDS analysis of MML layer obtained at 20 N.
This oxide layer,a mechanical mix,forms due to the hightemperature friction on the interacting surfaces of the components.High-strength tribe-oxide layers generated can offer better wear resistance during initial loading.But as the load increases,the tribe-oxide layer breaks,and direct contact occurs between the pin and disc,causing the wear rate to increase in spinodal bronze alloy Cu-9Ni-6Sn.On the contrary,for Cu-6Sn bronze,the continuous increase in wear rate with the load,as shown in Fig.17(a),may be due to a weak tribe-oxide layer that is incapable of withstanding the increasing load.Fig.17(b) indicates that the wear rate is the least when employing brine solution among the three quenching media.
Fig.16(c) and 16(d) indicate an increase in friction coefficient with an increase in load for both Cu-6Sn and Cu-9Ni-6Sn alloys irrespective of water,SAE 40 oil,or brine solution employed as the quenching media.For minimal loads in the scale of micro to nano newton range,the friction coefficient was observed to be very low[28]The increase in friction coefficient with the rise in load for both Cu-6Sn and Cu-9Ni-6Sn alloys could be attributed to the adhesion strength.When the applied load was less,there was no proper metallic contact as the tribo oxide layer formed (weak in Cu-6Sn and strong in Cu-9Ni-6Sn)was adequate to separate the surfaces.But as the load increased,the trio-oxide layer broke,causing intermetallic contact and increasing the friction coefficient.However,Fig.16(c)and 16(d)point out that the friction coefficient was lowest for Cu-6Sn and Cu-9Ni-6Sn when the brine solution was employed as the quenching media.For brine-quenched spinodal bronze,the highest friction coefficient value was 0.44-0.45,as shown in Fig.16(d),whereas,for brine-quenched bronze,shown in Fig.16(c),the highest friction coefficient value was found to be 0.48.
3.5.2.Effect of sliding velocity on wear rate and coefficient of friction
Table 7 shows the wear rate and coefficient of friction values of regular bronze and spinodal alloy for varying sliding velocity at different quenching mediums.Fig.18(a)and 18(b)indicate that the wear rate decreased for both Cu-6Sn and Cu-9Ni-6Sn alloy with increased sliding velocity irrespective of water,SAE 40 oil,or brine solution as the quenching medium.The wear rate was the least when the brine solution was employed as the quenching medium.When the sliding velocity was kept increasing up to 3 m/s,it was observed that a tribo layer/MML was formed on the surface of both Cu-6Sn and Cu-9Ni-6Sn alloy,thereby reducing the material removal rate.The EDS analysis and elemental mapping of the mechanically mixed layer observed in the Cu-9Ni-6Sn spinodal alloy are depicted in Fig.19.
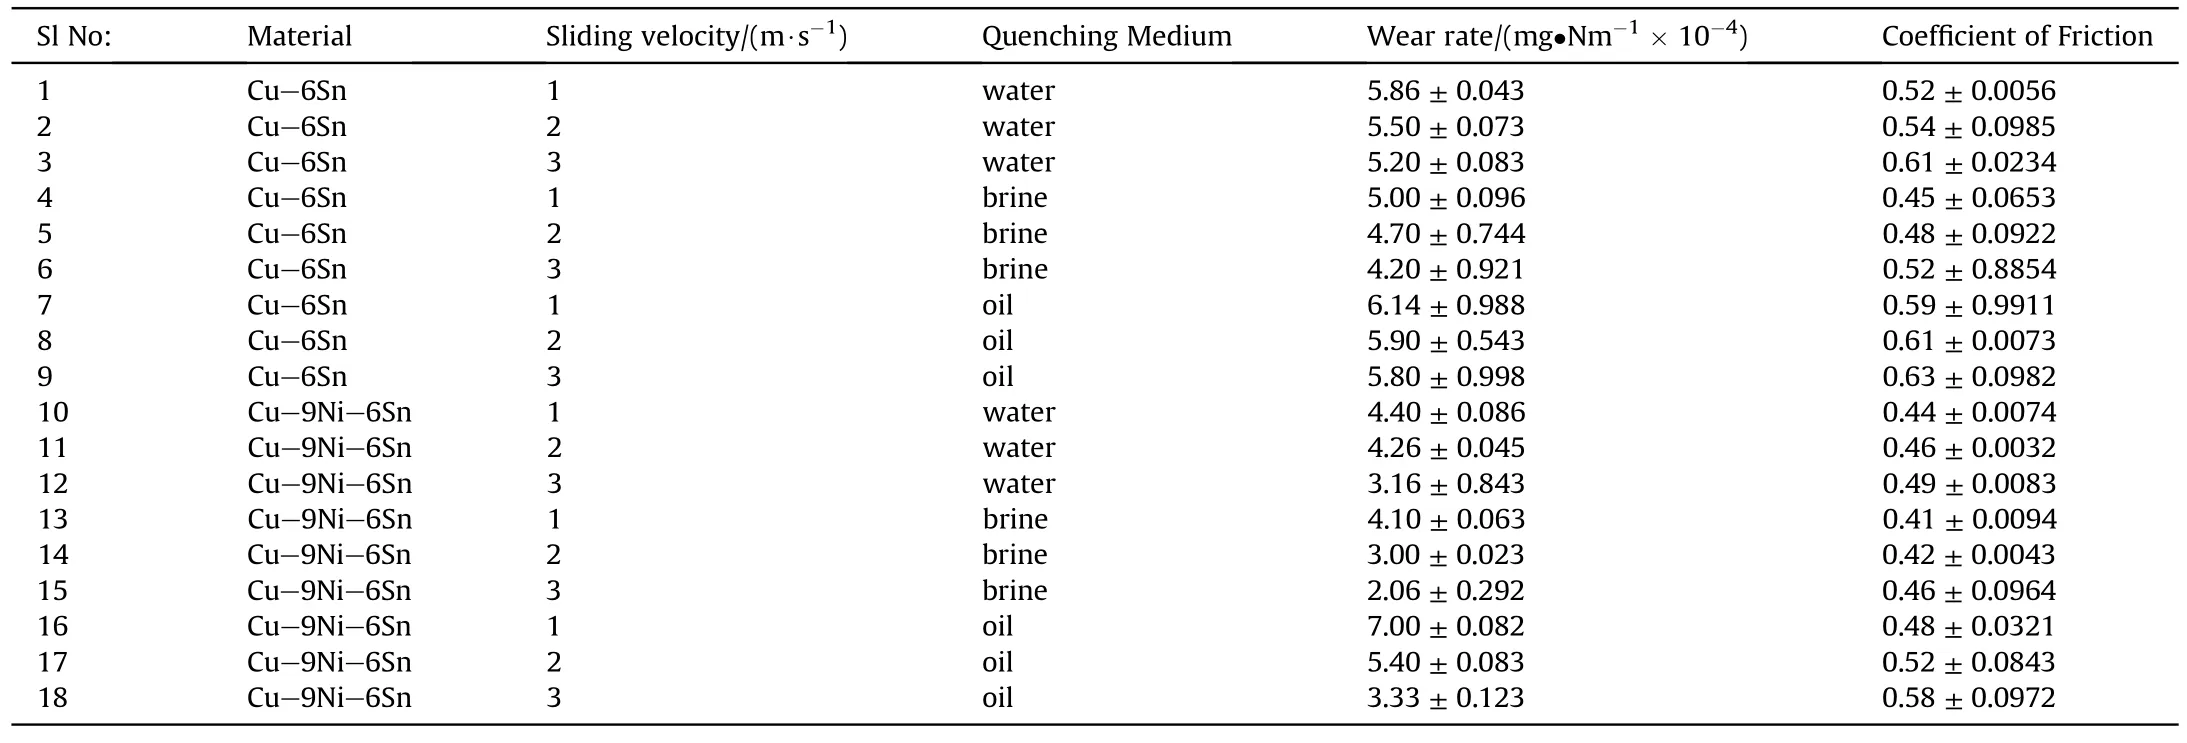
Table 7 Variation of wear rate and COF with varying sliding velocity for different quenching medium.
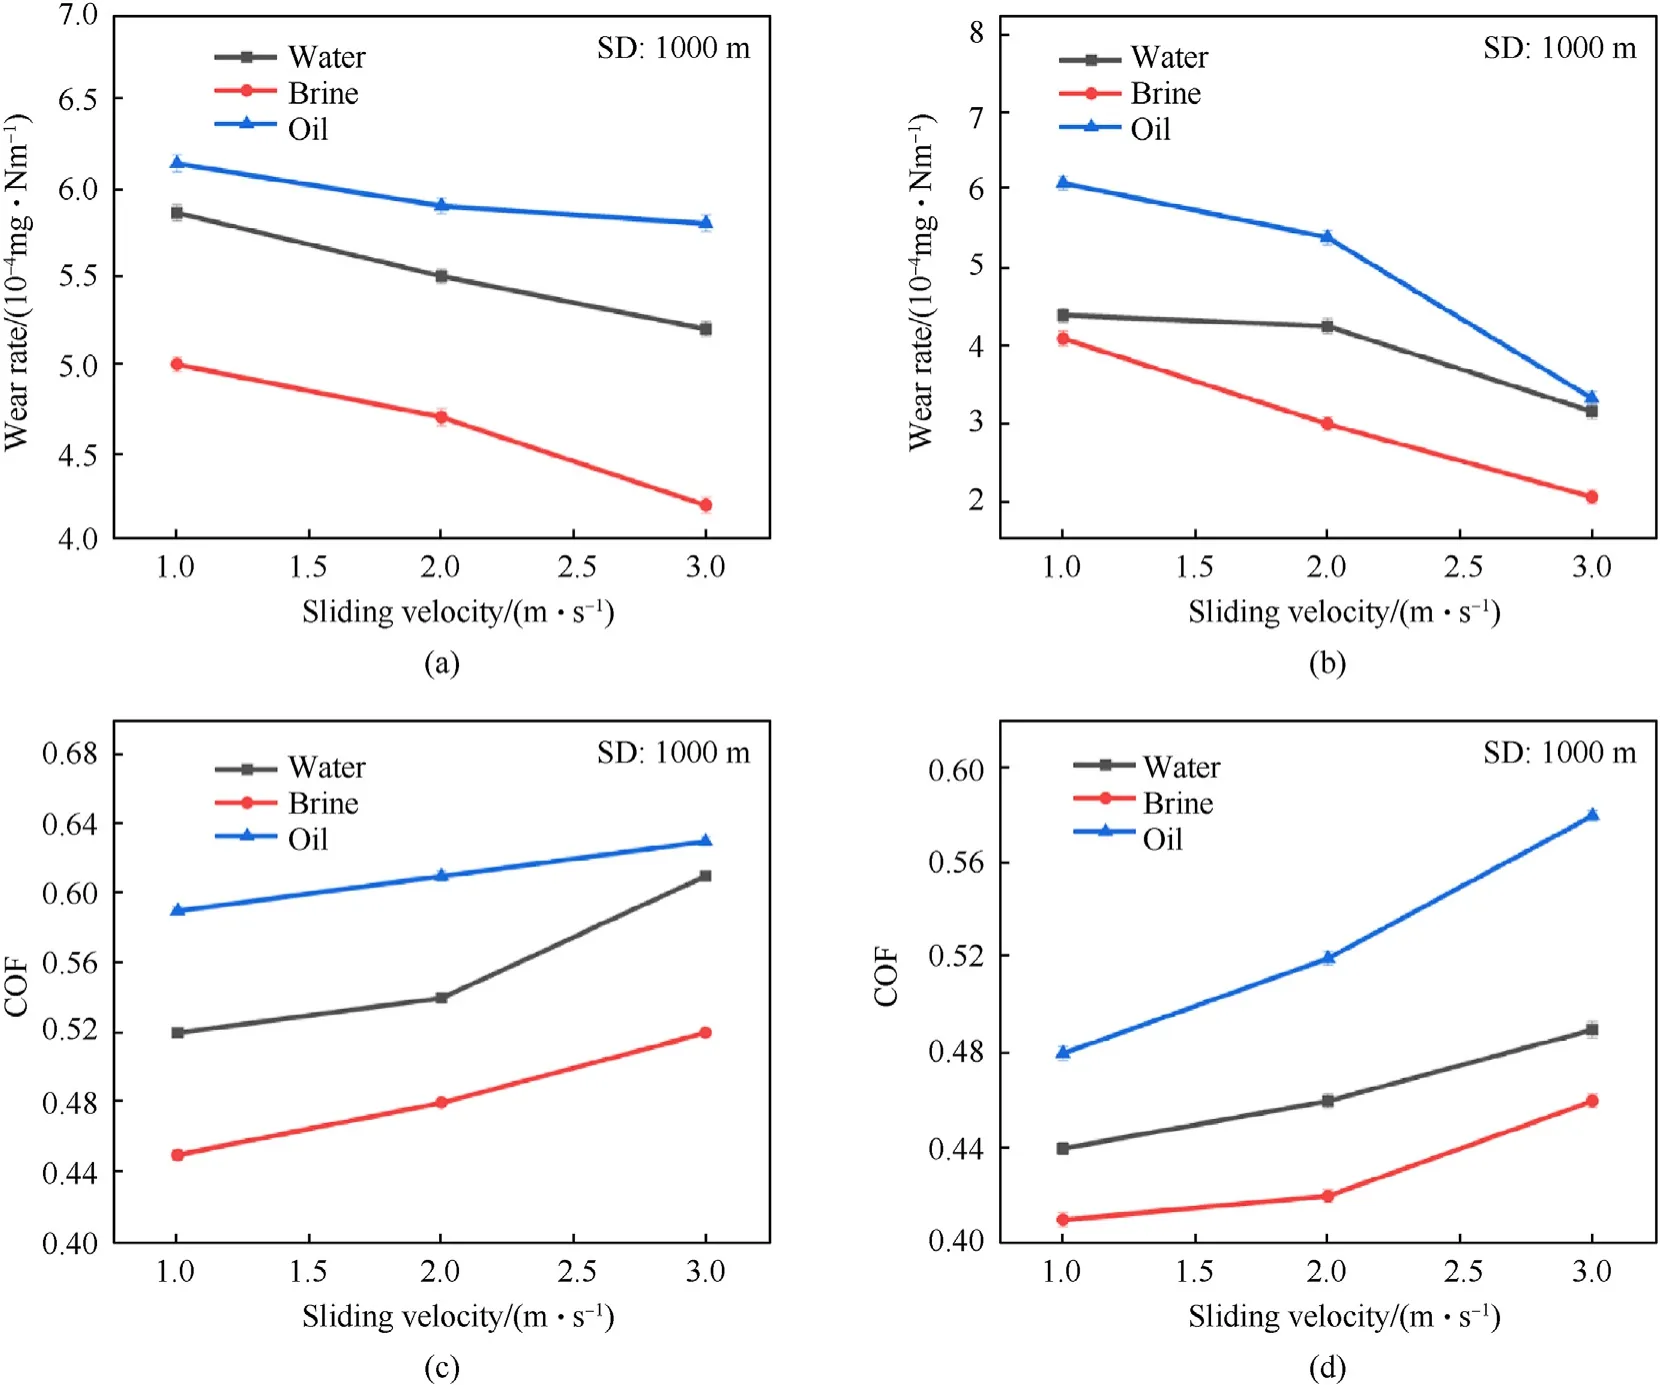
Fig.18.Effect of sliding velocity on wear rate and coefficient of friction.
For a brine quenched Cu-9Ni-6Sn alloy shown in Fig.18(b),the wear rate became as low as (2 × 10⁻⁴) mg/Nm when the sliding velocity was 3 m/s in comparison to brine quenched Cu-6Sn where the wear rate was approximately (4.25 × 10⁻⁴) mg/Nm shown in Fig.18(a).This low wear rate with minimal rough surfaces enhances the fact that Cu-9Ni-6Sn alloy undergoes adhesion wear.
Fig.18(c)and 18(d)indicated a steady increase in the coefficient of friction with an increase in sliding velocity in both Cu-6Sn and Cu-9Ni-6Sn alloys,irrespective of the quenching media.This increase in friction coefficient may be attributed to the adhesive interaction between the pin and disc.However,Fig.18(d)points to the fact that the coefficient of friction is lowest for a brinequenched spinodal bronze when sliding velocity is high.Besides that,Fig.18(c) and 18(d) show that when the sliding velocity was 3 m/s,the brine quenched Cu-6Sn had a friction coefficient as high as 0.52,whereas for the brine quenched Cu-9Ni-6Sn alloy at the same sliding velocity of 3 m/s,the friction coefficient was found to be lower at approximately 0.46~0.48.
3.5.3.Worn-out surface analysis
Fig.20 depicts the FESEM images of bronze quenched and aged in brine solution under varying loads of 10 N (Fig.20(a))and 30 N(Fig.20(b)),respectively.On further analysis of both images,deep cracks and wear debris indicate the significant impact of load on the sliding surfaces.In Fig.20(a),deep cracks,ridges,and surface peeloff can be observed.This can be attributed to the abrasive wear mechanism between the alloy and its sliding counterpart.Further,mild scratches can also be observed from the image,which also gives an inference on the increased friction between the surfaces due to load.In Fig.20(b),wear debris increased considerably,and the grooves intensified more than in Fig.20(a).Hence it indicates that at a 30 N load,severe abrasion might have occurred while sliding.As the debris increased over repeated sliding,it might have trapped between the disc and alloy surface resulting in three body wear.This further created ploughing and shallow grooves.

Fig.20.FSEM image showing the effect of load on wear rate (Bronze -Brine condition,load -(a) 10 N;(b) 30 N,constant Sliding velocity -3 m/s,sliding distance -1000 m).
So,in the case of bronze,wear was less at load 10 N,and as the load increased,the wear rate also increased substantially.
Fig.21(a)-21(c) shows the FESEM images of worn-out surfaces of spinodal bronze subjected to varying loads.The worn-out surfaces are categorized by varying loads of 10 N,20 N,and 30 N while sliding distance and sliding velocity are kept constant.
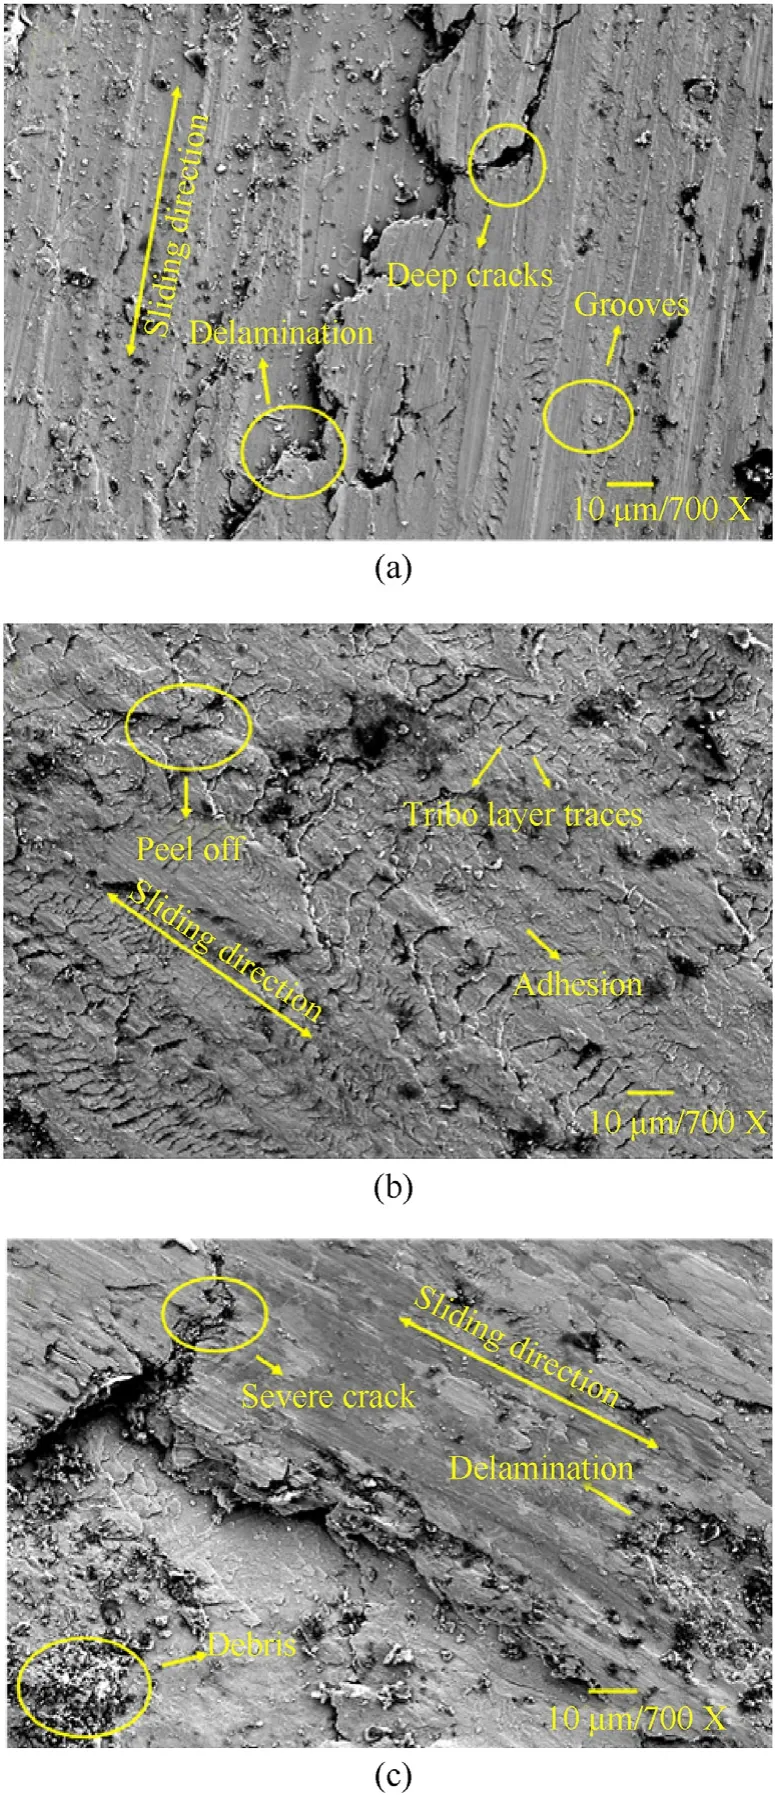
Fig.21.Effect of load on wear rate(spinodal bronze-Brine condition,load -(a)10 N;(b) 20 N;(c) 30 N constant Sliding velocity -3 m/s,sliding distance -1000 m).
A detailed analysis based on Fig.21(a)-21(c) shows that the surface has undergone abrasion and delamination.The propagation of subsurface cracks leading to plastic deformation on the surface is eminent in Fig.21(a).Besides this,the presence of grooves and wear debris points to abrasive wear.When the load was increased to 20 N,the worn-out surface,as seen in Fig.19(b),showed a different shift.As shown in Fig.19(b),the worn-out surface of spinodal bronze displayed comparatively lesser wear.The increased load has caused specific welding between the asperities and their sliding counterpart.This has resulted in plastic deformation of the surface,as shown in Fig.21(b).There are also darkcolored regions that show the presence of surface oxidation.The wear rate decrease can be attributed to the formation of a tribo layer through oxidation,indicated in Fig.21(b).This tribolayer reduces the surface contact between the disc and the sliding surface,thereby causing a significant reduction in the coefficient of friction.
Upon further analysis of Fig.21(c),severe cracks and delamination can be observed.The increased load has increased the friction between two surfaces resulting in the extinction of the tribolayer.This has further resulted in extensive wear on the surface of the specimen.More and more wear particles and delamination are pre-dominant in the worn-out surface,as seen in Fig.21(c).
Thus it can be summed up that,in the case of spinodal bronze alloy,the wear rate initially followed a dip due to the formation of a tribo oxide layer before it started increasing with increased load.Adhesion was the wear mechanism that was dominant in spinodal bronze.
4.Conclusions
The effect of quenching media(water,SAE40 oil,brine solution)on the morphological,mechanical,and tribological characteristics of regular cast bronze (Cu-6Sn) and spinodal bronze(Cu-9Ni-6Sn) was conducted in this study,and the following key observations were made.
(1) Brine-aged regular bronze and spinodal bronze possess a fine-grained microstructure compared to water-aged and oil-aged specimens.The grain size of brine-aged regular bronze and spinodal bronze was 30-40% finer when compared with water-aged and oil-aged specimens.
(2) Brine-aged spinodal bronze possesses the maximum hardness compared to water-aged and oil-aged spinodal bronze.The hardness (Hv) of brine-aged spinodal bronze was 20-30% higher when compared with the respective wateraged and oil-aged specimens.
(3) Wear rate is least when brine is employed as the quenching medium for spinodal bronze and regular bronze.Compared with oil as the quenching medium for spinodal bronze,the wear rate dipped almost 100% for the brine quenched spinodal bronze.Also,in comparison with water as the quenching medium,the wear rate decreased by 40-50% for brine-quenched spinodal bronze.
(4) Coefficient of friction is lowest for regular bronze and spinodal bronze when brine is used as the quenching medium.Brine-quenched regular bronze,and spinodal bronze possess a low friction coefficient of 0.40-0.4,6 whereas oil quenched and water-quenched regular bronze and spinodal bronze samples have a friction coefficient greater than 0.5.
These observations suggest that brine solution is the most effective quenching medium for characteristics enhancement of regular cast bronze and spinodal bronze.
Declaration of competing interest
The authors declare that they have no known competing financial interests or personal relationships that could have appeared to influence the work reported in this paper.
杂志排行

Defence Technology的其它文章
- Interaction of water droplets with pyrolyzing coal particles and tablets
- Multifunctional characteristics of 3D printed polymer nanocomposites under monotonic and cyclic compression
- The concept of sUAS/DL-based system for detecting and classifying abandoned small firearms
- Modelling and predicting the dynamic response of an axially graded viscoelastic core sandwich beam
- Development of bimetallic spinel catalysts for low-temperature decomposition of ammonium dinitramide monopropellants
- Thrust characteristics of nano-carbon/Al/oxygenated salt nanothermites for micro-energetic applications