Superplastic behavior of a fine-grained Mg-Gd-Y-Ag alloy processed by equal channel angular pressing
2023-12-27RezeiMhmudiLog
A.Rezei ,R.Mhmudi,∗ ,R.E.Logé
a School of Metallurgical and Materials Engineering, College of Engineering, University of Tehran, Tehran 14395-515, Iran
b Laboratory of Thermomechanical Metallurgy - PX Group Chair, Ecole Polytechnique Fédérale de Lausanne (EPFL), CH-2002 Neuchâtel, Switzerland
Abstract An extruded Mg-6Gd-3Y-1.5Ag (wt%) alloy was processed by 6 passes of equal channel angular pressing (ECAP) at 553 K using route Bc to refine the microstructure.Electron back-scattered diffraction (EBSD) analysis showed a fully recrystallized microstructure for the extruded alloy with a mean grain size of 8.6 μm.The microstructure of the ECAP-processed alloy was uniformly refined through dynamic recrystallization (DRX).This microstructure contained fine grains with an average size of 1.3 μm,a high fraction of high angle grain boundaries (HAGBs),and nano-sized Mg5Gd-type particles at the boundaries of the DRXed grains,detected by transmission electron microscopy (TEM).High-temperature shear punch testing (SPT) was used to evaluate the superplastic behavior of both the extruded and ECAP-processed alloys by measuring the strain rate sensitivity (SRS) index (m-value).While the highest m-value for the extruded alloy was measured to be 0.24 at 673 K,the ECAP-processed alloy exhibited much higher m-values of 0.41 and 0.52 at 598 and 623 K,respectively,delineating the occurrence of superplastic flow.Based on the calculated average activation energy of 118 kJ mol-1 and m-values close to 0.5,the deformation mechanism for superplastic flow at the temperatures of 598 and 623 K for the ECAP-processed alloys was recognized to be grain boundary sliding (GBS) assisted by grain boundary diffusion.
Keywords: Mg-Gd-Y alloys;Equal channel angular pressing;Superplasticity;Strain rate sensitivity;Grain boundary sliding.∗Corresponding author.
1.Introduction
The increasing demand for weight-saving purposes in automobile and aerospace industries has drawn attentions to magnesium alloys,as suitable candidates having low density and high specific strength [1].However,the lack of sufficient independent slip systems of their HCP structure has restricted their formability at room temperature [2].That is why superplastic forming could be proposed as an alternative approach to address such an adversity by imposing large strains without necking,to produce near-net components having complex shapes [3].However,superplastic forming of polycrystalline materials usually requires some specific prerequisites in terms of microstructural and metallurgical features.First,a fine-grained structure consisting of grains smaller than 10 μm in size with preferably high angle grain boundaries (HAGBs)is needed,as grain boundary sliding (GBS) is the dominant deformation mechanism during superplastic flow [4–6].Secondly,as the superplastic flow is a diffusion-controlled process,the forming operation should be carried out at relatively high temperatures greater than 0.5Tm,whereTmis the absolute melting temperature [7].Finally,the microstructure must be thermally stable in order to avoid grain growth at high temperatures during superplastic forming.Therefore,superplasticity usually takes place in two-or multi-phase alloys,or in the ones containing a fine dispersion of second phases[8,9].
It has been shown that among different severe plastic deformation (SPD) techniques,equal channel angular pressing(ECAP) is significantly effective in refining the microstructure and imparting superplastic capability in various Mg alloys.Figueiredo and Langdon [10] reported a maximum tensile elongation of 3050% at the temperature of 473 K and strain rate of 1.0×10⁻⁴s-1for an extruded ZK60 alloy after 2 ECAP passes at 473 K under route Bc.In another study,the maximum elongation of 840% was achieved at 473 K for an Mg-9% Al alloy,having a grain size of about 0.7 μm,after 2 ECAP passes at 473 K under route Bc,whereas the as-cast and extruded conditions did not exhibit superplastic behavior [11].Recently,the superplastic behavior of an Mg-6.5Y-1.2Er-1.6Zn-xAg (x=0 and 1 wt%) alloy after 16 ECAP passes at 693 K has been investigated [12].The Ag-containing alloy showed a maximum elongation of 495% and strain rate sensitivity (SRS) index of 0.46,indicating the occurrence of GBS and superplastic flow,whereas the base alloy did not exhibit superplastic characteristics.Vávra et al.[13] reported high strain rate superplasticity for a solution treated commercial WE43 magnesium alloy processed by 8 ECAP passes using route Bc through a decreasing processing temperature method from 603 to 558 K.The highest elongation of about 1230% at a strain rate 10-2s-1for the two testing temperatures of 623 and 673 K was attributed to improved GBS due to the significantly fine grain size of 340 nm achieved after ECAP process.They also showed that at the testing temperature of 673 K,the SRS indices were well above 0.5 in the high strain rate domain of 6 × 10⁻³to 2 × 10⁻¹s-1.
Among various classes of Mg alloys,the Mg-Gd-Y systems,known as GW series,are prominent for their high thermal stability and enhanced mechanical properties at both ambient and high temperature,caused by Gd and Y elements in the solid solution and also formation of heat-resistant second phases [14–16].Therefore,superplastic forming in Mg-Gd-Y alloys would be of great interest for producing wrought components with potential applications in high temperature services.However,scarce studies reported on the superplastic behavior of fine-grained Mg-Gd-Y alloys processed by SPD techniques.For instance,Yang et al.[17] reported superplastic behavior for an Mg-9.4Gd-4.1Y-1.2Zn-0.4Zr alloy with the grain size of about 3 μm processed by friction stir processing (FSP) in the high strain rate regime,having an exceptional maximum elongation of 3570% at the testing temperature of 698 K along with the SRS index of 0.6 at the temperatures of 673 K and 698 K.Alizadeh et al.[18] compared the superplasticity of an Mg-5Gd-4Y (GW54) alloy processed by 8 turns of high pressure torsion (HPT) at room temperature and 4 passes of ECAP at 623 K by measuring the SRS indices through shear punch test (SPT).They obtained the SRS index of 0.5 at the testing temperature of 623 K for the HPT-processed alloy,whereas the (SRS) index of 0.46 was achieved at the much higher testing temperature of 723 K for the ECAP-processed alloy.The significant difference in the optimum superplastic temperature was attributed to the much finer grain size of 72 nm for the HPT-processed alloy,as compared to grain size of 2.2 μm for the one processed by ECAP.Rezaei et al.[19] used the same testing procedure to investigate superplastic capability of an extruded Mg-6Gd-3Y-0.5Ag alloy processed by different passes of simple shear extrusion (SSE)and found the largest SRS index of 0.45 at 623 K along with an activation energy of 112 kJ mol-1for the alloy processed by 6 passes of SSE,indicating a superplastic flow controlled by GBS.
During the recent years,many studies have acknowledged the validity of SPT results in evaluating the superplastic capability through measuring SRS indices for various fine-grained Mg alloys in the extruded state [20,21] and also after being processed by different SPD techniques such as ECAP[22–25],HPT [26,27],SSE [28,29],multi directional forging(MDF) [30,31],FSP [32] and constrained groove pressing(CGP) [33].Thereby,the aim of this study was set to investigate the superplastic flow in a fine-grained Mg-Gd-Y-Ag alloy processed by ECAP via SPT at high temperatures and different shear strain rates,and to correlate the measured SRS indices to the microstructural features observed before and after SPT.
2.Experimental procedure
2.1.Materials processing
An Mg-6 wt% Gd-3 wt% Y-1.5 wt% Ag alloy was produced by casting,using pure Mg ingot,Mg-30Gd and Mg-30Y (wt%) master alloys and pure Ag as the starting materials.The melting procedure was performed in an electrical resistant furnace at 1053 K under a covering flux to protect the melt from oxidation.The melt was poured into a pre-heated cylindrical steel mold having a diameter of 42 mm.The cast billet was then homogenized at 773 K for 10 h and then cooled in air to remove the dendritic structure formed during cooling,and ease the upcoming hot extrusion process.The actual composition of the cast billet was determined through inductively coupled plasma (ICP) spectroscopy and it was found to be 5.8 wt% Gd,2.7 wt% Y,1.4 wt% Ag and 90.1 wt% Mg.The homogenized billet was hot extruded to bars having cross section of 11 mm × 11 mm at the temperature of 673 K under a pressing velocity of 5 mm min-1with an extrusion ratio of 11.4.Afterwards,the extruded bar was cut into billets having a cross section of 10 mm × 10 mm and a length of 60 mm in order to be fed into the ECAP die.The ECAP process employed in this study was comprised of a deformation channel having a die angle of 90° and outer arc curvature of 20°,leading to an imposed equivalent mean strain of 1.02 on the workpiece per each pass.The ECAP process was carried out using route Bc at 553 K for 6 passes and pressing speed of 0.1 mm s-1,and the specimens were held for 15 min in the ECAP die between the consecutive passes before starting the pressing to achieve an isothermal state with the surrounding die.
2.2.Microstructural characterization
Electron back-scattered diffraction (EBSD) analysis was utilized to investigate the microstructural features for both extruded and ECAP-processed alloys in the as-processed conditions and also after SPT at high temperatures.The EBSD specimens were cut perpendicular to the extrusion direction(ED) and were then ground and polished by diamond paste suspensions.Afterwards,a final polishing stage using a solution comprised of ethanol-5% HNO3-5% ethylene glycol was performed to obtain a finished surface.The EBSD studies were performed using a field emission scanning electron microscope (FESEM),Philips XL30,equipped with an Oxford Instrument EBSD detector,where the step size and working voltage of 0.3 μm and 25 kV were applied,respectively.The EBSD data were processed using MTEX software.Boundaries having misorientation angles in the range of 2° to 15°were considered as the low angle grain boundaries (LAGBs),while those with misorientation angles of greater than 15°were identified as the high angle grain boundaries (HAGBs).Grain orientation spread (GOS) concept was used to determine the recrystallization fraction (fREX),so that the grains with GOS greater than 2° were detected as deformed grains,and those having GOS lower than 2° were considered to be recrystallized grains.Kernel average misorientation (KAM)maps along with their distribution diagrams were also obtained from the EBSD data with selecting a threshold misorientation angle ofθth=5° and a neighboring number ofnequal to 5 for the pixels at the center of kernel grid.
Transmission electron microscopy (TEM) was performed using an FEI Tecnai Osiris instrument to investigate the microstructural features of the ECAP-processed alloy at higher magnifications.The TEM specimens were cut normal to ED,thinned mechanically to a thickness of 100 μm,and electropolished by a twin-jet facility,using an electrolyte consisting of ethanol-5% HNO3-5% HCl at 273 K and a voltage of 12 V.All the TEM studies were done under the working voltage of 200 kV.
2.3.Mechanical testing
The SPT method was used to assess the superplastic flow behavior of the extruded and ECAP-processed alloys at high temperatures.The SPT setup used in this study involves a flat-ended cylindrical punch and a corresponding receiving die hole with the diameters of 3.1 and 3.15 mm,respectively.The SPT specimens with an initial thickness of 1 mm were cut normal to the ED using electro discharge machining,and then thinned to a thickness of 0.75 mm through grinding.Testing of the extruded alloys was carried out in a temperature range of 623-723 K,whereas the ECAP-processed samples were tested in the 573-673 K temperature range.The shear strain rate for the SPT was between 1.6 × 10⁻²and 1.3 × 10⁻¹s-1.All shear punch tests were performed using a screw-driven universal testing machine equipped with a three-zone furnace.The instantaneous load-displacement data for SPT were acquired by a computer software and incorporated to construct the shear flow stress curves according to the following relationship [34]:

Fig.1.(a) 3D schematic view of a shear-punch assembly [35],and (b) the 2D schematic illustration of a deformed SPT specimen clamped within a shear-punch assembly during testing [36].
whereτis shear stress,Fis the applied load,Dis the average of the punch and die hole diameters andtis the initial thickness of the SPT specimen.The shear strain rate (˙γ) during SPT can also be given through the following relationship[34]:
Fig.1a and b depicts the schematic illustration of the SPT assembly in 3D and 2D views,respectively.A deformed SPT specimen with an initial thickness oftduring testing is well illustrated in the 2D schematic view of Fig.1b.The SPT specimen is firmly clamped between two stationary holders within the shear-punch setup and the specimen is deformed by a flat-ended cylindrical punch during the application of an external load.The shear deformation zones in the deformed SPT specimen are marked by the parallel hatched lines in the schematic illustration of Fig.1b.
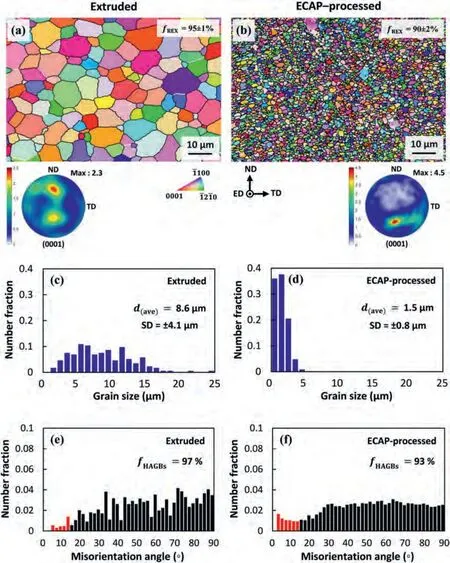
Fig.2.The IPF maps of the extruded (a) and ECAP-processed (b) alloys along with their corresponding (0001) pole figures presented below them;the grain size and misorientation angle distribution diagrams for both cases of the extruded (c and e) and ECAP-processed (d and f) alloys obtained from EBSD results.
3.Results
3.1.Microstructural observations
Fig.2a and b illustrate the respective IPF maps of the extruded and ECAP-processed alloys along with their (0001)basal pole figures corresponding to the TD-ND section.The extruded alloy is comprised of a fully recrystallized microstructure having equiaxed grains having a mean size of 8.6 μm (with a standard deviation of SD=±4.1 μm),whereas the microstructure of the ECAP-processed alloy is significantly refined having an overall average grain size of 1.5 μm (SD=0.8 μm),and an average grain size of 1.3 μm when only the newly formed dynamically recrystallized (DRXed) grains are considered.Both extruded and ECAP-processed alloys exhibited the respectivefREXof 95±1 and 90±2%.Fig.2c and d shows the grain size distribution diagrams obtained from the EBSD data for the extruded and ECAP-processed alloys,respectively.According to Fig.2c,the extruded alloy exhibits a wide distribution of grain size,while for the ECAP-processed alloy a noticeable shift to the smaller grain sizes along with a much narrower distribution is evident (Fig.2d).As depicted in Fig.2e and f,the misorientation angle distribution diagrams,derived from the corresponding EBSD maps,show high fractions of HAGBs of 97 and 93% for the extruded and ECAP-processed conditions,respectively.
For a better understanding of the microstructural evolution after severe deformation,TEM investigations were performed on the ECAP-processed alloy.Fig.3a and b depict the bright field TEM micrographs at different magnifications.The development of freshly formed fine DRXed grains and formation of a series of spherical nano-particles,mostly distributed at the sites of the newly formed boundaries of these grains after ECAP,is clear in the TEM images (Fig.3b).A selected area electron diffraction(SAED)pattern taken from the aforementioned nano-particles is shown in the upper right corner of the TEM micrograph in Fig.3b,indexing an FCC structure with a zone axis ofZ=[12] and lattice parameter ofa=2.21 nm.For chemical analysis,a high angle annular dark field (HAADF) image along with its corresponding elemental maps are provided in Fig.3c,indicating a discernible segregation of Gd,Y and also Ag at the locations of the nanoparticles.Fig.3d shows an energy dispersive spectroscopy(EDS) spectrum along with its chemical analysis results that was taken from location“A”marked by a red arrow in Fig.3c.According to the EDS results obtained by TEM studies,the spherical nano-particles have a composition close to Mg5Gdtype compounds.
3.2.High temperature flow behavior
As illustrated in Fig.4,the high-temperature shear flow stress data were plotted against the cross-head displacement normalized to the initial thickness of the SPT specimens.Fig.4a and b illustrate the SPT curves at the constant testing temperature of 623 K and different shear strain rates,whereas Fig.4c and d represent the flow curves at the constant shear strain rate of 8.3 × 10⁻²s-1and different testing temperatures for the extruded and ECAP-processed alloys.It can be observed that at a constant temperature,the peak shear stress(τm) and the overall shear flow stress increase by raising the strain rate for both cases (Fig.4a and b).Furthermore,as the testing temperature increases,both peak shear stress and flow stress drop continuously at any given normalized displacement(Fig.4c and d).
In order to measure the SRS indices (m-values),the plots of variations in normalized peak shear stress(τm/G)with temperature compensated shear strain rate (˙γ T/G) are constructed from the SPT results in a double-logarithmic scale for both extruded and ECAP-processed alloys,as depicted in Fig.5a and b,respectively.The flow behavior of metallic materials at elevated temperatures can be expressed through the wellknown power-law relationship,correlating the strain rate to flow stress and temperature according to the following equation [5]:
whereAis a material constant,Dothe frequency factor,Gthe shear modulus,bthe Burgers vector,kthe Boltzmann’s constant,Tthe absolute temperature,dthe grain size,σthe flow stress,Qthe activation energy,Rthe universal gas constant,pthe exponent of inverse grain size andnthe stress exponent.The above power-law relationship can be considered in the shear mode in order to be applied to the SPT result so that it can be written and rearranged as follows [18]:
whereA′is a material constant andmthe SRS index equal to the inverse of stress exponent.By considering the above relationship,the SRS index can be calculated at a constant temperature through differentiating Eq.(4):
Torbati-Sarraf et al.[27] for the first time evaluated the validity of SRS index obtained from SPT results through measuring them-value at the two testing temperatures of 473 and 523 K for an ultrafine-grained ZK60 magnesium alloy processed by 5 turns of HPT at room temperature under an applied constant pressure of 2 GPa.They compared the results with the corresponding values achieved from hot tensile testing at the same temperatures.It was reported that,a highm-value of 0.47,measured from tensile testing at 523 K for the HPT-processed alloy,was very close to the corresponding value of 0.49 obtained from the SPT results at the same testing temperature.Moreover,a maximum elongation to failure of 940% was achieved at 523 K from tensile testing that is in agreement with the respective highm-values of 0.47 and 0.49 obtained from tensile and SPT results,indicative of superplastic flow and GBS.In another case,Esfandyarpour et al.[37] also assessed the capability of SPT in evaluating the hot deformation behavior of a rolled Sn-5Sb alloy in a temperature range of 298 to 400 K,and compared the results with the ones obtained by hot tensile testing.It was found out that there is reasonable consistency between the hot deformation parameters such as stress exponent (inverse ofm-value) and activation energy values in both cases.Therefore,considering these cases,it can be deduced that them-values measured through the SPT results are as effective and valid as the those obtained from conventional tensile testing method to assess the superplastic behavior,or in general the hot flow behavior of metallic materials.
To account for the temperature dependency of the elastic constants in measuring ofm-value at each temperature,the shear modulus,G,was calculated in MPa from the following relationship [38]:
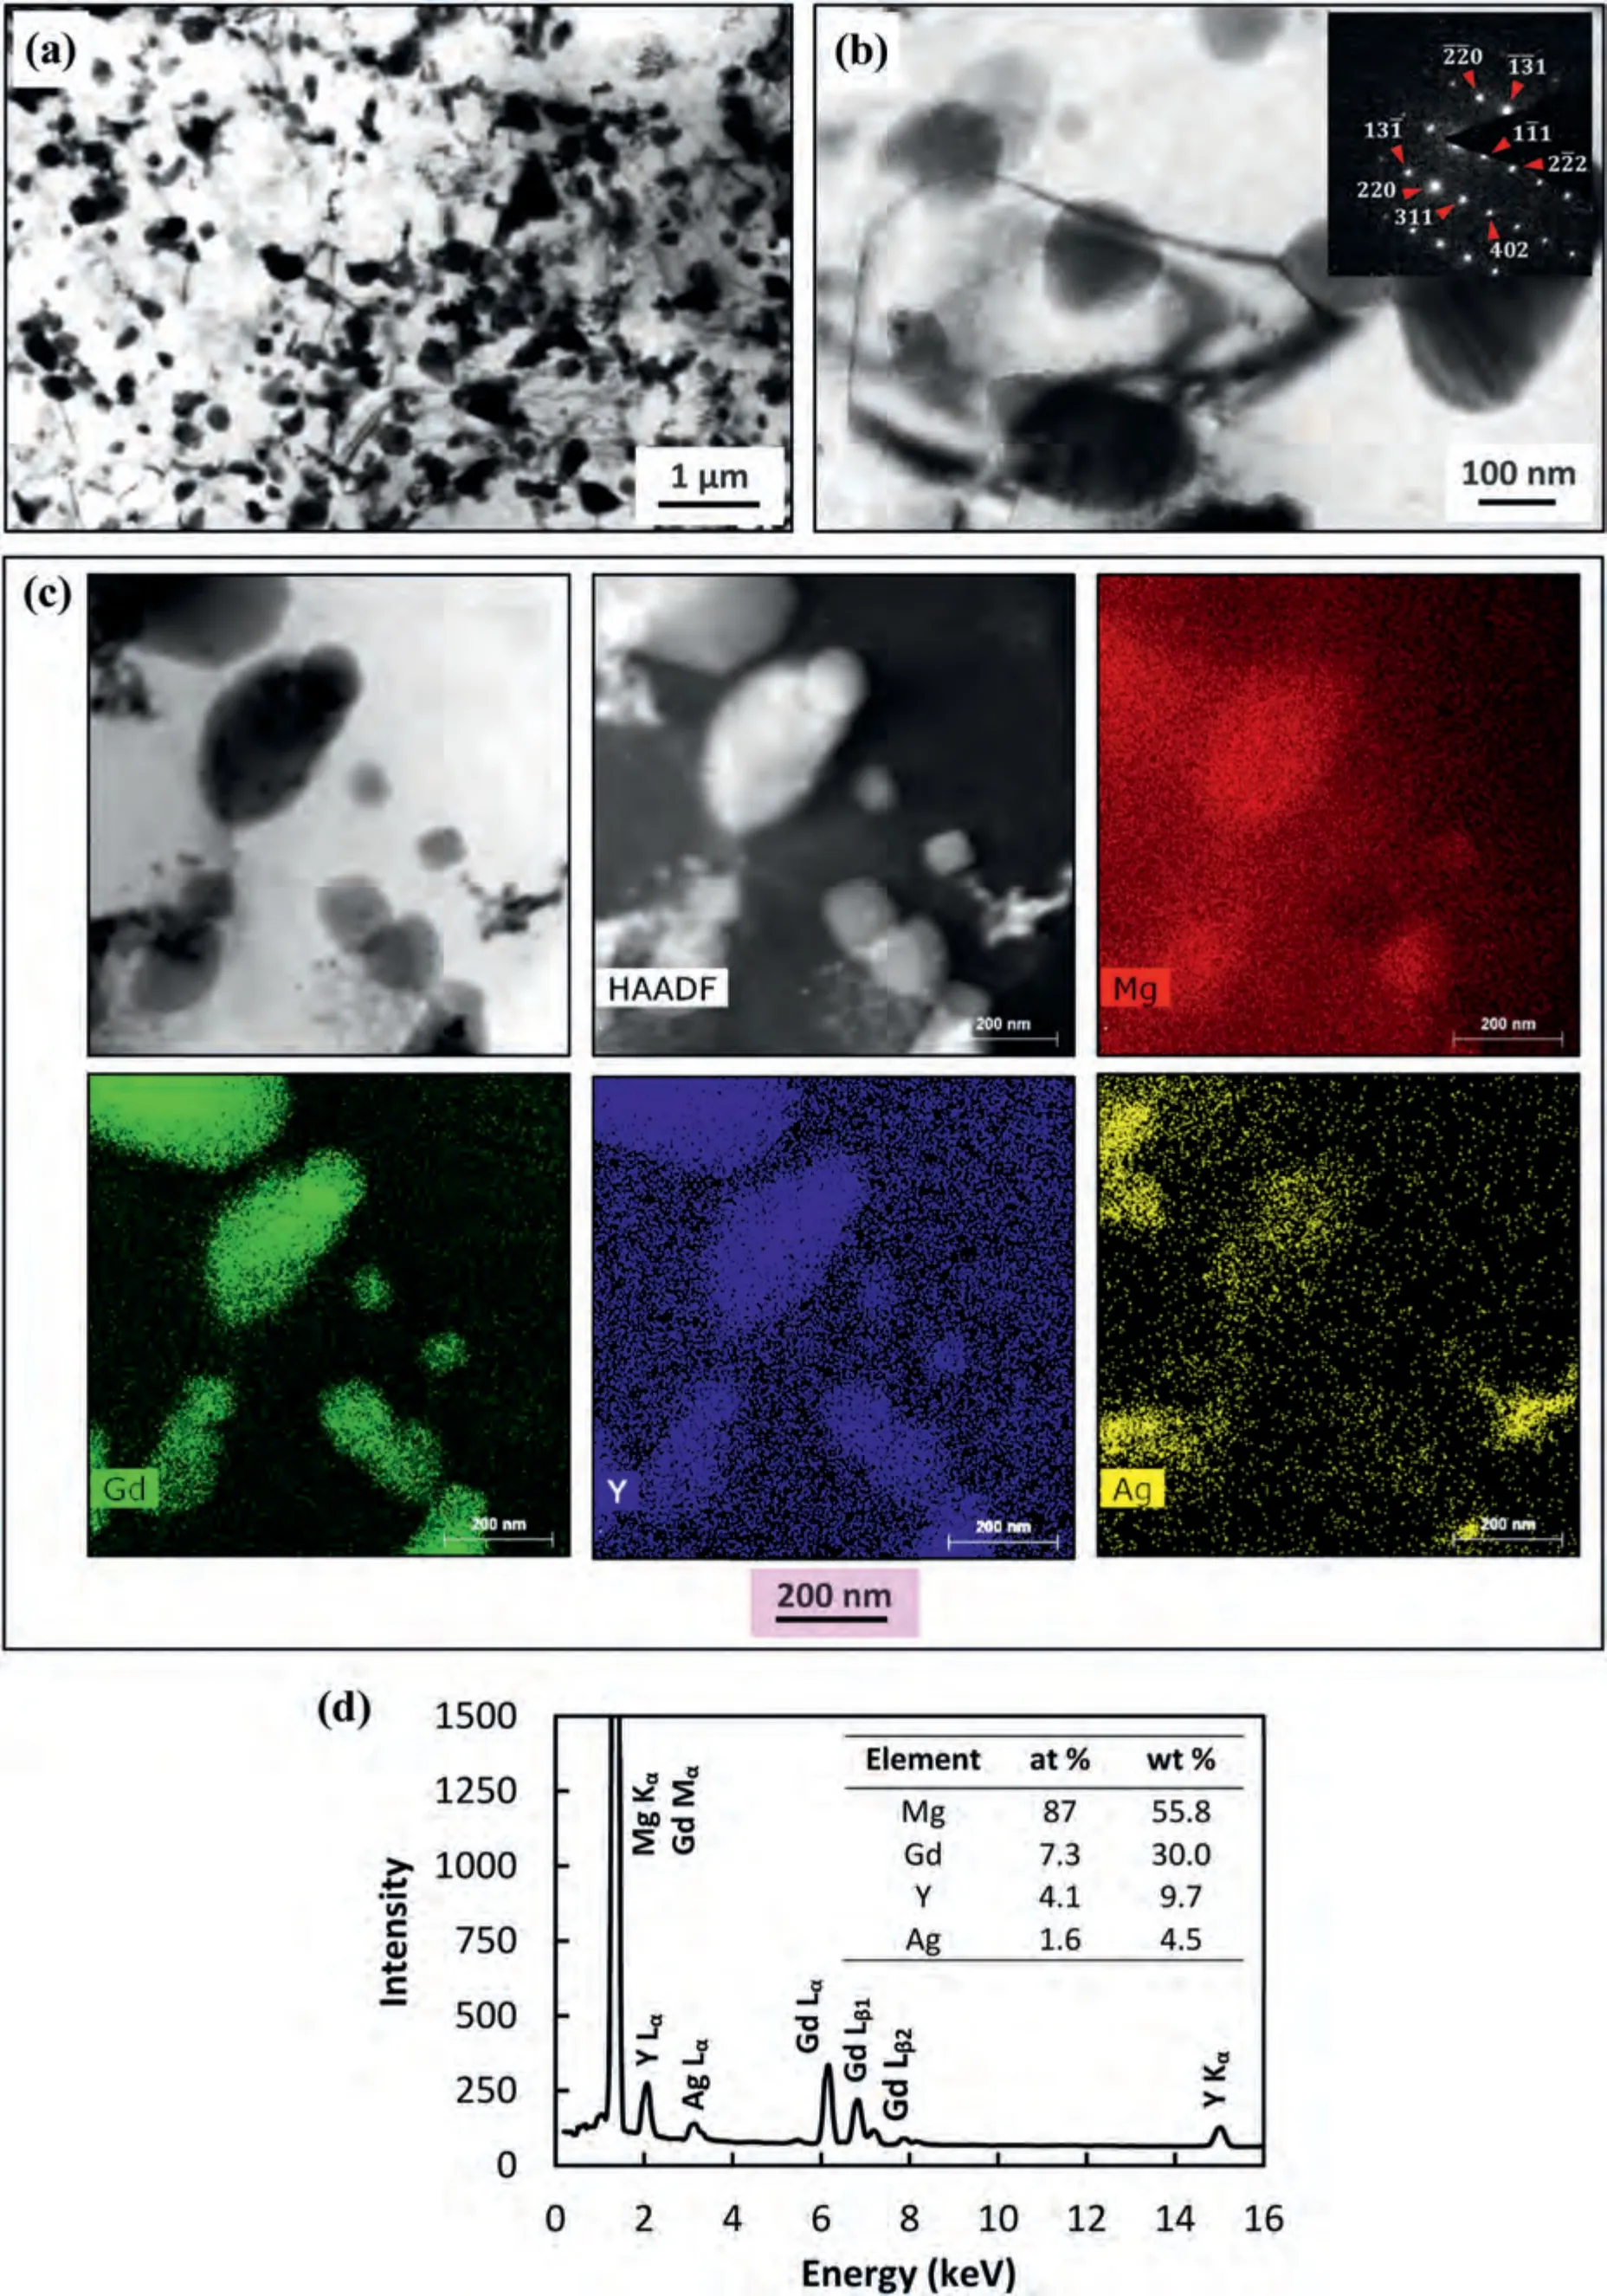
Fig.3.Bright field TEM micrographs of the ECAP-processed alloy at different magnifications (a and b) with the SAED pattern obtained from the round nano-particles shown in the top right corner of (b) indexing an FCC structure with a zone axis of Z=[12];the HAADF image and the corresponding elemental maps of the nano-particles (c) along with the EDS analysis result (d) taken from a particle from location “A” marked in (c).
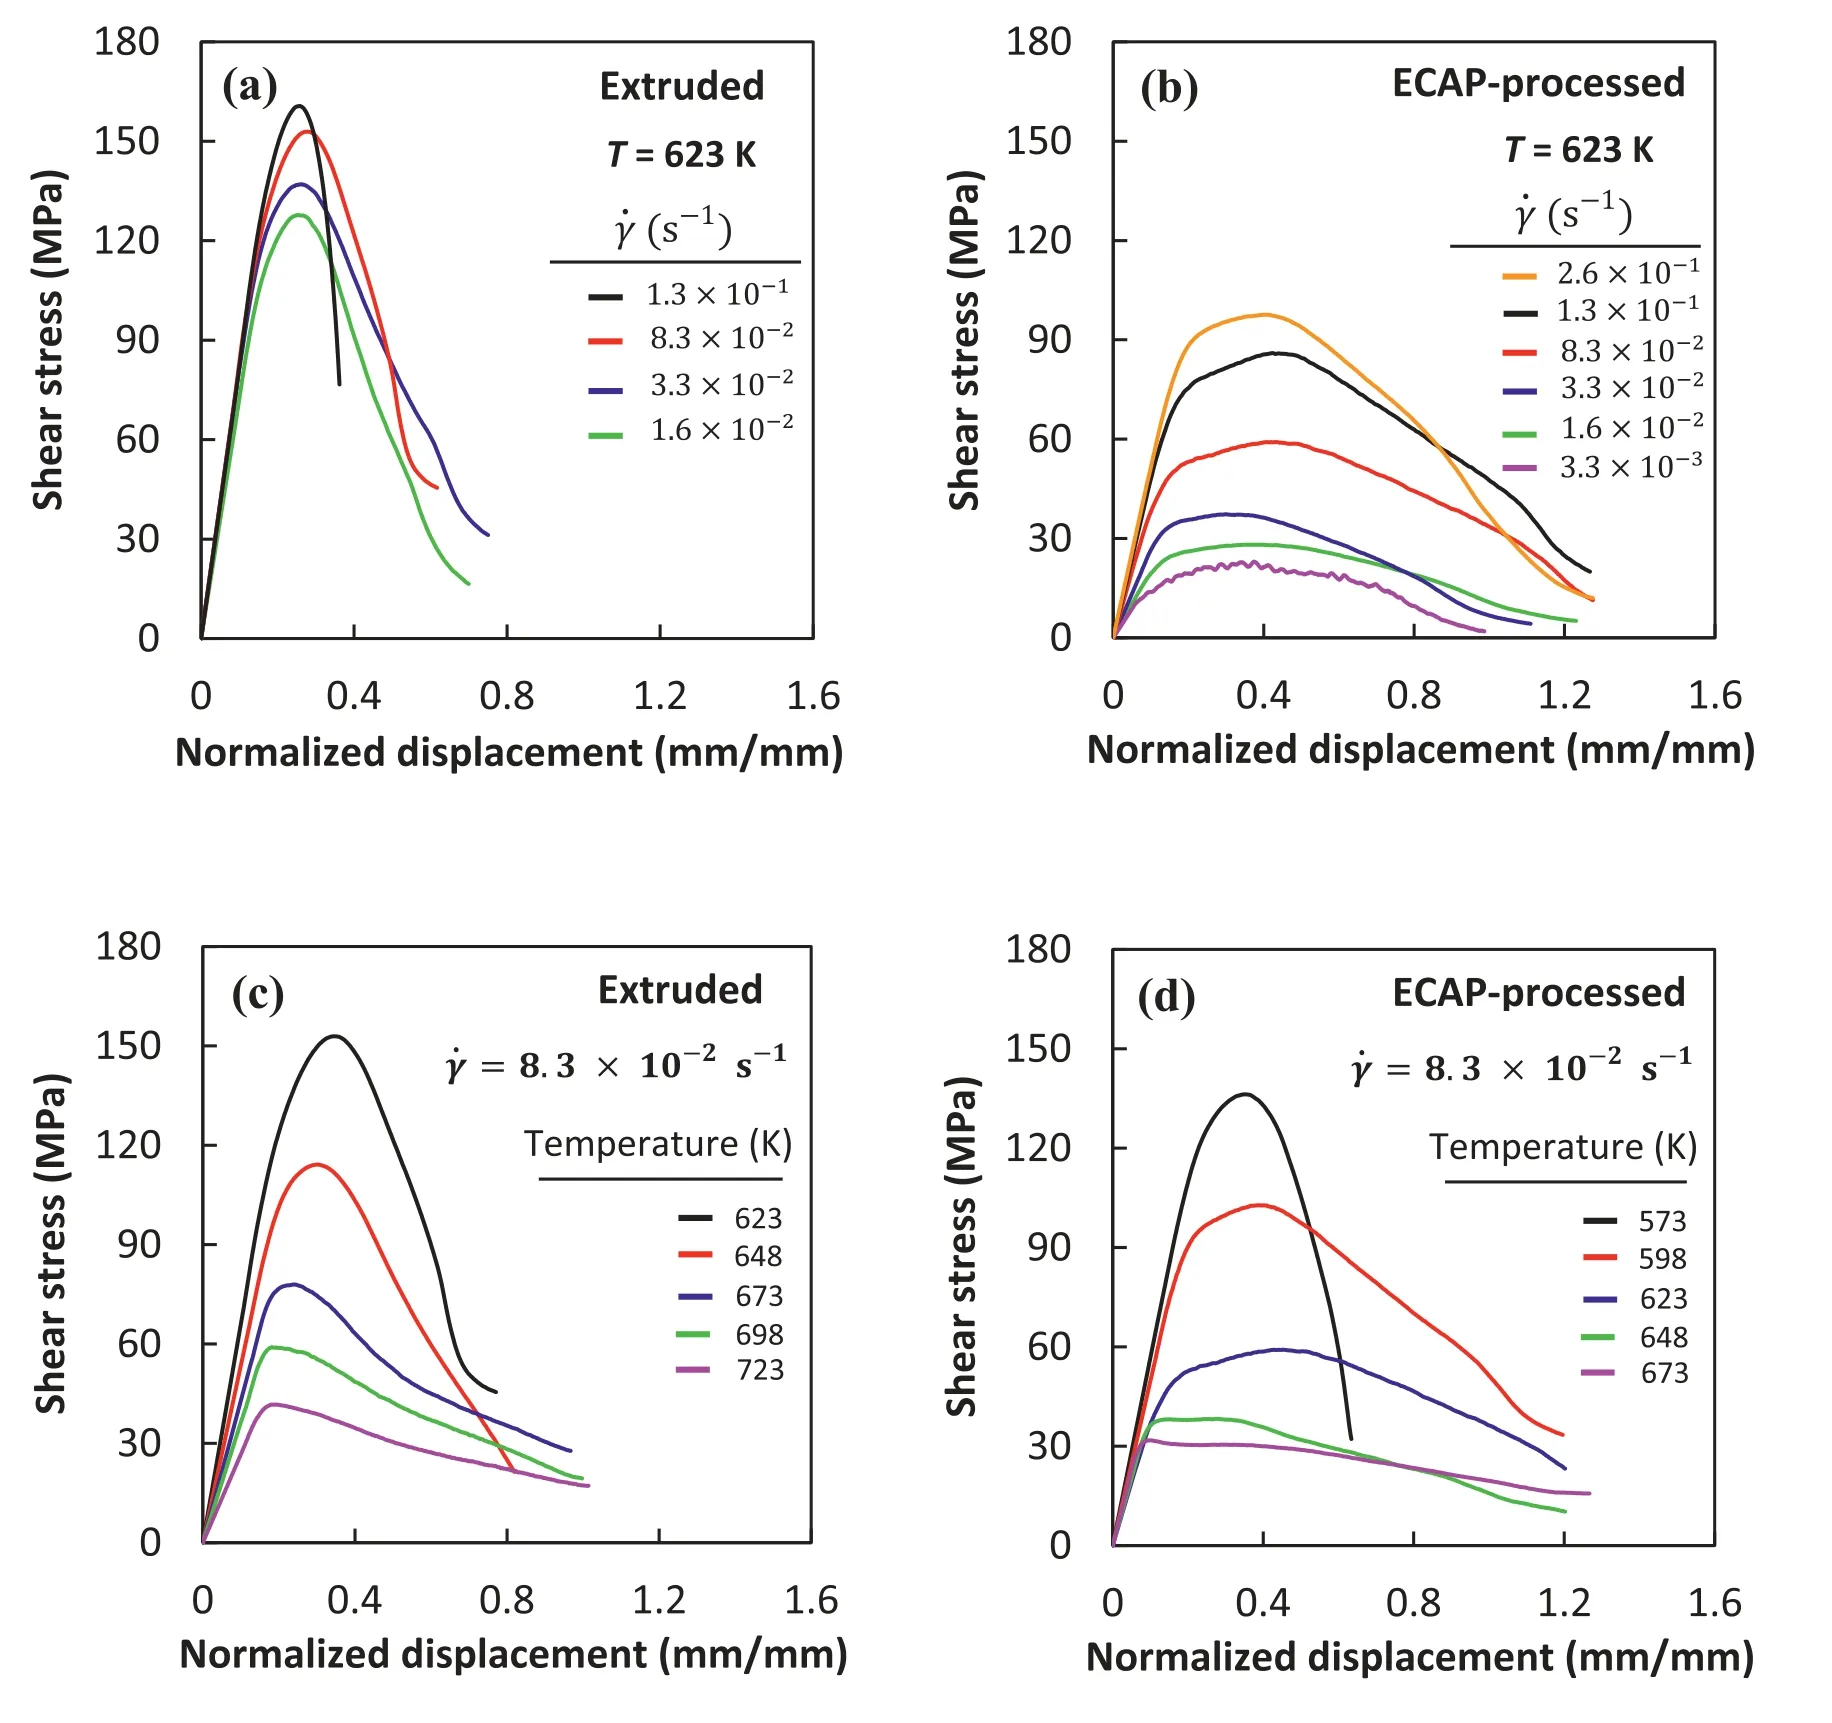
Fig.4.Shear stress vs.normalized displacement curves obtained from SPT at a constant temperature of T=623 K and different shear strain rates for both the extruded (a) and ECAP-processed (b) alloys,and also at a constant shear strain rate of ˙γ=8.3 × 10⁻² s-1 but at different testing temperatures for the extruded (c) and ECAP-processed (d) alloys.
According to Eq.(5),the slope of each line in the diagrams of Fig.5 represents the measured SRS index for the corresponding testing temperature.Fig.6 plots and summarizes the changes ofm-values with testing temperature,where it can be deduced that the variations ofm-values with temperature for both extruded and ECAP-processed alloys exhibit a bell-shape behavior,i.e.,first the SRS index increases,reaching a maximum value,and then drops continuously with temperature.Based on the data presented in Figs.5 and 6,however,the major differences between the flow behavior of the extruded and ECAP-processed alloys lie in the values of SRS indices.For instance,at the temperature of 623 K,the extruded alloy possesses a SRS index of 0.11,while that of the ECAPprocessed alloy is 0.52.This difference will be discussed in the terms of microstructural features in the discussion section.
For determining the mechanism of deformation,calculation of the activation energy is inevitable.By considering the power-law relationship of Eq.(4),the activation energyQ,at a constant temperature-compensated shear strain rate,can be calculated as:
The variation of normalized peak shear stress with the inverse of temperature at different constant temperaturecompensated shear strain rates is plotted for the ECAPprocessed alloy,as shown in Fig.7.The plot of (τm/G) vs.(1/T) was constructed between the two temperatures of 598 and 623 K,corresponding to the largestm-values of 0.41 and 0.52,respectively.Therefore,the calculated activation energy ofQcould only be representative of the occurrence of GBS and superplastic flow,where it can be compared with the ideal activation energy of grain boundary diffusion for Mg.Accordingly,an average apparent activation value ofQave=118 kJ mol-1was achieved.

Fig.5.The variation of normalized peak shear stress (τm/G) with temperature compensated shear strain rate (˙γ T/G) at different testing temperatures obtained from the SPT results for both the extruded (a) and ECAP-processed(b) alloys.

Fig.6.The variation of strain rate sensitivity index (m-value) with the testing temperature obtained from the SPT results for the extruded and ECAPprocessed alloys.
The microstructural features of the shear deformation zones after SPT for the extruded and ECAPed alloys at the temperatures of 623 and 673 K and a shear strain rate of 3.3 × 10⁻²s-1were examined via EBSD analysis and the results are illustrated in the form of IPF maps and their corresponding KAM data,as shown in Figs.8 and 9.The significant differences in the microstructure after SPT at 623 K for the extruded and ECAP-processed alloys are visible in the IPF maps of Fig.8a and b.The extruded alloy is mostly comprised of large grains elongated along a direction inclined about∼45° relative to the loading axis of SPT,and a small fraction of very fine DRXed grains mainly distributed at the grain boundaries of the deformed grains (Fig.8a).In contrast,in the case of ECAP-processed alloy,after SPT at the same temperature,the microstructure consists of fine equiaxed grains with no sign of directionality even after straining (Fig.8b).According to the EBSD results,the average size of the fine DRXed grains for the ECAP-processed alloy after SPT at 623 K is 1.3 μm,without significant change compared to the as-processed alloy.The respectivefREXof 16 and 86%are obtained for the extruded and ECAPed alloy after SPT at 623 K.The corresponding KAM map of the extruded alloy shown in Fig.8c represents a noticeable level of in-grain misorientation gradients,whereas the ECAP-processed alloy exhibits an almost strain-free microstructure,mostly containing fine DRXed grains.This discrepancy in KAM values can also be observed in the histograms of Fig.8e and f,where a drastic shift to the lower KAM angles can be observed for the ECAP-processed alloy.

Fig.7.The variation of normalized shear stress (τm/G) with the reciprocal of temperature at different constant shear strain rates obtained from the SPT results for the ECAP-processed alloy in the superplastic forming temperature range.

Fig.8.The IPF maps and the KAM maps of the extruded (a and c) and ECAP-processed (b and d) taken from the shear deformation zone after SPT at the temperature of T=623 K and shear strain rate of ˙γ=3.3 × 10⁻² s-1,and the corresponding KAM distribution diagrams obtained from the EBSD results shown in (e) and (f) for the extruded and ECAP-processed alloys,respectively.
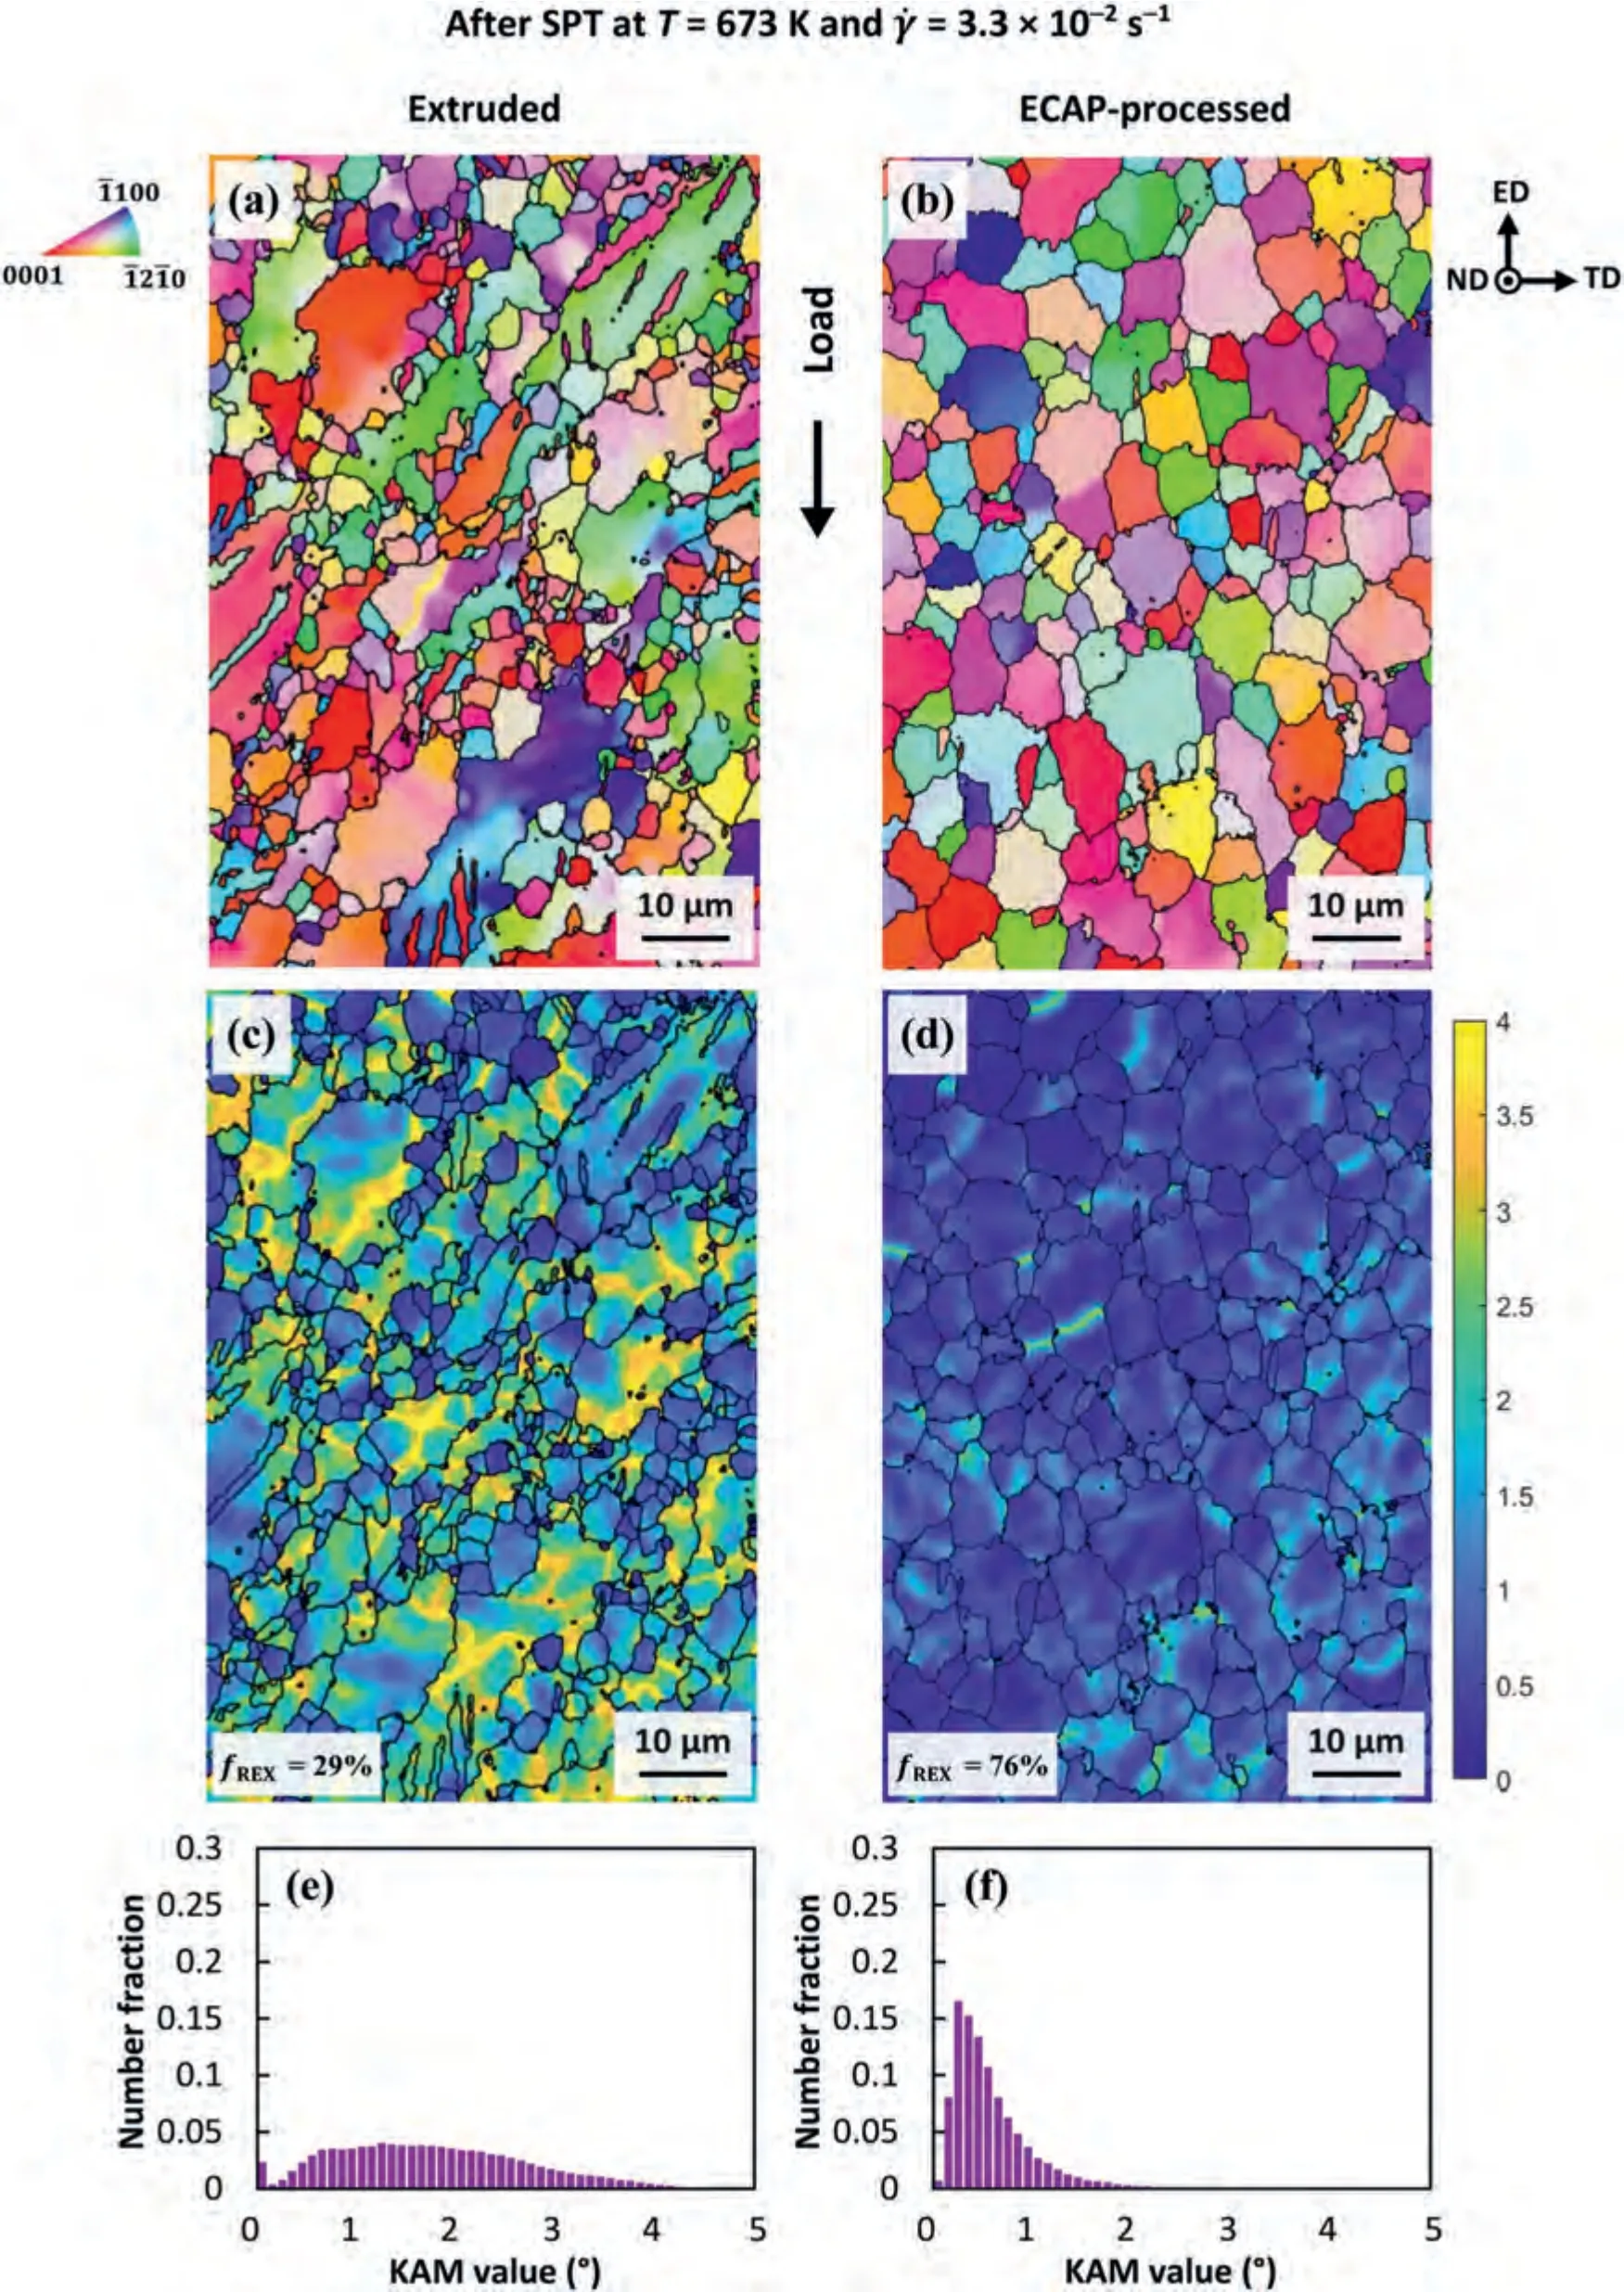
Fig.9.The IPF maps and the KAM maps of the extruded (a and c) and ECAP-processed (b and d) taken from the shear deformation zone after SPT at the temperature of T=673 K and shear strain rate of ˙γ=3.3 × 10⁻² s-1,and the corresponding KAM distribution diagrams obtained from the EBSD results shown in (e) and (f) for the extruded and ECAP-processed alloys,respectively.
Similarly,Fig.9a and b display the IPF maps after SPT,this time at 673 K,with the same shear strain rate of 3.3 × 10⁻²s-1,for the extruded and ECAPed alloys,along with their KAM maps in Fig.9c and d and their corresponding KAM angle distribution diagrams in Fig.9e and f.The extruded alloy still contains large,heavily deformed,grains with some DRXed grains at the boundaries,larger than the ones observed at 623 K in Fig.8a.However,according to the IPF map of Fig.9b,the most drastic evolution has occurred for the ECAP-processed alloy,where a significant grain coarsening has taken place at 673 K,resulting in the average grain size of 6.8 μm.Grains are still equiaxed and no preferential directionality is observed for the ECAP-processed alloy,whereas the extruded alloy still exhibits elongated grains in the shear zone of SPT (Fig.9a).The extruded alloy again exhibits a high level of KAM value,indicative of a heavily deformed microstructure,with afREXof 29% (Fig.9c and e).On the other hand,in the case of the ECAP-processed alloy,the microstructure keeps a much higherfREXof 76%,with overall lower KAM values in the map of Fig.9d,and in the histogram of Fig.9f.
4.Discussion
The formation of equiaxed grains within a fully recrystallized microstructure withfREX=95% in the as-extruded alloy,shown in Fig.2a,stems from the intrinsic tendency of the tested alloy for refinement after hot extrusion at the high temperature of 673 K.After ECAP,the microstructure experiences even more refinement (Fig.2b),in such a way that a homogeneous grain structure consisting of fine DRXed grains is obtained.This can be also inferred from its narrow grain size distribution in Fig.2d.This microstructural uniformity can be attributed to the significant activity of DRX in the material after experiencing high levels of imposed strains,by 6 passes of ECAP,and also the incorporation of working route Bc that increases the homogeneity of the strain distribution throughout the specimen.
According to the (0001) pole figures of the extruded alloy shown in Fig.2a,the typical fiber texture has not formed.Instead,it can be perceived that the majority of the basal planes are inclined relative to the ED with a split in the basal poles.This unusual arrangement of the basal plane has been reported for other extruded Mg-Gd-Y alloys before[28,39,40],and was attributed to the effect of rare earth (RE)elements on postponing the occurrence of DRX,and also activation of non-basal slip systems during hot extrusion.On the other hand,in the case of the ECAP-processed alloy,there is one concentrated basal pole with no splitting,indicative of the arrangement of the majority of basal planes inclined about∼45° relative to ED.This configuration of the basal planes is the typical shear component usually occurring in Mg alloys after being processed by ECAP using route Bc,which has also been reported in previous studies [22,41–43].
The most important feature of the TEM micrographs in Fig.3,besides the development of fine grains,is the formation of the spherical Mg5Gd-type nano-particles mostly at the boundaries of the newly formed fine DRXed grains after ECAP.These particles are formed during straining in ECAP through dynamic precipitation,which is a strain-induced phenomenon depending on the development of dislocations and new grain boundaries.The formation of the Mg5Gd-type compounds in the form of nano-sized particles with a similar globular morphology through dynamic precipitation has been reported in several previous works for different Mg-Gd-Y alloys processed by various thermo-mechanical treatments[19,44–47],and also in our previous works [48,49] for an alloy similar to that in the present study after ECAP and SSE at the same processing temperature of 553 K.The possible role of these Mg5Gd-type particles on the superplastic behavior of the ECAP-processed alloy will be discussed later.
According to the high-temperature SPT curves,shown in Fig.4,it can be observed that after an initial linear elastic behavior,the material undergoes a short hardening stage until a peak shear stress is reached.These peak stresses will be used to obtain the SRS indices at different temperatures.With further straining,the shear flow stress drops due to the prevalence of softening effects.The raise in the flow stress by increasing the shear strain rate at a constant temperature for both extruded and ECAP-processed alloys (Fig.4a and b)is indicative of a positive SRS,attributed to the increase of the dislocation multiplication rate.
Considering the SRS measurements,illustrated in Fig.5 and 6,the significant differences in the obtainedm-values of the extruded and ECAPed alloys must be interpreted in terms of their microstructural features.The largest SRS indices of 0.41 and 0.52 measured at the temperatures of 598 and 623 K are close to the theoretical SRS index ofm=0.5 [5,50],indicating the occurrence of superplastic flow at these temperatures for the fine-grained alloy processed by ECAP.However,in the case of the extruded alloy,the highestm-value reached 0.24 at 673 K,which does not indicate a superplastic behavior.One of the most important features of the (τm/G) vs.(˙γ T/G) plots for the ECAP-processed alloys shown in Fig.5b,is the development of a sigmoidal behavior at the temperatures of 598 and 623 K,where the superplastic flow took place.This type of behavior implies that superplasticity occurs in a certain range of strain rate,which is known as region II [6,7].Therefore,for the lower and higher strain rates outside this specific range (i.e.,respective regions of I and III [6,7]) at the temperature of superplastic forming,the dependency of flow stress to the strain rate decreases noticeably,leading to reduced SRS and deterioration of GBS.The observed superplastic flow in the ECAP-processed alloy is attributed to the fine-grained structure developed through the progress of DRX after experiencing high levels of straining.As the emergence of GBS during superplastic flow is basically assisted by diffusion of atoms through the grain boundaries,finer grain structures would enhance the contribution of GBS during deformation at high temperatures,due to the higher density of HAGBs.Consequently,the difference in the grain size would best explain the discrepancy in the type of flow behavior between the extruded and ECAP-processed alloys.
The average activation energy of 118 kJ mol-1achieved for the superplastic flow of the ECAP-processed alloy(Fig.7),is slightly greater than the activation energy of grain boundary diffusion for Mg (92 kJ mol-1[22]).This could be ascribed to the presence of the large RE elements Gd and Y having low diffusion rates in the Mg matrix [51].Moreover,the formation of the globular Mg5Gd-type nano-particles through dynamic precipitation,shown by the TEM studies,could also make a contribution to increasing the required activation energy of GBS during superplastic flow.It was shown via TEM studies that the Mg5Gd-type nano-particles are mostly formed at boundary sites of the newly formed DRXed grains.Therefore,the presence of these particles during superplastic flow could cause disturbance,as they might act as obstacles to easy grain boundary sliding,leading to deterioration of superplastic capability.As a result,greater activation energy of superplastic flow might be required in order to make the GBS process able to overcome the aforementioned barrier.The calculated activation energy of 118 kJ mol-1for the superplastic flow is greater than the ideal value of 92 kJ mol-1for the grain boundary diffusion of Mg.In addition to the probable role of RE elements as mentioned earlier,the observed difference in the obtained activation energy with the ideal value of 92 kJ mol-1could be attributed to the presence and formation of Mg5Gd-type nano-particles at the boundary sites of fine DRXed grains,leading to a more difficult GBS.
To sum up,by consideringm-values close to 0.5 at the temperatures of 598 and 623 K and also the calculated average activation energy of 118 kJ mol-1near to the one for grain boundary diffusion in Mg,a deformation mechanism of GBS assisted by grain boundary diffusion is proposed for the superplastic flow in the fine-grained alloy processed by ECAP.
The microstructural observations after SPT at 623 K are shown in Fig.8.The formation of elongated deformed grains and shear bands in the microstructure of the extruded alloy after SPT depicted in Fig.8a justifies the lowestm-value of 0.11 at 623 K.In contrast,the preserved equiaxed structure of the fine DRXed grains in the ECAP-processed alloy even after straining via SPT (Fig.8b) corroborates them-value of 0.52 achieved at 623 K.In other words,superplastic flow is able to retain an equiaxed grain structure with no preferred directionality and also absence of grain growth,due to the thermal stability of the microstructure.In addition,the fact that even after SPT at 623 K there is still a remarkably high fraction of recrystallized grains (fREX=86%) confirms the occurrence of GBS as the dominant mechanism of deformation,i.e.without significant dislocation slip.This can be well observed through the KAM results of the ECAP-processed alloy after SPT at 623 K in Fig.8d and f.The nano-sized Mg5Gd-type particles are likely to play a role in the thermal stability of the microstructure through imposing a drag pressure on the boundaries of the DRXed grains via Zenner effect,impeding the dynamic grain growth during superplastic flow at 598 and 623 K for the ECAP-processed alloy.Moreover,according to the HAADF and its corresponding elemental distribution maps of Fig.3 obtained during TEM studies,it is shown that Ag element is preferentially segregated on the sites of the Mg5Gd-type nano-particles.The presence of Ag element might encourage the formation of second phase particles through absorption and co-segregation with Gd and Y due to their noticeable atomic size difference [52].Therefore,the indirect role of Ag element on superplasticity could be associated with favoring the formation of the Mg5Gd-type nano-particles and their effect on deterring the grain growth during the occurrence of GBS and superplastic flow.
The significant grain growth occurring after SPT at 673 K for the ECAP-processed alloy (Fig.9b) would justify the drastic drop of SRS index from the highest value of 0.52 obtained at 623 K to the lower value of 0.27 at 673 K.However,the microstructure has remained equiaxed,with a highfREX=76% compared to its extruded counterpart (29%).It may therefore be assumed that GBS remains non negligible,at least in the first stages,when the microstructure is still fine enough.
5.Conclusions
Superplasticity of an Mg-6Gd-3Y-1.5Ag (wt%) alloy after extrusion and ECAP was investigated by measuring the strain rate sensitivity indices through shear punch testing(SPT),and the following conclusions were drawn:
(1) EBSD maps showed a fully recrystallized microstructure for the extruded alloy with a mean grains size of 8.6 μm,while the ECAP-processed alloy exhibited a uniform finegrained structure with an average size of 1.3 μm for the newly formed fine dynamically recrystallized (DRXed)grains and a high fraction of high angle grain boundaries(HAGBs),caused by extensive DRX.
(2) Transmission electron microscopy (TEM) of the ECAPprocessed alloy showed that globular Mg5Gd-type nanosized particles were formed through dynamic precipitation,mostly at new boundaries of the DRXed grains.
(3) SPT results showed higher values of strain rate sensitivity(m-value) for the ECAP-processed alloy,reaching 0.41 and 0.52 at 598 and 623 K,indicating a superplastic flow controlled by grain boundary sliding (GBS).The average activation energy of 118 kJ mol-1calculated for the ECAPprocessed alloy along with them-values close to 0.5 suggested GBS assisted by grain boundary diffusion as the dominant deformation mechanism during superplastic flow at 598 and 623 K.
(4) The EBSD studies after SPT at 623 K revealed an equiaxed microstructure without any grain growth for the finegrained alloy processed by ECAP,whereas the microstructure of the extruded alloy at the same temperature was comprised of deformed grains elongated along the loading axis of SPT.The microstructural feature of the ECAPprocessed alloy was responsible for the observed superplasticity at 623 K,with GBS as the controlling deformation mechanism.
Declaration of competing interest
The authors declare that they have no known competing financial interests or personal relationships that could have appeared to influence the work reported in this paper.
CRediT authorship contribution statement
A.Rezaei:Conceptualization,Investigation,Methodology,Writing–original draft.R.Mahmudi:Conceptualization,Supervision,Validation,Writing– review &editing.R.E.Logé:Writing– review &editing.
Data availability statement
Data will be made available on request.
Funding
This research did not receive any specific grant from funding agencies in the public,commercial,or not-for-profit sectors.
Acknowledgements
The authors would like to thank Dr.Cyril Cayron at Laboratory of Thermomechanical Metallurgy (LMTM),École Polytechnique Fédérale de Lausanne (EPFL),Switzerland for his assistance in the EBSD and TEM experiments.R.Logé acknowledges the generous financial support of PX Group to their laboratory.
杂志排行

Journal of Magnesium and Alloys的其它文章
- Improvements in mechanical,corrosion,and biocompatibility properties of Mg–Zr–Sr–Dy alloys via extrusion for biodegradable implant applications
- Ultrasonic solidification mechanism and optimized application performances of ternary Mg71.5Zn26.1Y2.4 alloy
- GO/MgO/Mg interface mediated strengthening and electromagnetic interference shielding in AZ31 composite
- Experimental and theoretical studies on two-dimensional vanadium carbide hybrid nanomaterials derived from V4AlC3 as excellent catalyst for MgH2
- Electrochemical synthesis of boron-containing coatings on Mg alloy for thermal neutron shielding
- Achieving high-strain-rate and low-temperature superplasticity in an ECAP-processed Mg-Y-Er-Zn alloy via Ag addition