Experiment/simulation correlation-based methodology for metallic ballistic protection solutions
2023-12-07YohnCosquerPtrieLongreOlivierPntlClueGilh
Yohn Cosquer ,Ptrie Longère ,Olivier Pntlé ,Clue Gilh
a DGA-Techniques Aéronautiques, 47 Rue Saint-Jean, 31130 Balma, France
b Institut Clément Ader, Université de Toulouse, ISAE-SUPAERO, IMT Mines Albi, UPS, INSA, CNRS, 3 Rue Caroline Aigle, 31400 Toulouse, France
c Laboratoire Génie de Production, INP/ENIT, Université de Toulouse, 47 Avenue d’Azereix, F-65016 Tarbes, France
d CNIM Systèmes Industriels, 8 Zone Portuaire de Brégaillon, 83500 La Seyne-sur-Mer, France
Keywords: Impact Terminal ballistics Ballistic limit MARS380 Aluminium alloy 7.62×51 AP8
ABSTRACT A methodology is developed based on the coupling of a finite element code with an optimisation module for the design of land vehicle armouring composed of lightweight aluminium alloy and high strength steel plate.Following an experiment/simulation correlation,a numerical model has been built and calibrated considering monolithic plates and then verified considering a bi-metal protection against tungsten carbide projectile mimicking the core of a 7.62×51 AP8 ammunition.In addition,a method is proposed to obtain the vres-vi curve for the full 7.62×51 AP8 bullet from the vres-vi curve obtained from the core only.
1.Introduction
Today’s conflicts impose new challenges for conflict zones that are now predominantly urban,IEDs(improvised explosive devices,of the form of backpacks or car bombs for example) are unprecedented and unpredictable threats,and non-State armed groups(terrorist organisations type) appear,see Ref.[1].This situation poses a quasi-permanent risk to vehicles engaged in these conflicts.In the face of this,a quick solution would be to add layers of material to increase the level of protection of vehicles behind the front(for example military engineering) and/or areas usually not exposed(for example,roof or rear).However,such solutions would increase the mass of vehicles and could make air,sea and road transport more difficult.Moreover,in order to adapt to new threats,the strategy of designing an armoured vehicle has evolved.Indeed,formerly governed by a balance between lethality,survivability and mobility,the design now relies on many factors.The example given in Fig.1 shows that lift capacity and mobility are of paramount importance,which is often incompatible with an increase in mass.
Fig.1.Parameters to consider in the design of armoured vehicles.Former (left) and modern (right) design strategies.After Ref.[2].
It is therefore essential to have ballistic protection design tools that are sufficiently modular and responsive to consider both new threats and technological advances,in terms of e.g.materials and processes,to develop potentially complex functional stacks with optimal performance/mass ratio.In this aim in view,many designers use analytical approaches as a basis for optimisation,see for example [3-5].In particular,Wang &Lu in Ref.[6]chose an assembly consisting of ceramic and aluminium alloy of fixed total thickness.The authors analytically determined the optimal ceramic/metal thickness ratio to maximise the ballistic limit velocity (vBL,the incident velocity below which the projectile is stopped by the protection) of the assembly,and experimentally confirmed their prediction.In addition,Ben-Dor and his team propose a mathematical approach for minimising the stacking mass for a given vBL,see Ref.[7],or in the case of multi-impacts,see Ref.[8].Banichuk et al.in Ref.[9]developed their own optimisation model with very basic material models,and using a genetic algorithm.The authors were thus able to determine the material to be used for each of the twenty layers of their stacking to minimise the mass.Although effective,these analytical models have very limited areas of application since they generally do not consider strain and strain rate hardening,self-heating induced softening,adiabatic shear banding or/and progressive damage before failure,which however play an important role on the ballistic response of metals and alloys.Numerical finite element simulations could provide more latitude for parameter variations.In this context,Lee&Yoo in Ref.[10]developed a numerical model capable of replacing the model proposed in Ref.[3]and were thus able to numerically determine the optimal ceramic thickness/metal thickness ratio in order to maximise the vBLat fixed total thickness.This result then paves the way for further optimisations.Park et al.in Ref.[11]optimised a two-layer assembly using numerical impact simulations.However,2D models lack representativeness.Kim et al.in Ref.[12]optimised a multi-component assembly of aluminium alloy plates spaced by vacuum blades as part of hypervelocity impacts for spatial application.Two optimised systems were obtained: constant spacing and optimised thickness of aluminium alloy plates,or constant aluminium alloy plate thicknesses and optimised spacing.However,no variation in the materials used was considered.Paman et al.in Ref.[13]worked on optimising a stack of three materials: steel,titanium alloy and aluminium alloy.The stacking order and thickness of each plate were optimised.Fernández and Zaera in Ref.[14]considered a two-layer stacking consisting of a hard plate on the front and a ductile plate on the back.A numerical impact simulation model was constructed using Abaqus/Explicit.A neural network was then trained with multiple simulations,before being able to effectively predict whether or not the stack is perforated,as well as the residual velocity of the projectile in case of perforation.Such a calculation method would significantly accelerate optimisation calculations based on numerical finite element models.However,these models need to be simplified for being used within an engineering design process.Moreover,given the time required to train a neural network,a similar approach with a high-fidelity model does not seem realistic at the moment.Yet,as artificial intelligence and deep learning techniques increasingly invest in finite element simulation,there is no doubt that in a more or less near future these techniques will complement the proposed approaches.
We are here interested in a widely-used solution in land vehicle armouring:a bi-metallic armour made of lightweight alloy used as structural material for the vehicle body and an armour steel plate added on as ballistic protection.This system is indeed simple and not costly.We propose an engineering experiment-simulation correlation methodology linking a finite element computation code to an optimisation module.The methodology in question summarised in Fig.2 includes three steps.

Fig.2.Chart of the methodology adopted in the present work.
· Building of a numerical model and calibration of material constants considering monolithic plates made of armour steel and lightweight alloy facing Lab.Projectiles,
· Verification of the numerical model considering a bi-metal(armour steel-lightweight alloy) protection system against a tungsten carbide (WC) Lab.Projectile,
· Estimation of the residual velocity-initial velocity vres-vicurve for the real bullet with WC core from the one for the WC Lab.Projectile.
The armour steel is the widely-used MARS® 380 and the lightweight alloy is an aluminium alloy of the class 2XXX.The real bullet is the 7.62×51 AP8 ammunition.
The experimental set-ups and configurations as well as the numerical tools are presented in Section 1.The calibration step on monolithic plates is detailed in Section 2 and the verification step on bi-metal protection systems in Section 3.The approach to estimate the shift factor to the vres-vicurve is also presented in the end of Section 3.Concluding remarks are given in Section 4.
2.Experimental and numerical environments
2.1. Experimental environment
All tests are carried out at room temperatures close to 20°C and the projectile impacts the target with a normal incidence.For the gas launcher tests,the target is left free.In the firing range,the target sits on two linear supports.
2.1.1.Impact test facilities
Impact tests with Lab.Projectiles are performed with two of the three 6 m-long single-stage gas launchers of the STIMPACT impact facility available at the Institut Clément Ader (ICA) Lab.,viz.Ø40 and Ø60 gas launchers,see Fig.3 for the STIMPACT facility and Table 1 for the gas launchers’ performances.The projectile initial velocity viis controlled by adjusting the pressure in the launcher tank and measured using a three-way optical barrier placed just after the launcher muzzle,see Fig.4.Two Photron Fastcam SA5 high-speed cameras record at 100 kfps the projectile/target interactions:the front face(FF)and rear face(RF)high-speed cameras allows to have a redundant measurement of vi,and a measurement of the projectile residual velocity vresrespectively.Moreover,a 45°-oriented mirror allows the visualisation of the target rear side by the rear face camera.

Table 1 Performances of the STIMPACT impact facility gas launchers used in the present study.

Fig.3.STIMPACT impact facility at ICA,Toulouse.Left: Ø60 mm (60-mm inner diameter) gas launcher.Centre: Ø120 mm (120-mm inner diameter) gas launcher.Right:Ø40 mm(40-mm inner diameter)gas launcher.Ø40 and Ø60 mm gas launchers are used in this study.
Fig.4.Schematic view of the Ø60 mm launcher set-up.FF: Front Face.RF: Rear face.
Impact tests with real bullets are conducted at the 30-m-long Saint-Étienne (France) firearms proofing facility.The initial projectile velocity viis controlled by adjusting the amount of powder in the ammunition and measured using a Doppler Infinition radar BR-3502.The residual velocity vresis measured with a Photron Fastcam SA5 high-speed camera.The projectile/target rear side on-the-edge interaction is monitored at 100 kfps using this camera.
2.1.2.Projectiles
Lab.Projectiles are sub-calibrated relatively to the inner diameter of the gas launchers tubes.They are thus mounted in expanded polyurethane foam sabots which ensure the guidance of the projectile inside the launcher tube,see Fig.5(a).Sabots have a length of 80 mm for the Ø40 mm launcher and 120 mm for the Ø60 mm launcher.The foam density is adapted to the pressure it faces,viz 320 kg/m3for the Ø40 mm launcher and 545 kg/m3for the Ø60 mm launcher,which results in 30 g and 180 g sabots respectively.To avoid any sabot/target interaction,the impact setup is equipped with a sabot-projectile separation system,see Fig.4.Lab.Projectiles used in this study are of different dimensions and materials (20-mm-diameter high-strength steel/6.35 mm-diameter tungsten carbide) and geometries (conical/flat nose),and are part of the process of calibration and verification of the numerical modelling bricks.Conical-nosed projectiles aim to approach real threats and induce a petaling failure mode in plates made of metals and alloys.Conical-nosed projectiles used in the present study gradually tend to a real bullet (not authorized in the laboratory) in terms of dimensions and material,see Fig.5(b).Flat-nosed projectiles are quite similar to fragments and are intended to estimate the sensitivity of certain materials to plugging often assisted by adiabatic shear banding,see e.g.Refs.[15-17].

Fig.5.Projectiles used in the present study.(a)Top:D20-Steel-Conical projectile mounted in a sabot for Ø40 mm launcher.Bottom:D6.35-WC-Conical projectile mounted in a sabot for Ø40 mm launcher;(b) From left to right: flat-nosed and conical-nosed steel lab projectiles;Flat-nosed and conical-nosed bullet-shaped tungsten carbide projectiles;7.62×51 AP8 bullet.Dimensions are given in Table 2.

Fig.6.Components of a 7.62×51 AP8 bullet.Left: full bullet (jacket,plug and core).Centre: aluminium alloy plug.Right: brass jacket.Dimensions are given in Table 2.
Real bullets used at the Saint-Etienne firearms proofing facility are 7.62×51 AP8(armour-piercing)ammunitions.They consist of a tungsten carbide WC core embedded in an aluminium alloy cap,wrapped in a brass jacket,see Figs.5(b)and 6.The outer diameter of the bullet is 7.83 mm and the mass is 8.3 g.These ammunitions are primarily intended for M60 machine guns and M24 precision rifles.
Projectile characteristics are given in Table 2 and material properties,in terms of Young's modulusE,Poisson ratio ν,bulk modulusK,mass density ρ,acoustic impedanceVickers hardnessHVand compressive strength σyc,in Table 3.Given their higher mass density,acoustic impedance and hardness,projectiles made of tungsten carbide WC are expected to have better ballistic performances than projectiles made of steel.
Table 2 Main characteristics of the projectile used in the present study.
Table 3 Main properties of the projectile materials.
2.1.3.Protections
Widely-used MARS®380(formerly named MARS®190)armour steel is considered here as the reference material.In the present experimental campaign,MARS®380 plates have 8.8-mm-thickness with a specific resistance(ultimate tensile strength divided by mass density)of about 0.15 MPa/(kg·m-3).The aluminium alloy used has a specific resistance close to 0.25 MPa/(kg·m-3).As mentioned in Introduction,aluminium alloys are often used in vehicle armouring,especially as a structural material for the chassis,while add-on armour steel plates are used as ballistic protection.Aluminium thicknesses of 6 mm,8 mm and 12 mm are considered here,see Fig.7.8.8 mm-thick MARS®380 and 8.0 mm-thick aluminium alloy plates are combined in a multi-layered multi-material protection system,without any air gap between them.Single or multi-layer targets are studied,sometimes involving different materials within the same protection system.The main characteristics of the targets are listed in Table 4 and their testing conditions are summarised in Table 5.
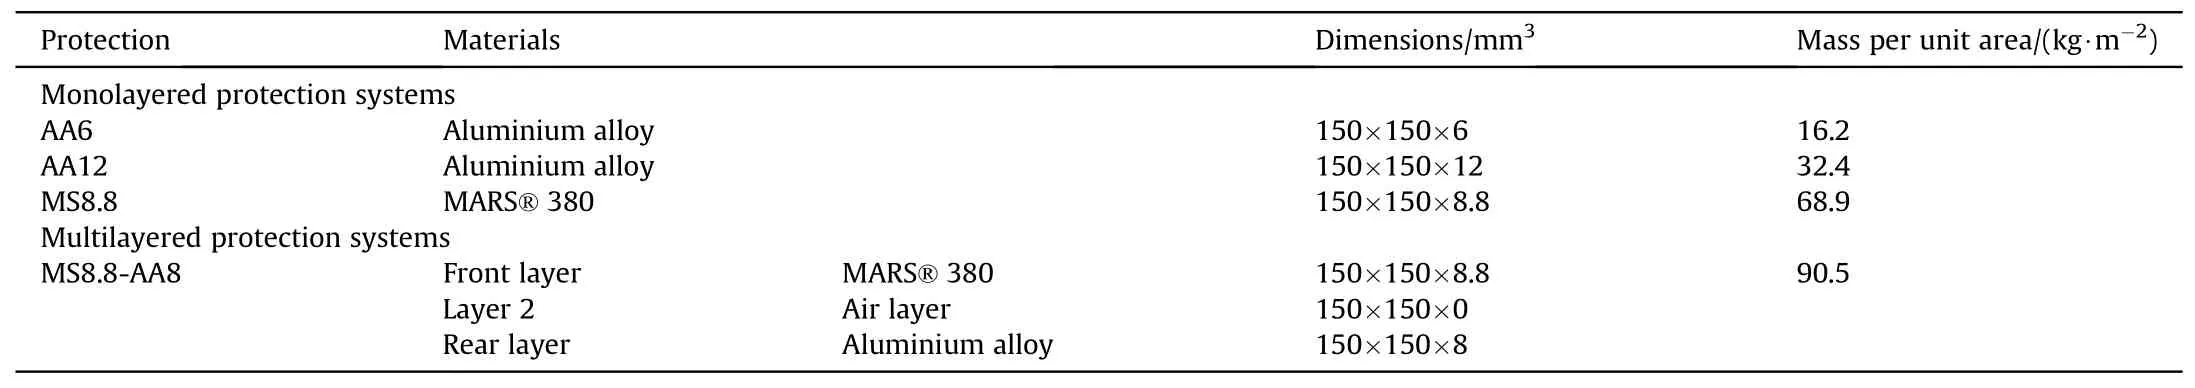
Table 4 Characteristics of the mono-layered and multi-layered protection systems.
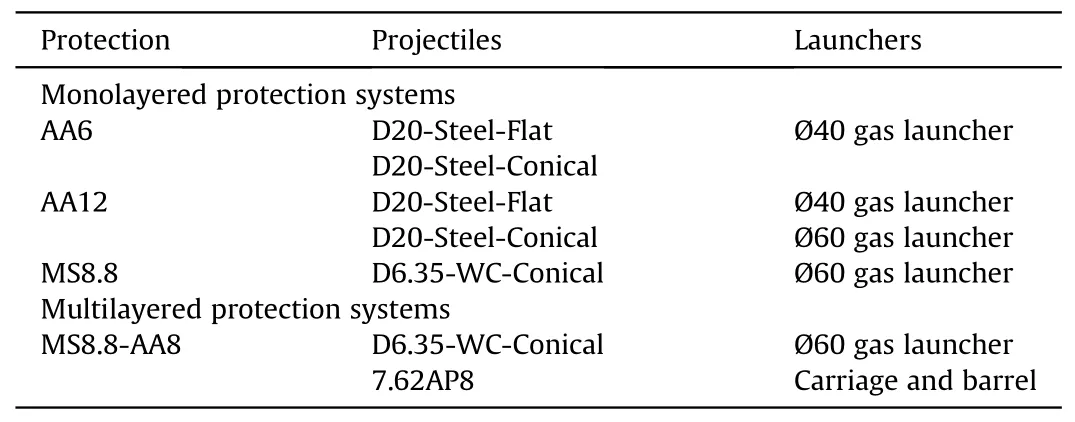
Table 5 Testing conditions of mono-layered and -protection systems.
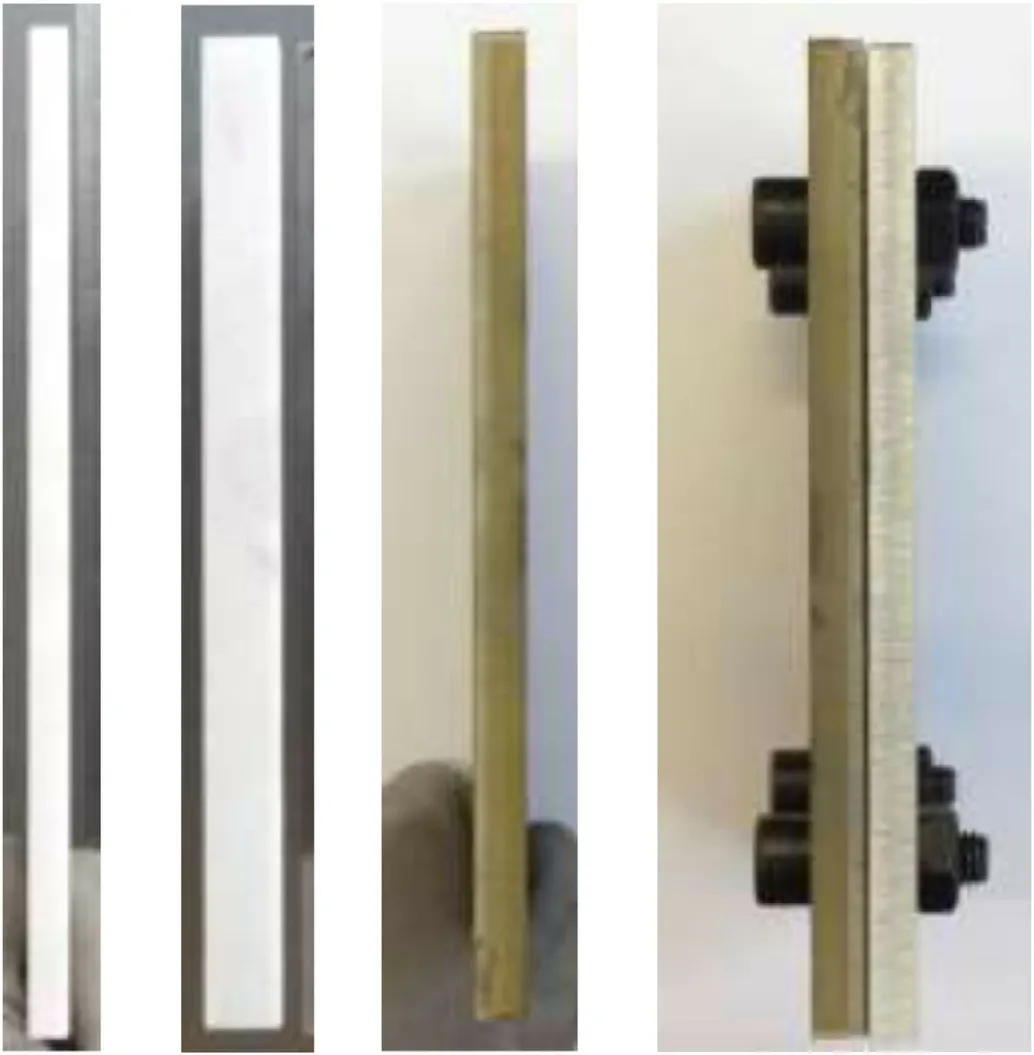
Fig.7.From left to right,side profile pictures of four protection systems AA6,AA12,MS8.8 and MS8.8-AA8.
2.2. Numerical environment
This study is carried out using the commercial finite element code Abaqus/Explicit under Dassault Systèmes license.This software appears regularly in the literature and has been used successfully in many problems of ballistic impacts,see Refs.[19-21].The calibration cycles were managed with the ISIGHT optimisation software natively interfaced with Abaqus and also under Dassault Systèmes license.Finite element simulations are performed on two high-performance computers,namely Olympe operated by CALMIP(CALcul en MIdi-Pyrénées),and Pando operated by ISAE-SUPAERO.
2.2.1.Numerical procedure
2.2.1.1.Initial and boundary value problem solving.Structural elements are solid hexahedral linear elements with 8 nodes and reduced integration (C3D8R).These elements are very present in the References for high-loading rate simulations.The mesh size in the impacted area is 0.5 mm allowing a good compromise between fidelity and computation time.In addition,the arrangement of the elements is deliberately disorganized,see Fig.8,to mitigate the potential/expected dependence of the numerical results on the mesh size and orientation in the damage-induced softening regime.During the failure,the elements are removed,i.e.their stiffness is reduced to zero and the orphan nodes are kept so as not to cause mass loss in the system.Numerical simulations are performed in the configurations specified in Table 6.Additional information,specific to certain simulations,will be given later.
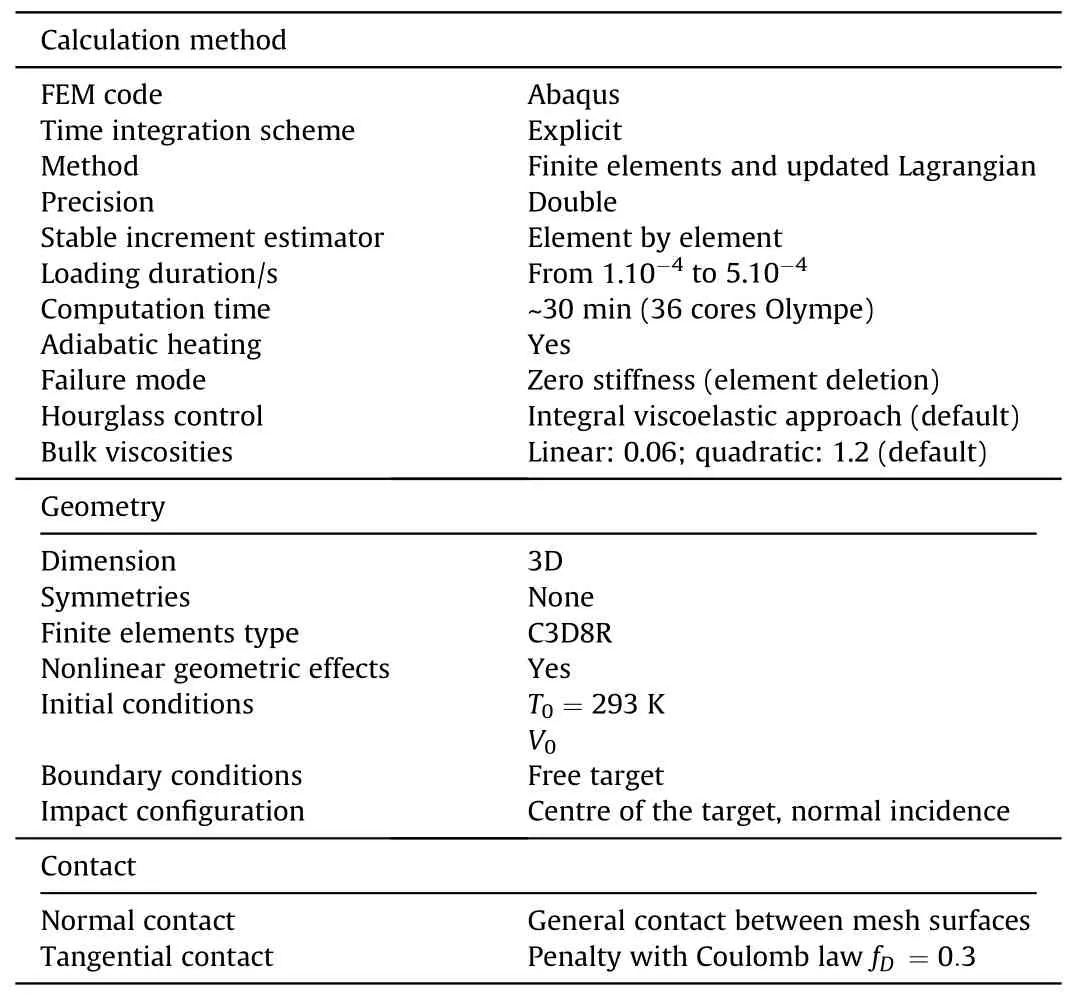
Table 6 Configuration for the numerical simulations.
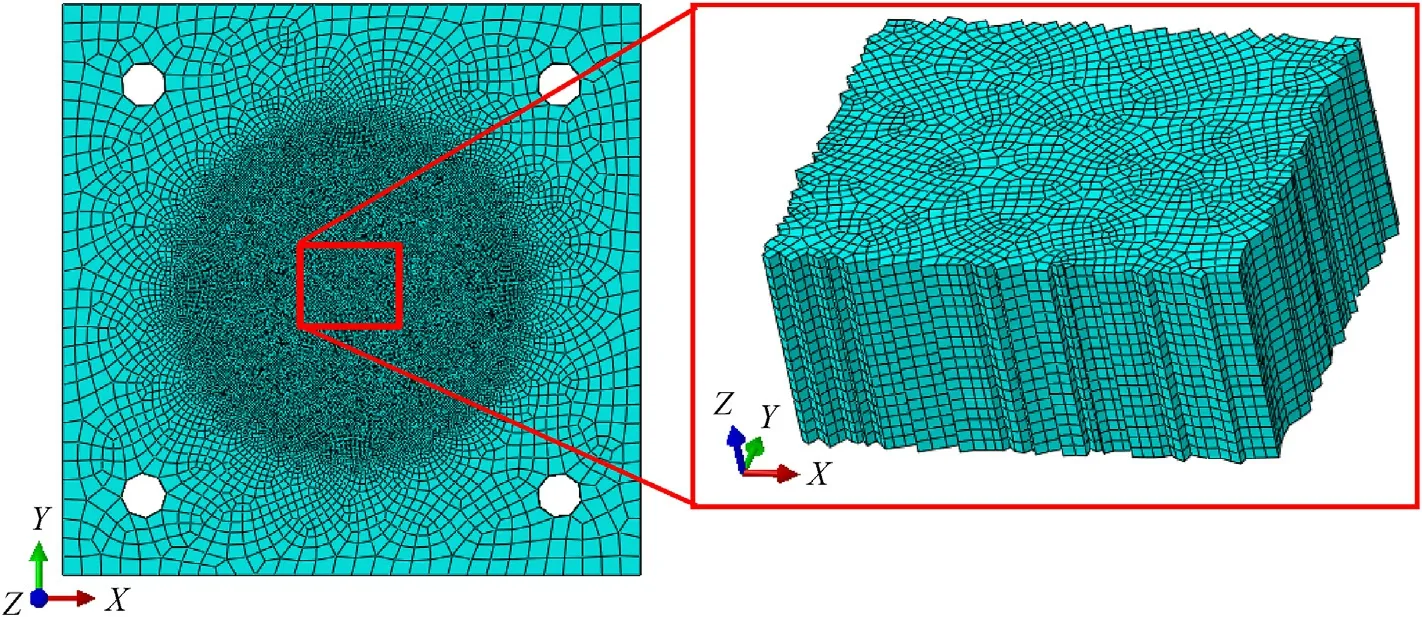
Fig.8.Protection meshing.Left: global view.Right: zoom on the impacted area.
2.2.1.2.Material constant calibration.ISIGHT software allows to build optimisation loops involving various softwares.Fig.9 shows a typical optimisation loop used in this study: finite element simulations are performed using Abaqus,whose results are postprocessed by a Matlab program,then an optimisation algorithm updates the optimisation variables based on the results of the iterations.
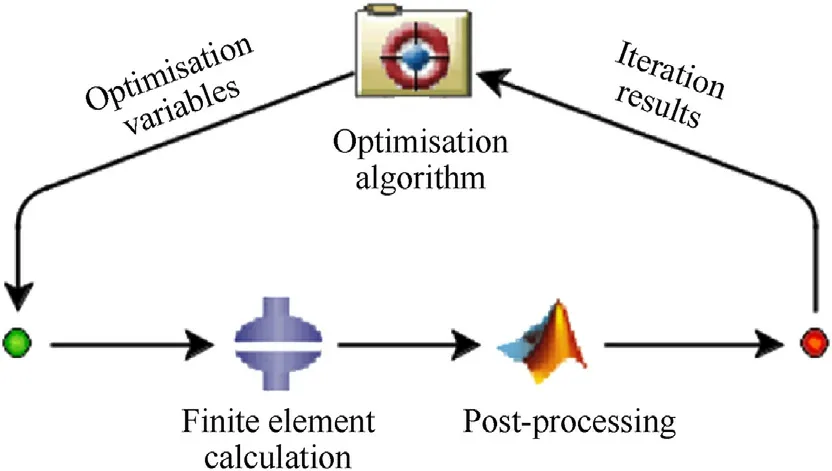
Fig.9.Typical calibration loop using ISIGHT.
Among the proposed algorithms,the Nelder-Mead(or Downhill Simplex) method seems the best suited to optimise a multimaterial armour for ballistic protection [22].
2.3. Constitutive modelling
As no damage was observed on the projectiles after the tests,their behaviour is considered as elastic in numerical simulations.The models selected for the targets must be able to account for pressures of the order of 10 GPa and strain rates of the order of 105s-1.
Linear isotropic elasticity is assumed,yielding
The yield functionfreads
where σyand σvare the rate independent and viscous stresses,Tthe temperature andDthe damage variable.The equivalent plastic strain κ is deduced from
In the elasto-viscoplastic regime,after rearranging Eq.(4),the equivalent stress σeqcan thus be written as
where σyvis the rate dependent yield stress.
Widely-used,empirical,rate and temperature dependent Johnson-Cook model,see Ref.[23],coupled with ductile damage through Kachanov-like effective stress concept as implemented by default in Abaqus,is used in the present work.Indeed,the application of the effective stress concept to Johnson-Cook model done in Abaqus allows to reproduce the ductile damage induced progressive drop in stress before ultimate fracture,see Fig.13.This yields the following expressions for the stresses in Eq.(6).
where(A,B,n,C,˙κ0,Tref,m)are constants andTmthe melting point.Failure occurs as soon asD=Dc(orD=1 by default).
Shock theory-based Mie-Grüneisen equation of state in compression is used to describe the relation between the pressurepand the compression ratio η.
wherepHandeare Hugoniot pressure equation and internal energy,Jthe deformation Jacobian,ρ0andc0the initial mass density and wave celerity,Γ0the Grüneisen coefficient andsa constant.
Empirical complementary evolution laws governing selfheatingand damage rateare implemented by default in Abaqus as follows:
whereCis the specific heat,β the inelastic heat fraction also known as Taylor-Quinney coefficient,see Ref.[24],andthe current plastic displacement and plastic displacement at failure,Gfthe energy release rate at failure,and σy0the yield stress at damage initiation.It is reminded that the lower theGfvalue the more brutal the drop in stress(corresponding to a weakly ductile material),and the higher theGfvalue the smoother the drop in stress (corresponding to a more strongly ductile material).Usually,β is approximated at a constant value β=0.9 [25-27].
Accounting for the delay of damage initiation with respect to plasticity initiation is made possible through a damage onset indicator ω written as
where κJCis the stress triaxiality ratio,rate and temperature dependent failure strain proposed by Johnson-Cook,see Ref.[28],with(d1,d2,d3,d4,d5)constants,and κmaxthe maximum plastic strain at damage initiation.Damage initiates as soon as ω(κI)=1.
The illustration of the approach can be found in Ref.[29].
For confidentiality reason,only the strain hardening related coefficients of the Johnson-Cook model in Eq.(8) are given,see Table 7.

Table 7 Elasticity and strain hardening related coefficients of the Johnson-Cook model for the protection materials.
3.Calibration on monolithic plates
A series of impact tests is carried out on aluminium alloy and MARS 380 plates in view of numerically calibrating some material constants of the constitutive model detailed in subsection 2.3.Both flat-and conical-nosed projectiles are considered in the calibration procedure but a more important weight is given to the conicalnosed projectile as its shape is closer to the real bullet core.The material constant to be identified is the energy release rate at failureGffor the aluminium alloy,see Eq.(11),and the maximum plastic strain at damage initiation κmaxfor the MARS 380,see Eq.(12).The material constants are considered as satisfactory when(i)the ISIGHT identification loop converges and (ii) the experimental and numerical failure modes are similar,i.e.plugging for a flatnosed projectile and petaling for a conical-nosed projectile.The objective is the residual velocity vresfor a given initial velocity vi.
The performance of a ballistic protection system is evaluated through the initial velocity at the ballistic limit named vblthat can be estimated from Lambert-Jonas vres-vicurve,see Ref.[30].
whereaandpare constants depending on the threat/protection system couple.
3.1. Aluminium alloy
The numerical model is calibrated by analysing the results of D20-Steel-Flat/Conical projectile impacts against AA6 single-layer protection.A comparison is made with AA12 single-layer protection,see Fig.7 and Table 4.
3.1.1.Experimental results on AA6
Five tests for each projectile geometry are carried out.The corresponding vres-vipairs are reported on the graph in Fig.10.Given the small number of tests,it is difficult to obtain an accurate estimate of the velocity at the ballistic limit vBL.A conservative approach consists in considering the highest velocity for which the projectile does not perforate the target.Here we then obtain a vBLof 147 m/s for a flat-nosed projectile and 211 m/s for a conical-nosed projectile.

Fig.10.Experimental residual velocity-initial velocity vres -vi curve.AA6 protection against D20-Steel-Flat/Conical.
The differences of velocities (vBLand vres) values between the two types of projectiles are due to the failure modes involved.As expected,see Ref.[31],the flat-nosed projectile generates plugging whereas the conical-nosed projectile generates petaling in the rear face,see Fig.11.The first failure mode is the result of adiabatic shear inducing very localized plastic deformation and thus dissipating little energy.In contrast,petaling implies a more spread and greater plastic deformation,and therefore a stronger dissipation of energy.
3.1.2.Numerical calibration with AA6
The purpose of the calibration step is to determine the coefficientGfof the damage evolution law,see Eq.(11),based on impact tests of D20-Steel-Flat/Conical projectiles against AA6 protection.Only tests with the highest initial velocity are considered to approach future high-velocity tests.Tests at 224 m/s for the D20-Steel-Flat projectile and 230 m/s for the D20-Steel-Conical projectile are accordingly considered.The numerical models contain 467,978 elements and 506,100 nodes for the D20-Steel-Flat projectile,and 393,409 elements and 426,867 nodes for the D20-Steel-Conical projectile.Calculations last respectively 18 and 12 min on 36 Olympe cores.Gfand vresvalues for each iteration of the identification cycles are plotted in Fig.12.It is first noted that the solution converges in both cases after about 15 iterations,corresponding respectively to 4.5 and 3 h of computation.The first values ofGf,denotedGf0,are identified as 4.0 mJ/mm2for the D20-Steel-Flat projectile,and 25.0 mJ/mm2for the D20-Steel-Conical projectile.Gfshould be the material failure energy and should not depend on the projectile.We therefore decide to determine a common value that minimises the differences between experiment and simulation.This common value is found to be 24.0 mJ/mm2with acceptable deviations of -3.06% on the residual velocity for the D20-Steel-Flat projectile and+2.15% on that for the D20-Steel-Conical projectile.Table 8 summarises these results.The uniaxial tension (normalized) stress-strain curve of the calibrated AA is plotted in Fig.13 with a progressive drop in stress along the damage evolution,as expected for AA.
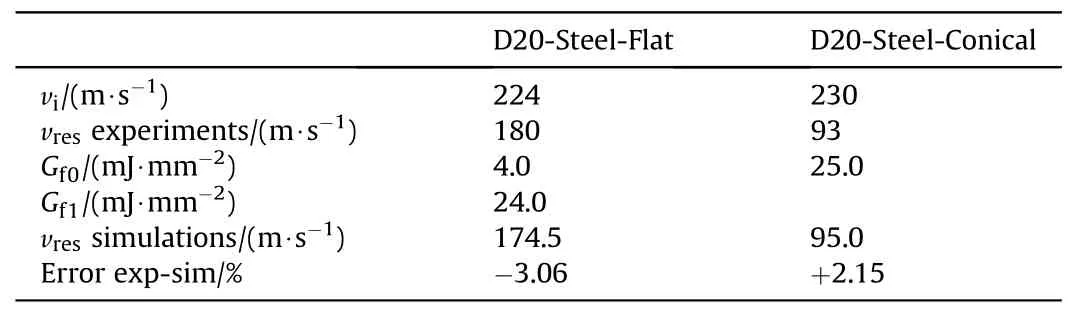
Table 8 Results of the identification of the Gf coefficient based on AA6 protection against D20-Steel-Flat and D20-Steel-Conical projectiles.
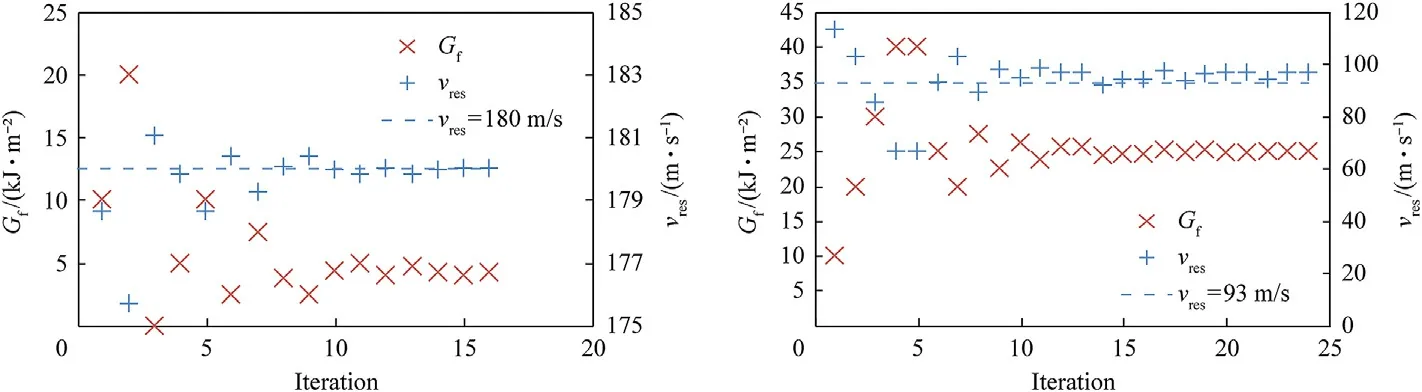
Fig.12.Results of the identification of the Gf parameter for AA6 protection against (a) D20-Steel-Flat projectile and (b) D20-Steel-Conical projectile.

Fig.13.Normalized stress-strain curve obtained from the numerical simulation of the uniaxial tension of a finite element made of calibrated aluminium alloy.
Fig.14 shows that the numerical model succeeds in fairly reproducing the failure modes:the D20-Steel-Flat projectile causes a plugging of the plate with the ejection of a plug(not shown here),and the D20-Steel-Conical projectile tears the material into petals.Although they are not perfectly drawn at the end of the calculation,they are clearly visible during the penetration of the projectile.

Fig.14.Numerical failure modes on the rear face of an AA6 protection against D20-Steel-Flat projectile at 224 m/s(left)and D20-Steel-Conical projectile at 230 m/s(right).Johnson-Cook damage indicator JCCRT (ω(κJC)in Eq.(12)).
3.1.3.AA6 vs AA12 comparison
Some extra impact tests with D20-Steel-Conical projectile against AA12 plate are also carried out.They do not clearly evidence a petaling failure mode.Fig.15 highlights a competition between petaling and plugging,in which the latter prevails.Indeed,there is a small overall deformation of the plate and the ejection of a plug crossed by several cracks.This type of competition has already been documented,for example in Ref.[32].
Fig.15.Experimental failure modes of AA12 protection.Top: plate rear face.Bottom:Ejected plug.Left: after impact of a D20-Steel-Flat projectile at 244 m/s.Right: after impact of a D20-Steel-Conical projectile at 339 m/s.
Fig.16 shows the numerical and experimental results of the impacts on AA6 and AA12 single-layer protections by D20-Steel-Flat/Conical projectiles.Lambert-Jonas curves,see Eq.(13),are plotted to evaluate the vBLof each configuration(coefficients given in Table 9).The differences between experiment and simulation are low (<5%),which is encouraging.The number of tests being quite small (2 for each geometry of AA12),it would be wise to perform more tests to refine the experimental results.Despite these reservations,we consider that the numerical model with aluminium alloy is validated.

Table 9 Lambert-Jonas coefficients for AA12 protection against D20-Steel-Flat/Conical projectiles.

Fig.16.Numerical and experimental residual velocity-initial velocity vres-vi curve.AA12 protection against D20-Steel-Flat/Conical projectiles.Dotted lines are for Lambert-Jonas curves.
3.2. MARS 380
The numerical model is calibrated by analysing the results of D6.35-WC-Conical projectile impacts against 8.8 mm thick MARS®380 monolithic protection (MS8.8),see Table 4.
3.2.1.Experimental results on MS8.8
MS8.8 single-layer protections were impacted by D6.35-WCConical projectiles at velocities comprised between 523 m/s and 714 m/s.Five tests,between 615 m/s and 714 m/s,allowed the projectile to perforate the target.The vres-vipairs are reported on the graph in Fig.17,and the corresponding Lambert-Jonas curve coefficients are indicated in Table 10,see Eq.(13).According to Lambert-Jonas approximation,the vBLof the MS8.8 plate facing a D6.35-WC-Conical projectile is close to 606 m/s.

Table 10 Lambert-Jonas coefficients for MS8.8 protection against D6.35-WC-Conical projectiles.

Fig.17.Experimental residual velocity-initial velocity vres -vi curve.MS8.8 protection against D6.35-WC-Conical projectile.Dotted lines are for Lambert-Jonas curve.
Some projectiles are fragmented when impacting the target,while others remain intact after perforating the target,see Fig.18.This fragmentation might result from a very slight tilt of the projectile before impact.It is noteworthy that the fragmented projectiles have a lower residual velocity than the intact ones,see Fig.17.
Fig.18.D6.35-WC-Conical projectiles,intact and fragmented,after impact against a MS8.8 protection.
Fig.19 shows the impact area of a single-layer MS8.8 protection.One can see material rejection on the front face,and the formation of a few petals on the back face,most of which being ripped off during the perforation of the projectile.There is also the ejection of what looks like a steel plug,see Fig.20,slightly fragmented and cracked.In addition,the part of the plug in contact with the projectile is heavily indented due to the high hardness of the WC projectile,see Table 3.One can thus conclude to a ductile penetration that ends in a competition between plugging and petaling.This type of competition has been described by several authors,for example [32].In particular,front material rejection is specific to low-and medium-hardness materials,see for example Ref.[33]for mild steel.Instead,high-hardness steels have a crater on their front face,see for example Ref.[26].These observations are similar for all perforated targets,whether the projectile is fragmented or remains intact.

Fig.19.Front face (left) and rear face (right) of a MS8.8 protection impacted by a D6.35-WC-Conical at 714 m/s.

Fig.20.Ejected plug by a D6.35-WC-Conical projectile after impact against a MS8.8 protection.
3.2.2.Numerical calibration with MS8.8
Calibration is performed considering vi=714 m/s for which vres=373 m/s.As a reminder,the projectile was found intact after this particular experiment,so it is modelled with elastic behaviour.The numerical model consists of 593,740 elements,628,403 nodes and the calculation takes about 50 min on 36 Olympe cores.
First simulations showed that the Johnson-Cook damage initiation criterion κJCwas not met and that damage was initiated by the threshold ductile criterion κmaxin Eq.(12),see Fig.21.We therefore use the ductile strain κmaxas material calibration variable.Fig.22 shows the iterations and the final results are indicated in Table 11.A value of 0.75 for κmaxis found.

Table 11 Results of the identification of the κmax coefficient based on MS8.8 protection against D6.35-WC-Conical projectile at 714 m/s.

Fig.21.Johnson-Cook JCCRT (ω(κJC)in Eq.(12)) damage initiation criterion (top) and DUCTCRT (ω(κmax)in Eq.(12)) ductile damage initiation criterion (bottom) during the penetration of a D6.35-WC-Conical projectile at 714 m/s in a MS8.8 protection.It can be noticed that the damage is initiated by the second criterion.

Fig.22.Identification of the maximum plastic strain value at damage initiation κmax in Eq.(12) for MARS® 380 armour steel as part of the MS8.8 protection impacted by a 6.35-WC-Conical projectile at 714 m/s and for a targeted residual velocity of 373 m/s.
Fig.23 shows a (normalized) stress-strain curve in uniaxial tension at various temperatures and strain rates.Although these curves appear to be consistent with those obtained by Ref.[26]on high strength steels,the failure strains,close to one,are however much greater than those recorded by Ref.[34]on the MARS®380.

Fig.23.Normalized stress-strain curve obtained from the numerical simulation of the uniaxial tension of a finite element made of calibrated MARS® 380.
4.Verification and validation on multi-component protection systems
The numerical model is validated by demonstrating its ability to adapt to a new situation.For that purpose,the configuration of the impact is modified,for example by moving from a single-layer target to a target composed of two plates,or by reversing the layering order of a multi-material system.The validation criteria are of two types.
-Qualitative:Failure mode;
-Quantitative:Residual velocity of the projectile for a given initial velocity.
4.1. Verification with lab projectiles (D6.35-WC-conical)
The MS8.8-AA8 bi-layered protection,consisting of an 8.8 mm thick MARS®380 front plate and an 8.0 thick aluminium alloy rear plate,assembled by bolting,are impacted by D6.35-WC-Conical projectiles using the Ø60 gas launcher.
4.1.1.Experimental results
Four impact tests were carried out at vicomprised between 718 m/s and 798 m/s,providing three vresreported in Fig.24.According to the latter the vBLis close to 718 m/s.The projectiles that perforated the protection systems remain intact,while the stopped one at vi=718 m/s is fragmented.

Fig.24.Experimental residual velocity-initial velocity vres -vi curve.MS8.8-AA8 protection against D6.35-WC-Conical projectiles.
Fig.25 shows the failure modes of the MS8.8-AA8 protection impacted at 798 m/s.One can observe that the front plate fails mainly by ductile penetration,the material being rejected forward and backward.No petals are visible on this plate,their formation has been disturbed by the rear AA8 plate.The rear plate fails showing a competition between ductile penetration and petaling:small petals are indeed visible on the back face.The front face is slightly depressed due to the deformation of the front MS8.8 plate.
Fig.25.Failure modes of a bi-layered MS8.8-AA8 protection against D6.35-WC-Conical projectile at 798 m/s.
4.1.2.Numerical simulation with lab.Projectiles
The verification of the numerical model of the MS8.8-AA8 protection is carried out by comparing the experimental and numerical results of an impact at 798 m/s.We obtain a numerical residual velocity of 289 m/s against 282 m/s experimentally,that means a difference of 2.5%.Finally,the failure modes in Fig.26 are generally in agreement with the experimental observations in Fig.25: the front plate MS8.8 fails by ductile penetration and the material is pushed back and forth.The AA8 rear plate also fails by ductile penetration,its front face is deformed by the front plate,and the material is pushed back.The deformations and rejection of material are however less marked than in the experimental case,and no petals are visible at the back face of the rear plate.

Fig.26.Simulation of a MS8.8-AA8 target impacted by a D6.35-WC-Conical projectile at 798 m/s.Johnson-Cook JCCRT (ω(κJC)in Eq.(12)) damage initiation criterion (right) and DUCTCRT (ω(κmax)in Eq.(12)) ductile damage initiation criterion (left).
The numerical simulations make it possible to draw a Lambert-Jonas curve,whose coefficients are reported in Table 12,and to determine a vBLof 709 m/s,which represents a deviation of 1.3% compared to the experimental vBLof 718 m/s.Fig.27 shows indeed a good proximity between experimental and numerical results.Yet,the experimental vBLhas to be determined more precisely to be more confident in these results.

Table 12 Lambert-Jonas coefficients for the simulation of MS8.8-AA8 protection against D6.35-WC-Conical projectiles.

Fig.27.Numerical and experimental residual velocity-initial velocity vres-vi curve.MS8.8-AA8 protection against D6.35-WC-Conical projectile.
4.2. Validation with real bullet (7.62×51 AP8)
The ballistic resistance of bi-layered MS8.8-AA8 protections against 7.62AP8 bullets is evaluated.
A MS8.8-AA8 protection system consisting of an 8.8 mm thick MARS®380 armour steel front plate and an 8 mm thick aluminium alloy rear plate is studied.The numerical model has already been verified considering a D6.35-WC-Conical projectile.We see now if it is possible to use the numerical model to reproduce an impact with a 7.62AP8 bullet.
4.2.1.Impact tests with real bullet
Ten tests are carried out,of which six perforate the target.The initial and residual velocities of the projectiles are reported on the graph in Fig.28.A curve has been drawn using the Lambert-Jonas model,whose coefficients are given in Table 13.A vBLof 629 m/s is therefore determined.This value of 629 m/s for a real bullet has to be compared to the experimental value of 718 m/s for a WC projectile,that means a reduction of more than 12% of vBLexplained by the presence of a copper jacket and an aluminium plug in the full bullet .

Table 13 Lambert-Jonas coefficients for MS8.8-AA8 protection against 7.62 ×51 AP8 bullets.
Fig.28.Experimental residual velocity-initial velocity vres -vi curve.MS8.8-AA8 protection against 7.62×51 AP8 bullet.Dotted lines are for Lambert-Jonas curve.
Failure modes in Fig.29 are similar for each test and very close to those observed with D6.35-WC-Conical projectiles.The MS8.8 front layer fails by ductile penetration with material rejection on the front and rear faces.The AA8 rear layer shows a deformation in the direction of the projectile motion,due to the shape of the front layer,as well as ductile penetration.On the back side,one can observe fragments ejections.For both layers,no petals are clearly visible.
Fig.29.Failure modes of a three-layered MS8.8-AA8 protection against 7.62AP8 bullet at 912 m/s.

Fig.30.vres -vi curve for core only and full bullet.LJ stands for Lambert-Jonas.
4.2.2.Correction for the 7.62AP8 bullet
We now search for a method allowing to get the vres-vicurve of a full 7.62 × 51 AP8 bullet,consisting of a core,a jacket and a rear plug,see Fig.6,from the vres-vi(reference)curve of a D6.35-WCConical projectile,mimicking the bullet core.In the following,we puta=acoreonlyandp=pcoreonly,with the corresponding values given in Table 12.
In the aim of reproducing thecurve from thecurve,we assume that
It is noteworthy that,for certain target/projectile configurations and ceteris paribus,the ballistic limit velocity has been numerically shown to be an increasing function of the projectile diameter,see e.g.Ref [35],and a decreasing function of the projectile hardness,see e.g.Ref.[36],with a strong influence of the latter.Consequently,the ballistic limit velocity of the D6.35-WC-Conical projectile is expected to be slightly higher than the(5.2-mm-diameter)7.62×51 AP8 bullet core.This must be accounted for when extrapolating the above applied method to other protection system/projectile configurations.
5.Concluding remarks
The present work presents a methodology coupling a finite element computation code and an optimisation module for the design of land vehicle armouring consisted of lightweight aluminium alloy,as structural material for the vehicle body,and high strength steel plate,added on as ballistic protection.
A first series of tests have been performed using laboratory gas launchers,with steel and tungsten carbide projectiles impacting monolithic aluminium plates,monolithic armour steel plates and bi-metal plates.A second series of tests have been conducted in a firearm proofing facility with 7.62×51 AP8 bullets impacting bimetal plates.Some vres-vicurves have been determined for each situation.
Following an experiment/simulation correlation,a numerical model has been built and calibrated considering monolithic plates and then verified considering a bi-metal protection against tungsten carbide projectile mimicking the core of a 7.62×51 AP8 ammunition.A good accordance between numerical and experimental results have been found.
In addition,an approximation of the vres-vicurve for the full bullet is obtained from the vres-vicurve for the core only.
In conclusion,this experiment-simulation methodology makes it possible to estimate the ballistic performance of a bi-metal protection system from simple laboratory tests.
Works are in progress on tri-material protection systems.
Funding sources
This work was partly supported by the French Association Nationale de la Recherche et de la Technologie,ANRT (Grant No.2018/0299).
Declaration of competing interest
The authors declare that they have no known competing financial interests or personal relationships that could have appeared to influence the work reported in this paper.
Acknowledgements
The authors would like to acknowledge the computational support of the French CALcul en MIdi-Pyrénées (CALMIP).
杂志排行

Defence Technology的其它文章
- High-Velocity Projectile Impact Behaviour of Friction Stir Welded AA7075 Thick Plates
- Influence of liquid bridge force on physical stability during fuel storage and transportation
- Adaptive fuze-warhead coordination method based on BP artificial neural network
- Investigation on the ballistic performance of the aluminum matrix composite armor with ceramic balls reinforcement under high velocity impact
- Dynamic analysis of buried pipeline with and without barrier system subjected to underground detonation
- AI-based small arms firing skill evaluation system in the military domain