Establishment and validation of a nomogram for predicting the risk of liver inflammation in chronic HBV infection
2023-11-20HUANGShengkaiSUNLong
HUANG Sheng-kai, SUN Long
Department of Infectious Disease, the First Affiliated Hospital of Hainan Medical College, Haikou 570102, China
Keywords:
ABSTRACT Objective: To establish a non-invasive quantitative and visual predictive model for assessing the occurrence of significant inflammation in chronic HBV infection, and to present nomogram to validate the efficacy.Methods: A total of 180 patients with chronic HBV infection that were admitted to the Department of Infectious Liver Diseases of the First Affiliated Hospital of Hainan Medical College from January 2019 to December 2021 with informed consent and underwent liver biopsy puncture were selected, and to prevent overfitting of the model, 131 patients and 49 patients were randomly divided into a model group and a validation group according to randomization, to collect the clinic information, serological examination, liver elastography and liver histopathology results.The patients were divided into non-significant inflammation and significant inflammation groups in the modeling group.The R 4.1.1 package and the rms package were used to build the column line graph model, while the Bootstrap method was applied to repeat the sampling 1 000 times for internal and external validation, and the H-L goodness of fit test and ROC curve were used to assess the calibration and discrimination of the column line graph model respectively.Results: A total of 180 patients with chronic HBV infection were included, and 92 patients (51.1%) had significant inflammation.In the modeling set, 67 patients(51.1%) had significant inflammation.In the modeled group, comparison of HBV DNA, PLT, ALT, AST, ALP, GGT, PAB, H.A, PⅢP, CⅣ, L.N, IL-6, LSM and HBeAg for non-significant inflammation and significant inflammation showed statistically significant differences(P<0.05).Nomogram were obtained using stepwise regression analysis to establish a predictive model for the risk of significant inflammation following chronic HBV infection.The χ2 values of the H-L goodness-of-fit test for the modelling and validation groups were 0.279 and 2.098, respectively, corresponding to P values of 0.87 and 0.35, suggesting that the nomogram has good predictive accuracy; the area under the ROC curve of the column line plot predicting the occurrence of significant inflammation after HBV infection for the modelling and validation groups was 0.895 [95%CI(0.843-0.948)] and 0.760 [95%CI(0.622-0.897)], suggesting that the column line plot model has good discrimination.Conclusion: After stepwise regression analysis, it was established that PLT, Ln(HBV-DNA), AST, CⅣ and LSM were more closely associated with the occurrence of significant inflammation after HBV infection, and a visualization of the occurrence of significant inflammation nomogram was established by comprehensive assessment, and the effectiveness was good.
1.Introduction
Hepatitis B virus (HBV) infection is a global health problem, with about 257 million people chronically infected with HBV worldwide and about 887,000 people die from HBV infection globally each year[1].Studies have shown that HBV itself does not directly kill liver cells, and the immune response caused by the virus is the main mechanism leading to liver cell damage and inflammation and necrosis[2], and the inflammation and necrosis of liver cells caused by HBV infection is an important pathophysiological process of disease progression[3].Significant liver inflammation (A 2) is one of the conditions for anti-hepatitis B virus therapy[4-6].Evaluation of liver histology significant liver inflammation and fibrosis is of great significance for antiviral therapy.Liver biopsy is still the gold standard, but its invasive and easy to repeat shortcomings limit its clinical application[7].At present, the column chart is mainly used for liver failure, liver cancer, liver fibrosis and other aspects of HBV infection, while there are few reports on liver inflammation[8, 9].The traditional prediction model can only prove the correlation between relevant indicators and liver inflammation, but cannot elaborate the correlation degree.The column graph is a quantitative prediction graph that displays the results of multi-factor regression analysis on the same plane by a cluster of disjoint line segments[10].With the advantages of being visible, readable, simple and practical, It has received more and more attention and application in the medical field[11].Based on the above factors, this study combined serological indicators with liver elastic imaging to construct a scoring system for significant liver tissue inflammation line chart, aiming to provide a non-invasive liver histological inflammation evaluation model for patients with chronic HBV infection and provide certain reference basis during the treatment against hepatitis B virus.
2.Objects and Methods
2.1 The research object
A total of 180 patients with chronic HBV infection who signed informed consent and underwent liver biopsy biopsy in the Department of Infectious Diseases, The First Affiliated Hospital of Hainan Medical University from January 2019 to December 2021 were retrospectively selected.Inclusion criteria :(1) meet the diagnostic criteria for chronic HBV infection[6]; (2) If he/she has clear consciousness, he/she can sign the informed consent by himself/herself.Exclusion criteria :(1) complicated with diabetes,extrahepatic tumor, cardiovascular disease and other extrahepatic related diseases; (2) autoimmune hepatitis, other hepatitis virus, fatty liver, drug liver damage and other related intrahepatic factors; (3)Patients with incomplete data.To prevent overfitting of the model,patients were divided into modeling group (n=131) and validation group (n=49) by cluster randomization.This study was approved by the Ethics Committee of the First Affiliated Hospital of Hainan Medical University (Ethics Approval No.2020 (Scientific Research)No.(18)).
1.2 The research methods
Significant risk factors of inflammation found in patients with chronic HBV infection were collected in the references[12, 13].Including: (1) Basic data: age and gender of patients were collected and included.(2) Grading results of liver tissue inflammation:All included patients met the criteria for liver biopsy biopsy and had signed informed consent.The ultrasound doctor performed puncture, and the pathology doctor scored the degree of liver inflammation.According to the staging of liver tissue inflammation degree by Metavir scoring system, A 2 was classified as significant inflammation.(3) Hematological test: All patients were found to have fasting venous blood in the morning after hematological test within 48 hours before liver biopsy biopsy.Selected items were Hepatitis B surface antigen (HBsAg), Hepatitis Be antigen (HBeAg)and Hepatitis B core antibody (Hepatitis B core) antibody,HBcAb),HBV DNA quantification, Platelet count (PLT), Liver functions include Alanine aminotransferase (ALT), Aspartate aminotransferase(AST), and Alkaline phosphatase (Alkaline phosphatase)phosphatase (ALP), Gamma-glutamyl transpeptidase (GGT),Albumin (ALB), Globulin (GLB), Prealbumin (PAB), Interleukin-6(IL-6), The four categories of hepatic fibrosis include Hyaluronic Acid (HA), N-terminal peptide of type III procollagen (PIIIP) and type IV Collagen type IV,CIV), Laminin,L.N.(4) Liver stiffness values: Liver stiffness values (LSM) of patients were measured by the sonographer using 2D shear wave elasticity imaging (2D-SWE).
1.3 Statistical processing
R 4.1.1 software was used for statistical analysis.The counting data were expressed as numbers (percentages) using the χ2test.Normal distribution of measurement data was expressed by (±s) and t test was used.Non-conforming distributions were represented by median (interquartile spacing) [M(P25,P75)] and rank-sum test was used.Multivariate analysis used stepwise backward regression analysis.RMS package was used to analyze the regression model and draw the line graph model.Bootstrap method was used to repeat 1 000 samples for internal and external verification.H-l goodness of fit test and ROC curve were used to evaluate the calibration degree and differentiation degree of the line graph model, respectively.The level of bilateral test was α=0.05, and P < 0.05 was considered to be statistically significant.
3.Results
3.1 The general information
A total of 180 patients with chronic HBV infection were included,including 6 cases of A0 (3.3%), 82 cases of A1 (45.6%), 72 cases of A2 (40%), 19 cases of A3 (10.6%), and 1 case of A4 (0.5%).There were 92 cases (51.1%) with significant inflammation (A 2).Randomization was performed in the modeling group of 131 cases and the validation group of 49 cases.
3.2 Comparison of case data between the modeling group and the validation group
The results showed that 67 cases (51.1%) in the modeling group developed significant inflammation.Between the modeling group and the verification group, there were no statistically significant differences in age, gender, and disease progression (whether significant inflammatory reactions occurred), indicating that the two random groups of data were comparable (Table 1).

Tab 1 Evaluation results of the consistency test of case information between the modeling and validation groups
3.3 Comparison of data of patients with non-significant inflammation and significant inflammation in the modeling group
The HBV DNA, ALT, AST, ALB, ALP, PLT, GGT, PAB, IL-6, HA,PIIIP, CIV, L.N, HBeAg and LSM in patients with non-significant and significant inflammation were significantly different (P< 0.05)(Table 2).
3.4 By using stepwise backward regression analysis, the optimal evaluation model of significant inflammation in patients after HBV infection was obtained
With significant inflammation as the dependent variable, Ln(HBVDNA), PLT, ALT, AST, ALB, ALP, GGT, PAB, IL-6, HA, PIIIP, CIV,L.N, HBeAg, LSM as the independent variable, Stepwise backward regression method was used to obtain the optimal influence models as PLT, Ln(HBV-DNA) (Z=3.95, P<0.001), AST (Z=3.04, P=0.002),CIV, LSM (Z=2.50, P=0.012).
3.5 Establishment and verification of a line graph model for risk prediction of significant liver inflammation in chronic HBV infection
3.5.1 Establishment of a line graph model for predicting the risk of significant liver inflammation in chronic HBV infection
A line graph model for risk prediction of significant liver inflammation in chronic HBV infection was established based on stepwise backward regression analysis (Figure 1).According to the plotted column graph model, the right endpoints since PLT were successively 50, 90, 26, 85 and 9 points, with a total score of 260 points.The higher the total score of the line graph model, the higher the risk of significant inflammation.
3.5.2 Validation of the line graph model of the risk prediction model for chronic HBV infection with significant liver inflammation
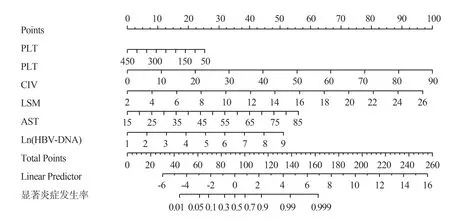
Fig 1 Nomogram model for predicting significant inflammation risk of chronic HBV infection

Tab 2 Comparison of non-significant inflammation and significant inflammation data in the modeled group
The χ2values of the Hosmer-Lemeshoe goodness of fit test (H-L goodness of fit test) for the modeling group and the verification group were 0.279 and 2.098, respectively, and the corresponding P values were 0.87 and 0.35, indicating that the established line graph model had good predictive accuracy (Fig.2, 3).The ROC area under ROC curve for predicting significant liver inflammation after HBV infection in the modeling group and the validation group was 0.895[95%CI (0.843-0.948)] and 0.760[95%CI (0.622-0.897)],respectively, suggesting that the model had good differentiation(Fig4, 5).
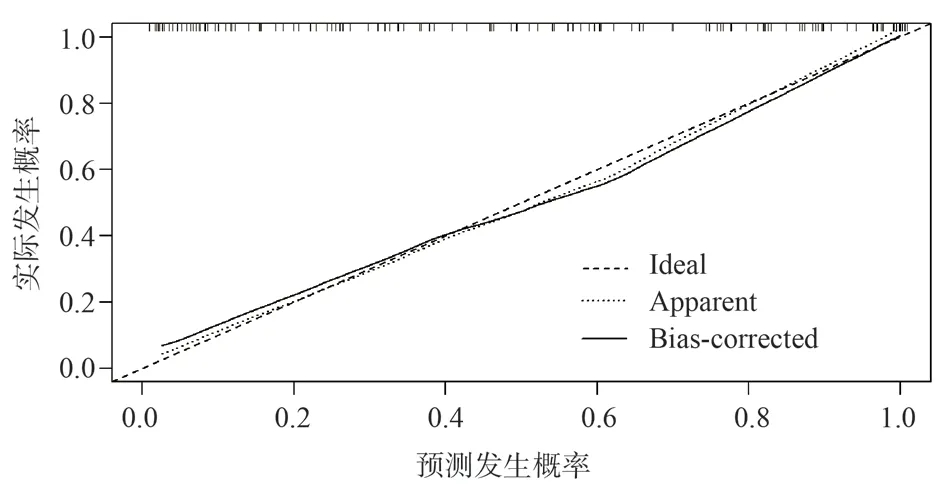
Fig 2 Calibration curve of the risk of developing significant inflammation in HBV infection in modeling set predicted
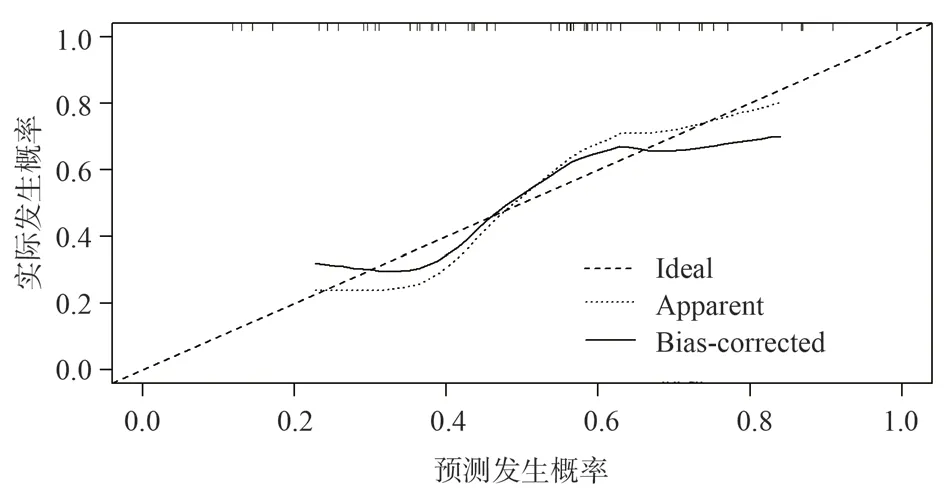
Fig 3 Calibration curve of the risk of developing significant inflammation in HBV infection in validation set predicted

Fig 4 ROC curve of the risk of developing significant inflammation in HBV infection in modeling set predicted
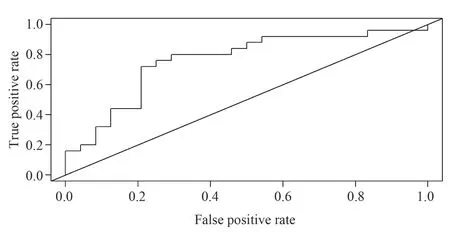
Fig 5 ROC curve of the risk of developing significant inflammation in HBV infection in validation set predicted
4.Discussion
The constant replication and release of Hepatitis B virus (HBV)antigen can cause persistent inflammatory response of hepatocytes,leading to fibrosis of hepatocytes and eventually cirrhosis[14].At present, there are a variety of prediction models for liver fibrosis in China, but there are few prediction models for liver inflammation.Long-term and repeated liver cell injury and inflammatory necrosis are the key to the development of liver fibrosis.In clinical practice,ALT, AST and other indicators are often used to evaluate the degree of liver inflammation, but the actual level of liver inflammation is still unclear in some patients, and liver biopsy is needed for further diagnosis[1,15-17].10%-49% of patients with chronic HBV infection have obvious pathological changes of hepatocyte inflammation and necrosis and liver fibrosis[18], which is inconsistent with the natural course of chronic hepatitis B.The true degree of liver inflammation in such patients and whether antiviral therapy should be used has gradually become a hot issue.
This study evaluated the degree of liver inflammation in patients with chronic HBV infection in a non-invasive way by constructing a line graph model, and screened out 5 significant risk factors for liver injury, including PLT, HBV DNA, AST, CIV, and LSM, among which some studies showed that PLT was involved in liver injury through interaction with leukocytes and macrophages[19].Moreover,PLT reduction is a hallmark feature of chronic liver disease and cirrhosis[20].It can be seen from the column graph model constructed in this study that, with the decrease of PTL, the score assigned by PTL increases, which is consistent with the research results of Kondo et al[21].CIV is derived from the degradation of basement membrane and is an indicator of collagen degradation.The level of CIV increases when liver lesions occur and increases with the severity of the disease[22].The recurring liver cell damage and inflammation and necrosis in patients with chronic HBV infection will eventually develop into liver fibrosis or even cirrhosis.CIV is closely related to the degree of liver fibrosis.Therefore, the four indexes of liver fibrosis were included in the construction of the column graph model in this study.This is consistent with the report of Huang Liping et al., which showed the correlation between increased CIV level and liver inflammatory activity[23].It has been reported that the increased levels of HBV DNA and AST are correlated with the degree of liver inflammation[16,24].This study shows that the probability of liver histological change increases with the increased levels of HBVDNA and AST, so HBV DNA and AST are risk factors for liver inflammation.Previous studies have shown that LSM is significantly correlated with the fibrosis stage of patients with chronic liver disease[1,25-27].The results of this study show that the higher the LSM value is, the higher the probability of significant inflammation of liver tissue, indicating that LSM is an independent risk factor for predicting significant inflammation of liver tissue.Although the actual diagnostic value of LSM is affected by various factors such as cholestasis and severe steatosis[1,28], LSM is the result of in vitro detection.In this study, a line graph model was built based on the combined serological results of LSM to improve the accuracy of single serological or single LSM detection.
In order to obtain a good prediction effect, patients with chronic HBV infection were divided into a modeling group and a validation group.Based on the risk factors screened by the modeling group, a risk prediction column graph model of significant liver inflammation in chronic HBV infection was constructed.At the same time, this model reflected the importance of various risk factors by means of visual scores, specifically quantified the risk level of significant liver inflammation, and focused more on clinical individual evaluation.This study evaluated and verified the predictive efficiency of the column graph model.The results showed that the χ2values of H-L goodness of fit test for the modeling group and the validation group were 0.279 (P=0.87) and 2.098 (P=0.35), respectively.The areas under the curve were 0.895[95%CI (0.843-0.948)] and 0.760[95%CI(0.622-0.897)], respectively, which indicated that the model had good prediction efficiency.A patient’s risk of significant liver inflammation can be dynamically assessed based on the risk factors in the model, and inflammation can be interfered with early.
In summary, it was established that PLT, HBV DNA, AST, CIV,and LSM were more closely related to significant liver inflammation after HBV infection after progressive backward regression analysis.The column graph model constructed by the above risk factors can effectively evaluate and quantify the risk of significant liver inflammation after HBV infection.Shortcomings of this study:(1) The sample size included in this study were all from the same hospital, and the multi-center study was not conducted, which resulted in selection bias; (2) The evaluation results of the degree of liver inflammation were influenced by the puncture samples and the subjective bias of the pathologist to review the film.Therefore, this model needs to be further studied and perfected.
Author’s contribution:
Huang Sheng-kai conceived and designed the article, collected and sorted out data, and wrote the paper; Sun Long was responsible for the quality control and review of the article, and was responsible for the overall responsibility of the article.
There is no conflict of interest in this article.
杂志排行
Journal of Hainan Medical College的其它文章
- Mechanism of FXR alleviating the liver fibrosis by regulating perilipin 5
- Study on the mechanism of effect of Daodi Tongguan Decoction on rats with premature ovarian failure
- Correlation between Nrf2‑GPX4 signaling pathway and patients with coronary heart disease
- Clinical study of different modes of repetitive transcranial magnetic stimulation in the treatment of post‑stroke executive dysfunction
- Meta-analysis of the efficacy and safety of extended right liver transplantation versus whole liver transplantation
- Quality of life of hospitalized patients after lung cancer operation and analysis of influencing factors
