A Multi-scale Smart Fault Diagnosis Model Based on Waveform Length and Autoregressive Analysis for PV System Maintenance Strategies*
2023-10-28uhamadohd
. ,uhamad ohd
(1.Department of Electrical Engineering,Universiti Malaysia Pahang,Pekan 26600,Malaysia;2.Faculty of Electrical and Electronics Engineering Technology,Universiti Malaysia Pahang,Pekan 26600,Malaysia)
Abstract: Nonlinear photovoltaic (PV) output is greatly affected by the nonuniform distribution of daily irradiance,preventing conventional protection devices from reliably detecting faults.Smart fault diagnosis and good maintenance systems are essential for optimizing the overall productivity of a PV system and improving its life cycle.Hence,a multiscale smart fault diagnosis model for improved PV system maintenance strategies is proposed.This study focuses on diagnosing permanent faults (open-circuit faults,ground faults,and line-line faults) and temporary faults (partial shading) in PV arrays,using the random forest algorithm to conduct time-series analysis of waveform length and autoregression (RF-WLAR) as the main features,with 10-fold cross-validation using Matlab/Simulink.The actual irradiance data at 5.86 °N and 102.03 °E were used as inputs to produce simulated data that closely matched the on-site PV output data.Fault data from the maintenance database of a 2 MW PV power plant in Pasir Mas Kelantan,Malaysia,were used for field testing to verify the developed model.The RF-WLAR model achieved an average fault-type classification accuracy of 98 %,with 100% accuracy in classifying partial shading and line-line faults.
Keywords: Autoregressive,PV fault diagnosis,supervised machine learning,simulation,waveform length
1 Introduction
Solar photovoltaic (PV) systems have undergone extensive growth,contributing to global power generation[1].PV output characteristics are nonlinear,which has caused difficulties for conventional protection devices,such as fuses and circuit breakers,in accurately detecting and isolating faulty circuits.Therefore,smart PV fault detection and diagnosis techniques are required[2-3].In general,potential faults on the DC and AC sides of a PV system can be classified based on their temporal characteristics,as permanent,intermittent,or incipient[4]; some examples are provided in Fig.1.Once they have occurred,permanent faults such as line-line,open-circuit,and ground faults,will persist until rectified.In contrast,intermittent faults are temporary and include shading due to leaves,bird droppings,and environmental effects such as dust pollution and snow accumulation.Finally,incipient faults can occur through PV cell degradation and corrosion.This type of fault leads to permanent faults if left untreated.
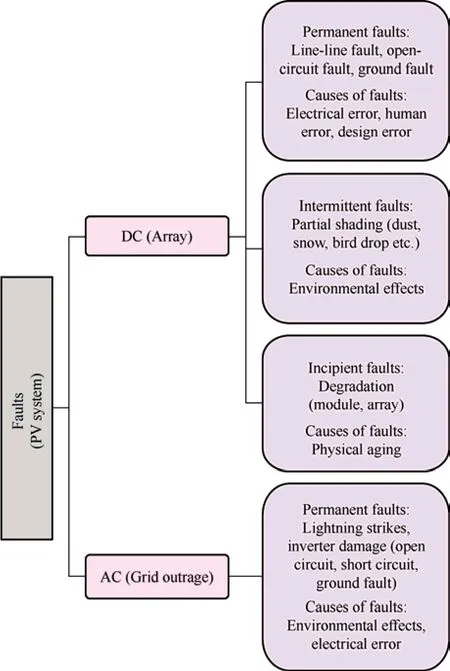
Fig.1 Main categories of potential faults in PV systems
Recently,several studies have using machine learning (ML) techniques to detect and diagnose faults in PV systems.ML has become the most favorable approach,exploiting artificial intelligence (AI) with three main types of algorithms: unsupervised,semi-supervised,and supervised.Unsupervised ML algorithms are trained on unlabeled datasets.They are primarily used for clustering and prediction tasks,such as those conducted by Dhimish et al.[5],wherein PV fault-detection algorithms were developed based on a radial basis function and fuzzy logic (FL).The proposed algorithm was verified using fault data from a small-scale 1.1 kWp PV system.The results showed a maximum accuracy of 92% for detecting partial shading and faulty module(s).A study by Ref.[6] used FL to compare the threshold method for classifying partial shading,bypass diodes,short circuits,and open-circuit conditions in PV arrays.The simulation results demonstrate that the FL algorithm can perform classification more efficiently than the thresholding method.
In contrast,the semi-supervised ML algorithm uses both labelled and unlabeled data for training and testing.Very few studies have applied this algorithm to online PV fault diagnosis; the algorithm learns from decision-making mistakes,as demonstrated by Ref.[7],in which a PV fault-identification technique was developed with a semi-supervised ML graph model and a simple calculation,achieving moderate accuracy.Finally,the supervised ML algorithm is trained and tested on fully labelled data.Supervised ML algorithms are more widely used than semi-supervised and unsupervised ML algorithms in developing methods/models for PV fault detection and diagnosis.K-nearest neighbor (KNN),support vector machine(SVM),and random forest (RF) algorithms are examples of supervised ML algorithms that are commonly used for regression and classification[8].
KNN is a simple supervised ML algorithm.Among the example studies,Ref.[9] proposed a PV fault diagnosis model based on the KNN algorithm at the string level.They validated their results using experimental data and obtained classification results for line-line,partial shading,and open-circuit faults with a high accuracy of 98.70%.Ref.[10] established a fault diagnosis model based on an improved KNN algorithm to detect open-circuit,shading,and short-circuit conditions in PV strings,for further investigation.An appropriate K value and distance function were selected to improve the KNN algorithm.The proposed model was then validated using measured data from a PV power station and was found to outperform the traditional KNN algorithm in terms of classification accuracy and speed.
SVM is a widely used supervised ML algorithm.Ref.[11] developed a fault diagnosis method to detect short-circuit,open-circuit,and lack-of-irradiation faults in PV arrays.Fault data were generated using a small-scale PV array model.For comparison,the proposed algorithms were trained and tested using a BP neural network algorithm.The SVM outperformed the BP neural network in terms of fault diagnosis accuracy and generalization capability.Furthermore,Ref.[12] applied SVM to detect abnormal conditions in a PV system using a regression model.For validation,the study used real data from a PV system and could successfully distinguish between normal and abnormal conditions in that PV system.
Moreover,the RF algorithm is the most popular and frequently used algorithm in the examined studies.Ref.[13] developed a model to detect and classify open-circuit faults,line-line faults,degradation,and partial shading.The developed model uses a simple calculation system suitable for real-time applications.Simulations were performed using Matlab/Simulink.A 2 kW small-scale grid-connected PV system was built to generate data and highly accurate fault detection and diagnosis was achieved.In addition,the researchers used real publicly available data for validation and achieved high accuracy with low computation time.However,owing to the relative daily changes in solar irradiance,which is affected by varying meteorological conditions and varies over time,the PV output exhibits nonlinear characteristics.The presence of significant noise in real data can also reduce diagnostic accuracy.Thus,an appropriate time-series feature extraction method must be chosen.
Previous studies have investigated feature extraction based on time-series analyses.Ref.[14] presented a novel technique involving two feature extraction methods using the electromyography (EMG) signal for biomedical applications.They created an enhanced waveform length (WL),enhanced mean absolute value,modified version of the WL,and mean absolute value.The obtained results featured improved prediction accuracy for EMG signal classification.The EMG signal is a biomedical motion that measures the electrical current generated in a muscle during contraction.The EMG signal shares similar waveform characteristics with the output generated by the PV system.The EMG signal has the similar waveforms characteristics as the PV output.Another interesting time-series analysis used the feature of autoregressive(AR) analysis models for financial and business applications[15].The model was developed based on a statistical model.AR is commonly used in operations research to model simulation outputs,and in supply chain management to forecast demand.
Recent studies compared the proposed algorithm with other benchmark algorithms.Ref.[16] developed a hybrid approach for monitoring the normal and faulty states of grid-connected PV systems,which feature complex time-correlated data.The proposed method combines kernel PCA ensemble learning techniques and data-driven methods enhanced by dataset size reduction,as was applied in experiments with PV emulators.The results were then compared with those obtained from SVM,KNN,and a decision tree,which proved that the ensemble ML paradigm is an effective and reliable model with higher accuracy than a single ML.Additionally,this method has been proven to reduce false alarms and missed detection rates.Another interesting study[17]developed an algorithm model and tested it on small-,medium-,and large-scale PV array models.The training and testing algorithm used KNN,SVM,and RF to identify the best algorithm.This study demonstrated that RF produced the most accurate fault detection and diagnosis.Nevertheless,a limitation of this study is that it did not verify the reliability of the proposed model using actual PV data.
Maintenance can generally be classified into corrective,predictive,and preventive maintenance,which each have different roles and purposes.Corrective maintenance is a major maintenance task that is performed after a failure is detected.Predictive maintenance is conducted to reduce future failures.In contrast,preventative maintenance is performed for periodically at scheduled intervals[4,18].Although smart PV fault detection and diagnosis are essential to a PV system,a good maintenance scheme is also required to optimize overall productivity and improve the life cycle of the system.Hence,this paper proposes multiscale smart fault diagnosis (MSFD),which employs the RF-WLAR algorithm,for better PV system maintenance strategies.The RF-WLAR algorithm was developed based on the RF-supervised ML algorithm and employs a time-series analysis using waveform length and autoregressive as the main features.
The proposed MSFD model can serve as a reference for corrective maintenance work,by providing various combinations of instructions and corrective actions for permanent,intermittent,and incipient faults.This MSFD method can also detect hidden faults that conventional protection devices cannot detect,which is beneficial for preventive maintenance work and can reduce the likelihood of future failures,improving predictive maintenance work.Furthermore,this study focuses on diagnosing and classifying permanent and temporary faults on the DC side of a system.The main contributions of this study are as follows.
(1) The developed PV array model is simple but feasible for application in PV systems of various scales.
(2) The proposed model was developed using Matlab/Simulink based on a time-series analysis using waveform length and autoregressive features.Actual irradiance data were used as inputs to produce simulated data that closely matched the onsite PV output data.
(3) Field testing was performed using fault data retrieved from the PV maintenance database for verification,which can benefit corrective,predictive,and preventive maintenance work.
The remainder of this paper is organized as follows.Section 2 describes the methodology for the proposed multi-scale smart fault diagnosis (MSFD) model,including data preparation,training and testing,and field-testing procedure.Section 3 presents and discusses the results.In Section 4,the proposed RF-WLAR algorithm is compared with other ML algorithms for reliability verification.Finally,Section 5 provides the conclusions,limitations,and recommendations for future work.
2 Methodology of the MSFD model
The proposed MSFD procedure consists of four main stages: ① Multi-scale PV array modeling (permanent and temporary fault models); ② Data preparation(real irradiance,simulated and actual fault data);③ Training and testing of the proposed algorithm procedure; ④ Field testing procedure.
2.1 Multi-scale PV array modeling
2.1.1 Series and parallel configuration of PV array model
A solar cell of the one-diode model (ODM) was chosen to develop the PV cell and subsequently form the PV array models in this study.The ODM is most commonly selected by researchers because of its good accuracy under steady-state conditions[19].The ODM with five parameters was used in this study (Fig.2).
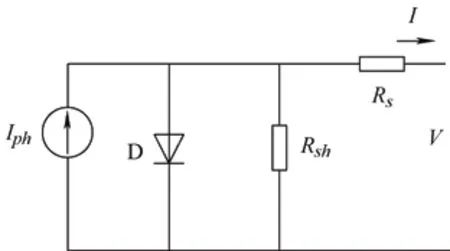
Fig.2 A one-diode model with five parameters
The output current I (A) of the PV cell is formulated using Kirchhoff’s law as given in Eq.(1),where ILrepresents the light-generated current,IDrepresents the diode current,and Ishrepresents the shunt resistance current.
In the PV array,PV panels/modules are connected in parallel,series,or a combination of parallel and series configurations to produce the desired output.This work used Matlab/Simulink to develop a scalable PV array model comprising an arrangement of PV modules (m ×n).This configuration can be employed for various scales of PV systems.As shown in Fig.3,each module in a string has the same current (I),where the n string in parallel will produce a larger short-circuit current (ISC)when the value of the n string increases(n ×ISC).Meanwhile,each string shares the same voltage(V) when the modules are connected in series.A higher open circuit voltage(VOC)will be produced as the value of the m module increases(m ×VOC).
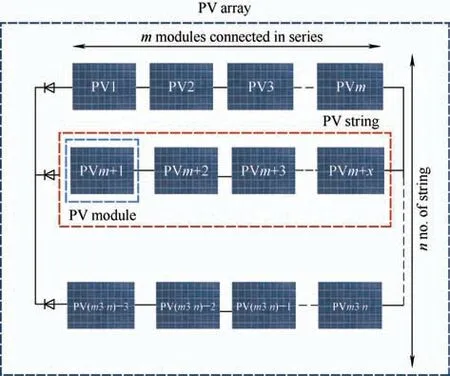
Fig.3 PV array connected in (m ×n) arrangement
The power output(PPVA) is calculated using the following equation
In this study,a small-scale 10 kW PV array model was developed as a base model using the input parameters from the PV module manufacturer’s datasheet,Panasonic VBMS250AE04 (Tab.1).The 10 kW PV array model was simulated and tested under standard test conditions (irradiance,G=1 000 W/m2and module temperatureT=25 ˚C).
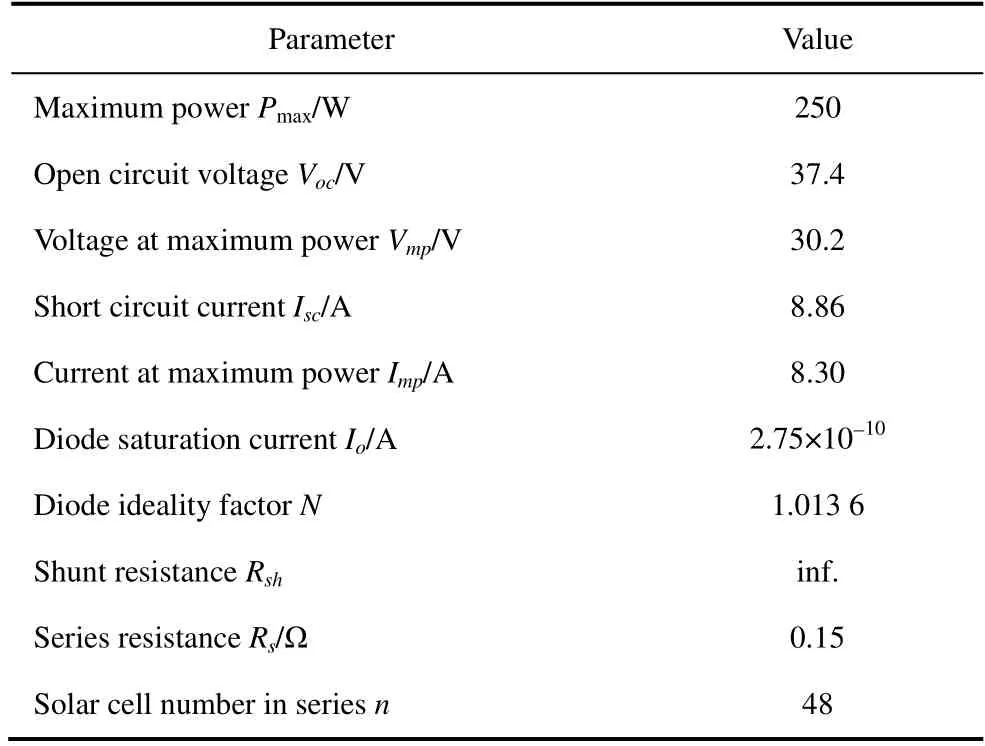
Tab.1 Panasonic VBMS250AE04 PV module parameters
2.1.2 Validation of the proposed PV array model
The simulated results of the maximum power (Pmax),VOC,andISCwere compared with the Panasonic VBMS250AE04 datasheet for model validation.
Fig.4 shows theI-VandP-Vcurves of data simulated for the 10 kW PV array.The simulated results matched the values of the Panasonic VBMS250AE04 datasheet,as shown in Tab.2.Therefore,it can be concluded that the PV array model developed in this study is sufficiently accurate to allow its performance under normal and faulty conditions to be predicted.
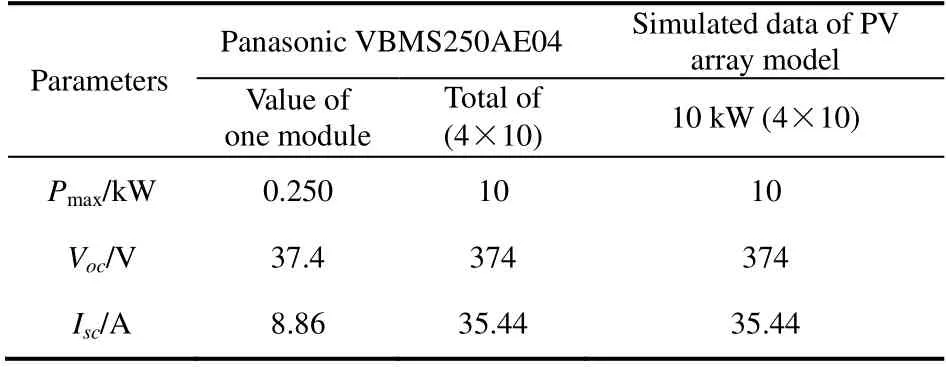
Tab.2 Comparison of simulated results with values from PV module datasheet
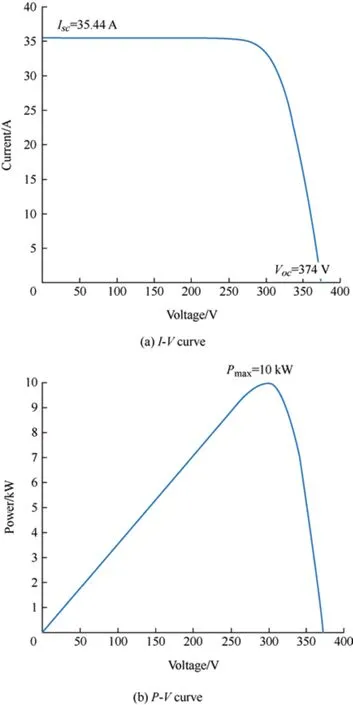
Fig.4 I-V and P-V curves of 10-kW PV array model
2.2 Data preparation
2.2.1 Simulated data
The simulated data for the PV array fault models(Fig.5) were produced using Matlab/Simulink,modified from a previous study[20]as follows.
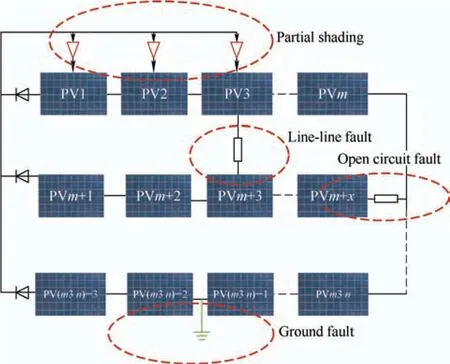
Fig.5 Brief description of simulated(m ×n) configuration PV array faults model
(1) Permanent fault model.A line-line fault (LLF)was developed and simulated by short-circuiting two potential points in the PV array string.An open-circuit fault (OCF) was developed and simulated by adding series resistance to a PV string and setting it to infinity.A ground fault (GF) was developed and simulated by extending the LLF model and connecting it to the ground to generate a fault current.
(2) Temporary fault model.Mismatch/Partial shading was developed and simulated by connecting the PS Gain(s) to the PV module(s) and setting them to less than 1 to reduce the irradiance value received by the module(s).
Subsequently,using Eq.(2),2 MW PV array models(PS,OCF,GF,and LLF) were developed.The actual irradiance data at the coordinates (5.86 °N,102.03 °E)were fed as the input,and 300 simulated data points were generated.Through an exploratory data analysis process,80% of the data was used for training and 20% for testing.
2.2.2 Actual data
The actual data (irradiance and PV power output) used in this study were obtained from the KMSB Solar PV plant,located in Pasir Mas Kelantan,Malaysia,between 5.86° North and 102.03° East,as shown in Fig.6.Irradiance data between 7 am to 4 pm for the sunny months of April to August were obtained from the National Solar Radiation Data Base (NSRDB),a trusted website of the National Renewable Energy Laboratory (NREL)[21].
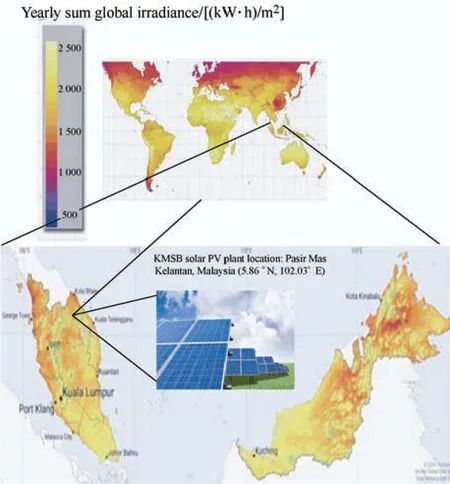
Fig.6 Map of the KMSB solar PV plant site location within Malaysia
Faulty PV array output power (PPVA) data samples were retrieved from the KMSB maintenance database.Fig.7 compares the normal and faultyPPVAdata.
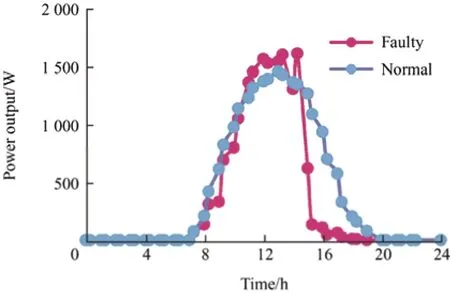
Fig.7 Comparison of normal and faulty data
2.3 Algorithm training and testing procedure
RF ML has been used in several studies such as Refs.[13,17,22].RF ML builds decision trees on different samples and takes the majority votes for classification.In addition,it can handle datasets containing continuous and categorical variables,such as PV output data.In this study,an MSFD model using RF-WLAR was developed,which is an RF ML that works with 10-fold cross-validation and extracted main-feature including waveform length,and autoregression.In the 10-fold cross-validation,the data were divided equally into ten folds,where each fold was used for successive tests,and the remaining nine folds were used to train the classifier.Finally,the mean accuracy obtained from 10 folds was recorded.
Feature extraction is an important element of algorithm training and testing,to ensure that the proposed RF-WLAR algorithm performs well and produces good results.The waveform length is the most frequently used feature in EMG signals[14].PV output has nonlinear characteristics owing to varying meteorological conditions and changing solar irradiance; therefore,the waveform length was utilized in the training and testing of the algorithm in this study.Waveform length (WL) can be defined as[14]
wherexiis the value of thePPVA,andnis the total of thePPVA.
The autoregressive model was investigated in a previous study which involved a time-series analysis[15].Because the input data of the RF-WLAR algorithm are time-series irradiance data,the autoregressive feature was employed in the algorithm training and testing process of this study.Autoregression (AR) can be expressed as[15]
whereXtis the value of thePPVA,nis the total of thePPVA,φ1...φnare parameters of the model,andεtis white noise.
The power maximum (Pmax),mean (M),and standard deviation (STD) were also used in this study,as indicators of the accuracy of PV system fault detection and diagnosis[23-25].The mathematical formulations ofMandSTDare expressed in Eqs.(5)and (6).
wherexiis the value of thePPVA,andnis the total of thePPVA.
The main steps and architecture of MSFD using the RF-WLAR algorithm are listed in Tab.3 and Fig.8,respectively.
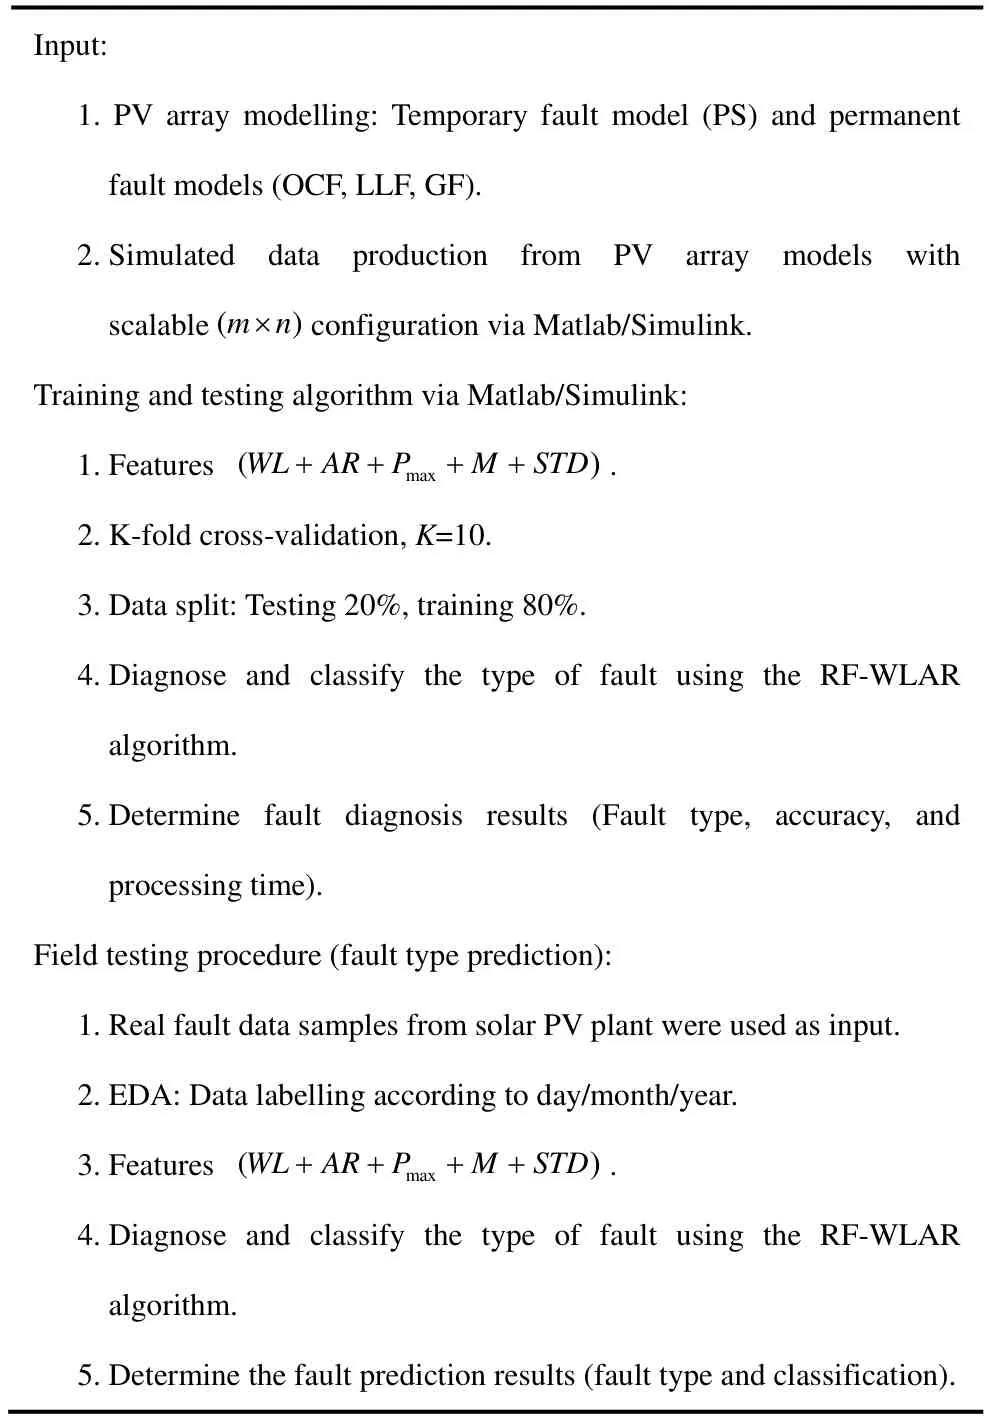
Tab.3 Main steps of the MSFD model procedure
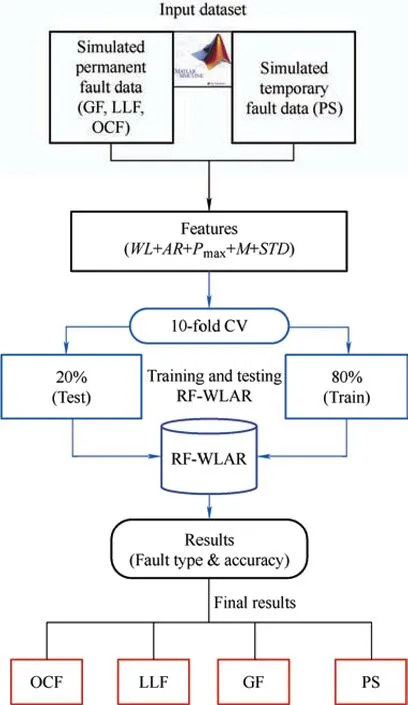
Fig.8 Architecture of MSFD using RF-WLAR algorithm
2.4 Field testing procedure
This field-testing work focused on predicting the fault type in data samples from the KMSB 2 MW solar PV plant.Generally,PV plants feature an intelligent energy management system (PVEMS) to monitor and integrate energy-efficient PV power generation.The PVEMS provides information such as real-time PV power and energy generated,daily and cumulative yield,and related environmental benefits such as the amount of CO2avoided.
In Malaysia,sunrise and sunset do not vary significantly throughout the year because of Malaysia’s proximity to the equator.Sunlight was received by the KMSB from 7 am to 7 pm,as shown by the PVEMS.During the operation of the solar PV plant from 7 am to 7 pm every day,the PVEMS monitors and shows whether the PV plant is operating normally or is experiencing faulty conditions,such as those shown in Fig.9 which shows a faulty state beginning at 10 am on November 2,2022.Hence,the MSFD is required to diagnose faults and facilitate fast corrective work and return the PV plant to normal operation.
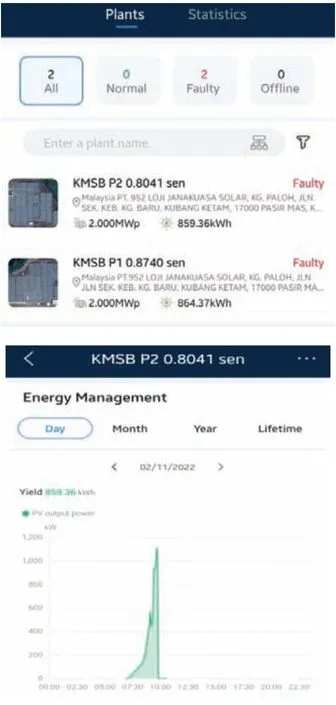
Fig.9 Operating status of solar PV energy management system
Five samples of fault data were taken each month(April to August),yielding a total of 25 datapoints,and were labelled day/month/year.These fault data were used in this field-testing process.The architecture of the MSFD using the RF-WLAR algorithm for the field-testing procedure is shown in Fig.10.
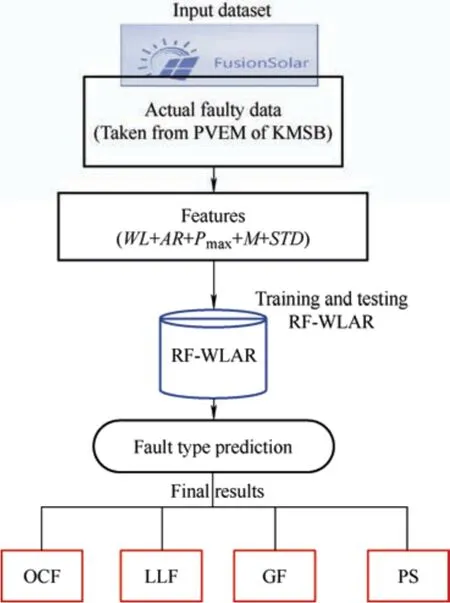
Fig.10 MSFD procedure using RF-WLAR algorithm for field testing
3 Result and discussion
3.1 Training and testing of RF-WLAR algorithm
This section presents the fault type classification accuracy for the training and testing of the RF-WLAR algorithm using the combined feature set(WL+AR+Pmax+M+STD).Fig.11 shows a confusion matrix for the results of the RF-WLAR algorithm testing,where the main diagonal box indicates the number of correctly classified faults.The training and testing set contained 300 of fault datapoints,and each type was represented by 75 fault datapoints.
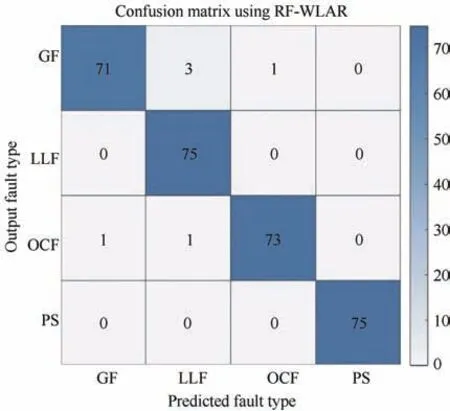
Fig.11 Confusion matrix of RF-WLAR with combined features set (WL+AR+Pmax+M+STD)
The confusion matrix in Fig.11 shows that of the OCF faults,two were incorrectly classified as GF and LLF.Four of the GF-type faults were incorrectly classified; three were classified as LLF,and one as OCF.All LLF and PS faults were correctly classified.The accuracy of each fault type classification was calculated as the ratio of the leading diagonal box to the total number of faults (75).The detailed classification accuracies for the training and testing of the algorithm are presented in Tab.4.
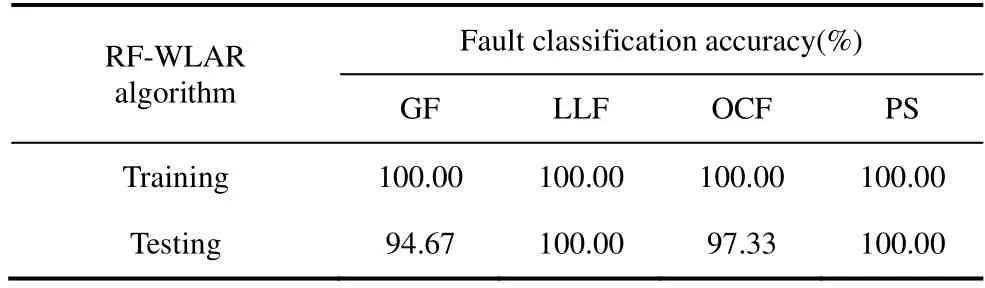
Tab.4 Fault classification accuracies using RF-WLAR algorithm
Tab.4 shows that the training algorithm achieved 100% accuracy in classifying permanent faults (GF,LLF,and OCF) and temporary faults (PS),whereas the testing algorithm achieved an average accuracy of 98%,with 100% accuracy for LLF and PS,and 94.67% and 97.33% accuracy for GF and OCF,respectively.
3.2 Field testing using RF-WLAR algorithm
The results of fault-type prediction using the RF-WLAR algorithm are presented in Tab.5,for 25 faulty datapoints resulting from field testing work.These results are summarized as follows.
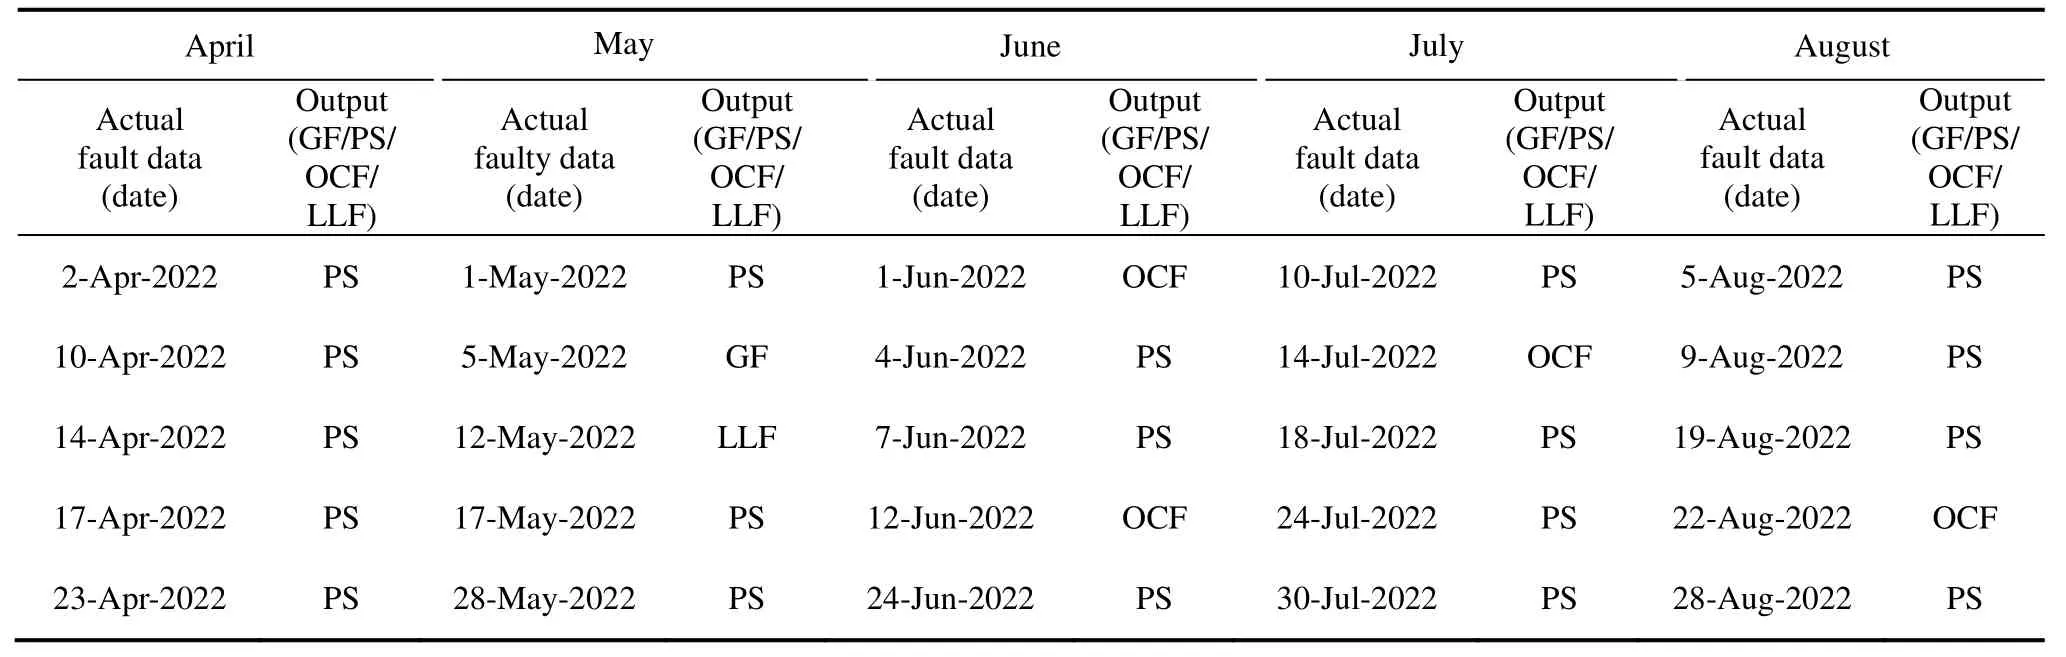
Tab.5 Fault type prediction (output) using RF-WLAR algorithm
(1) All the faults occurred in April were predicted as PS,which is a temporary fault caused by cloudiness,shadows(no repair work is required),or dust/snow accumulation,which requires cleaning (maintenance work).
(2) Faults occurred in May 5,2022,were predicted as GF,those on May 12,2022,were predicted as LLF,and the rest of the faults were predicted as PS.
(3) Two OFCs were predicted occurred in June 1,2022,and June 12,2022.The remaining predicted faults were attributed to PS.
(4) Only OCF was predicted to occur in July and August on July 14,2022,and August 9,2022.The remaining faults were predicted to be caused by PS.
The results of field-testing show that most predicted faults were attributed to temporary faults (PS),which are less severe than permanent faults.The ability of the MSFD model to predict the fault type is useful for informing corrective maintenance.
4 Comparison with other ML algorithms
Performing the training and testing using the KNN and SVM algorithms to compare and verify the reliability of the proposed RF-WLAR algorithm.The same extracted features (WL+AR+Pmax+M+STD) were used with actual irradiance data.Tab.6 presents the classification accuracies of RF-WLAR,KNN,and SVM.The RF-WLAR algorithm achieved the highest average fault classification accuracy of 98%,followed by KNN and SVM with 93.67% and 93.33%,respectively.
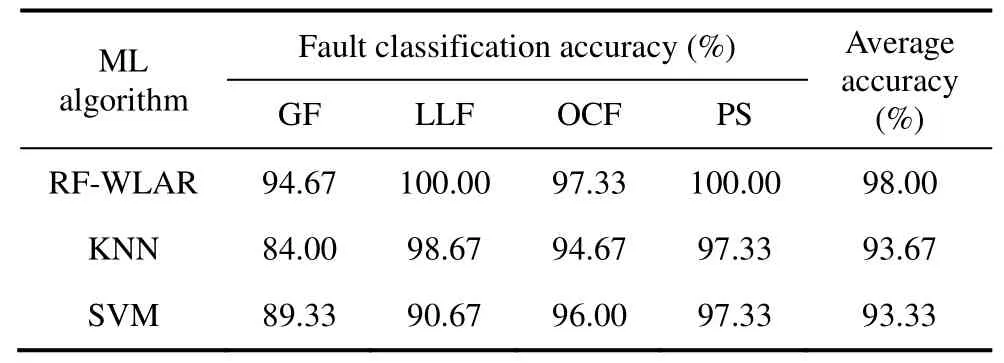
Tab.6 Comparison of fault type classification accuracies
Fig.12 shows a detailed graph comparison of the classification accuracy for each fault type,where RF-WLAR achieved the highest accuracy in classifying all fault types.In contrast,KNN produced the second-best accuracy in classifying LLF and PS.Finally,SVM obtained a better accuracy (96%) than KNN (94.67%) for classifying OCFs.These results verify that the RF-WLAR can be used to diagnose and classify faults in PV systems more effectively.
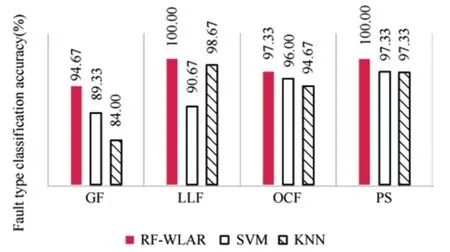
Fig.12 Graph of fault classification accuracy detail comparison
The processing times (s) taken for training and testing the algorithms were also recorded,as shown in Tab.7.
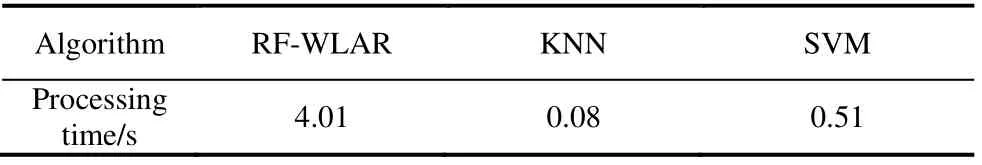
Tab.7 Comparison of processing time
Although the processing time for RF-WLAR was longer than that required to process KNN and SVM in diagnosing PV faults,it was nevertheless a short period with a duration of less than 10 s.
5 Conclusions
Multi-scale smart fault diagnosis (MSFD) is essential for detecting and diagnosing PV faults,as PV outputs are nonlinear due to the non-uniform distribution of daily irradiance.Thus,conventional protection devices cannot accurately detect faults in PV systems.An effective MSFD should be implementable at various PV scales.Although the MSFD is important,a good PV maintenance system is necessary for improving the productivity and overall life cycle of a PV system.Furthermore,the quality of feature extraction is an important factor that significantly affects the accuracy of PV fault diagnosis and classification.Hence,this study proposes a multiscale smart fault diagnosis model based on the RF-WLAR algorithm and 10-fold cross-validation.RF-WLAR is a supervised machine learning RF algorithm that employs waveform length(WL) and autoregressive (AR) as the main extracted features,together with the features of power maximum(Pmax),mean (M),and standard deviation (STD).
This study developed models for temporary faults(partial shading) and permanent faults (open-circuit fault,ground fault,and line-line fault) in PV arrays with multiscale feasibility.Actual irradiance data were then used to produce simulated data that closely matched the actual onsite data.In addition,to verify the reliability of the RF-WLAR algorithm,the MSFD model was trained and tested using two other supervised algorithms,KNN and SVM,with same combination of extracted features(WL+AR+Pmax+M+STD).The results demonstrated that although RF-WLAR required the longest processing time (<10 s),it also achieved the highest accuracy,with an average fault-type classification accuracy of 98% and 100% accuracy in classifying PS and LLF,while achieving 94.67% accuracy for GF and 97.33% for OCF.
Finally,the RF-WLAR algorithm was verified through field testing using actual faulty data samples obtained from the maintenance database of the KMSB Solar PV plant located in Pasir Mas,Kelantan,Malaysia.The field test results successfully predicted the type fault.These results achieved the study’s objective of developing an MSFD that can be used for various PV scales and is beneficial for corrective,preventive,and predictive maintenance.Nevertheless,this study has some limitations.First,not all potential PV faults were covered,such as degradation and arc faults.However,PS,OCF,LLF,and GF are common faults in PV systems.Finally,the scope of this study is limited to the diagnosis and classification of fault types.Thus,the identification of the fault location,which is crucial for large-scale PV systems,should be examined in future studies.
杂志排行

Chinese Journal of Electrical Engineering的其它文章
- Modified Sliding Mode Observer-based Direct Torque Control of Six-phase Asymmetric Induction Motor Drive
- TSKARNA-norm Adaption Based NLMS with Optimized Fractional Order PID Controller Gains for Voltage Power Quality
- Quantitative Comparison of Modular Linear Permanent Magnet Vernier Machines with and without Partitioned Primary*
- A Review of Variable-inductor-based Power Converters for Eco-friendly Applications:Fundamentals,Configurations,and Applications*
- Fast Solution Method for the Large-scale Unit Commitment Problem with Long-term Storage*
- Value Evaluation Method for Pumped Storage in the New Power System*