RFID Network Planning Optimization Using aGenetic-Simulated Annealing Combined Algorithm
2023-08-26AliSanagooyAghdamAbbasToloieEshlaghyMohammadAliAfsharKazemiAmirDanehsvar
Ali Sanagooy Aghdam ,Abbas Toloie Eshlaghy ,Mohammad Ali Afshar Kazemi ,Amir Danehsvar
1 Department of Information Technology Management;Central Tehran Branch;Islamic Azad University,Tehran,Iran
2 Department of Industrial Management,Science and Research Branch,Islamic Azad University,Tehran,Iran
3 Department of Industrial Management,Central Tehran Branch,Islamic Azad University,Tehran,Iran
Abstract: The main purpose of this paper is to present and apply a genetic and simulated annealing combined algorithm to solve an optimization problem of Radio Frequency Identification (RFID) network planning in an emergency department of a hospital.Accordingly,though genetic algorithm(GA)and simulated annealing(SA)have advantages and disadvantages,but they are also complementary.Hence,the combined algorithm not only takes advantages of the two methods,but also avoids their disadvantages.The simulation results in an emergency department of a hospital present that the proposed method provides minimum total cost and maximum RFID network coverage in a simultaneous way with the efficient use of multi-antenna RFID readers.Besides,the results of comparison of two scenarios of the model with the results of other existing models in the relevant literature show that the proposed model has better outcomes.
Keywords: multi-objective problem;multi-antenna readers;healthcare;simulation
I.INTRODUCTION
RFIDstands for Radio Frequency Identification and refers to an identification system [1].It is a wireless technology capable of automatically and unambiguously identifying objects without line of sight by extracting a unique identifier from microelectronic tags attached to objects[2].According to a federal agency of the Department of Health and Human Services in the United States,information technology integration can prevent fifty percent of all healthcare mistakes caused by incorrect identification.RFID is a new technology that collects information and data as well as automatically detecting the identification,placement,and movement of individuals,resources,and properties.Furthermore,it is increasingly being used in a variety of industries,including healthcare[3].
The healthcare industry is widely regarded as one of the most important sectors of many economies,and it is currently confronted with issues such as rising operating costs,high levels of medical error,and an aging patient population[4].RFID technology is regarded as an upcoming innovative technology in medical care,offering numerous opportunities to increase security,operational efficiencies,and cost reduction through the use of tags on properties and goods in stock,patients,and staff.However,RFID is still plagued by cost,security,and privacy concerns[3].A number of challenges have prevented organizations from adopting RFID,including the technical environment,standard settings,infrastructure weaknesses,high costs,and migration issues from barcodes to RFID systems[5].Decision-makers in the health-care industry have begun to recognize technology’s supportive role in focusing on quality care while facing regulatory,competitive,and business and operational pressures[6].
Health care is a complex field of application with distinct characteristics.There have been few studies in this field.According to the Institute of Medicine(IOM),between 44000 and 98000 people die each year as a result of healthcare errors.Medical errors,increased costs,theft loss,drug fraud,and inefficient workflow are all known causes of medical service failure.A good health information system can save the economy 140 billion dollars per year.It accounts for nearly a tenth of the total cost of medical care in the United States.Theft of hospital equipment and supplies is estimated to cost 4,000 dollars per year,which adds up to 3.9 billion dollars per year in the United States,which has nearly 976,000 beds of staff.As a result,detecting medical care tools,particularly those with expensive properties,is critical.It is estimated that the pharmacy industry loses $2 billion per year due to drug counterfeiting.More than 30% of physicians’ and nurses’ working time is wasted searching for or pursuing patient-related data[3].
The RFID network planning (RNP) problem is solved by adjusting system control variables to optimize a set of goals [7].Because it is a complex hybrid NP problem[8],it cannot be solved exactly using complete search techniques.As a result,nearly all current techniques focus on the use of heuristic and metaheuristic approaches to overcome RNP’s NP-hardness.The problem specifications are used to develop heuristic methods.Although these techniques do not guarantee convergence to the optimum,they are capable of quickly outperforming solutions [9,10].Several RNP methods have recently been proposed for the purpose of detecting properties in hospitals [2–4,6,11–15].They considered locating the fewest number of RFID readers and placing them in the worksite to maximize coverage,with no regard for the use of multiantenna RFID readers.This study presents a multiantenna RNP model for tracking medical assets based on swarm intelligence.The following are the main contributions:
• The RNP model for tracking medical assets has been introduced,with a focus on multi-antenna reader devices.
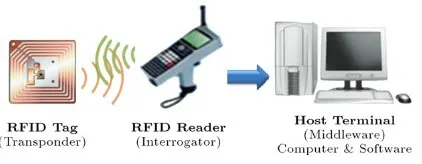
Figure 1.RFID system components[16].
• A multi-objective programming has been developed to maximize network coverage while minimizing overall cost,tag reader collision,interference,energy consumption,and path loss.
• A combined algorithm of genetic algorithms(GA)and simulated annealing(SA)is developed to solve the problem by combining the advantages of both methods.
• The proposed method is applicable in a hospital to demonstrate its application.
This paper is organized as follows: (1) reviewing existing literature,(2)presenting the methodology,(3)presenting the simulation results,and (4) conclusion and recommendations.
II.LITERATURE REVIEW
RFIDwas first presented by Mario W.Cardullo in 1973.A typical RFID system consists of three components: an RFID tag that is connected to an asset for identification,an RFID reader that applies information from the RFID tag,and middleware that processes,saves,and retrieves data and information.Through integration with an information system,an RFID system provides a foundation for intelligent services[3].
RFIDtags can be categorized into two types as the followings[3]:
• Passive tags: They do not include a power supply as a component and rely on reliable readers.They are primarily used to identify and control access.
• Active tags: They are battery-powered,transmit radio waves,and have a very long reading range.As a result,they are more appropriate for active detection.
The price and application of tags vary depending on their frequency and range.The frequency of tag operation has an impact on performance,range,and interference.Different tag standards employ various frequency bands.High frequency can travel up to one meter.Because it can be embedded with fine assets,it is used in sales outlets and access monitoring.It operates at a frequency of 13.56 MHz and is less expensive to implement.Low frequency is appropriate for shortdistance applications.It does not work on wet or metal surfaces,and it is only effective at a distance of half a meter,which is 50% of the high frequency range.It has a frequency of 125 kHz.Ultrahigh frequency can be used to increase reading speed,and a large number of tags with UHF can be identified at the same time.It also has a greater reading range and is three times better than high frequency,and tags can be read up to three meters away.However,in a humid environment,the distance can be reduced.It operates at frequencies ranging from 860 to 930 MHz.The microwave has a limited reading range and can only operate in meters.It is,however,faster than UHF,reads,and has little influence from metal or wet surfaces.It operates at GHz and is faster than LF,HF,and UHF,allowing it to operate more efficiently for vehicle access[1,15,17,20,21].
Readers are used to control antenna waves and manage tag information.RFID readers include at least one antenna and a decoder for decoding information obtained from tags.Data can be read or written from adjacent tag IDs,and these IDs can be mapped to objects using an external database [6].All data and information are sent to the host computer or RFID middleware to ensure communication between the RFID infrastructure and various systems within the organization and systems between two or more organizations[4].
RFIDhas advantages and disadvantages as presented in Table 1.

Table 1.Benefits and weakness of RFID systems[16–19].
RFIDin the healthcare industry is regarded more than just a tracking property;it is also viewed as a technology capable of[3]:
1.Improve care by keeping track of vulnerable patients.
2.Define the positions of patients and personnel during an emergency.
3.Track medicines from production to reception in the pharmacy industry to reduce fraud,burglaries,and drug misapplication.
4.Sense temperature,humidity,and so on.
5.Provide patients with automated care.
6.Locate patient routes,
7.Facilitate data collection,
8.To improve patient safety,it will be used as a patient identification system.
Existing studies in the area of RNP are summarized as the followings:
• They proposed a modular algorithm for defining the best position of readers using their coverage features,as well as a model of RNP optimization in hospital environments[12].
• An integrated IT system that uses RFID and Bluetooth technologies to track personnel,assets,consumables,and medicines (PACD) in ambulance services.It employs a database at the center to reduce physical paperwork and provide support staff with a greater focus on patient care.PACDs are automatically monitored to warn of discharge,absence,or maintenance dates[15].
• RFID technology is used to provide a mobile healthcare service to handle SARS infection as well as position and other information relevant to patients’health status[22].
• Using the Markov chain,a model is developed to identify the benefits of using RFID technology in hospital settings.It has been demonstrated that an RFID asset tracking system could significantly increase the use of medical properties[23].
• A chicken swarm optimization (CSO) method is proposed for optimizing the location of RFID reader antennas[24].
• A multi-objective algorithm based on the firefly algorithm(FA)was used to find the optimal RFID network planning taking into account the number of readers,coverage,and interference[25].
• A Graham scan algorithm is proposed to reduce the number of readers required to achieve complete network coverage[26].
• A hybrid differential evolution(DE)algorithm is introduced in addition to the cloud model,and the algorithm’s validity is confirmed by using it to optimize RFID reader placement[27].
• A genetic algorithm (GA)-based evolution-based RNP model is proposed for network coverage maximization and antenna beam direction optimization[28].
• A heuristic for minimizing the number of readers and reducing the intersection of adjoining readers is presented.They used two load balancing techniques to distribute and share fixed and mobile loads among various RFID readers[29].
• Meta-heuristics algorithms provide a high-level problem-independent framework for finding a group of near-optimal solutions by repeatedly improving the quality of the solution to a given objective function[30–32].
• An RFID system in a hospital setting to track the location of medical equipment,ensure quick access,functional handling,and advanced maintenance.As a result,technical staff have access to the system via a smartphone application,resulting in less time spent looking for medical equipment[17].
• A swarm intelligence model for RFID network planning using readers with multiple antennas to trace medical properties in hospitals with the goal of minimizing the overall cost of the RFID network and maximizing network coverage[33].
• A nonlinear finite optimization problem is presented and solved using a new hybrid algorithm called particle swarm optimization,which is based on genetic simulated annealing,to produce a near-optimal solution for minimizing total energy consumption by smart mobile devices and edge servers[34].In this regard,a particle swarm optimization meta-heuristic algorithm based on genetic learning is proposed to optimize task offloading between mobile devices (MDs),small base stations(SBS),and macro base stations,connecting users to SBS,CPU speed of MDs,and transmission power,and allocating channel bandwidth[35].
• A multi-objective optimization problem is defined,and a guided whale archival optimization algorithm is proposed to solve it in order to minimize energy consumption while delaying user responses and increasing the number of established small-scale clouds[36].
The Ant Colony Algorithm (ACA),Clone Selection Algorithm (CSA),Particle Swarm Optimization(PSO),and GA have been the most widely used swarm intelligence algorithms [37].These algorithms have resulted in the development of quick and dependable methods for solving a variety of complex optimization problems [38].In comparison to other swarm intelligence algorithms,the GA’s performance was unremarkable [39].Furthermore,evolutionary algorithms have been shown to be extremely effective at solving multi-objective optimization problems [40].Among three evolutionary algorithms that are very similar:GA,PSO,and differential evolution(DE),GA is found to be more suitable for discrete optimization[41].The disadvantages of the Whale Optimization Algorithm(WOA) include slow convergence,low accuracy,and an easy fall into local optimum[41].
Six learning algorithms,including GA,are used to train an artificial neural network in [42] to improve its performance.The Taguchi experimental design method is used in this study to determine the best combination of user-defined parameters.Even with an ideal solution,it is demonstrated that the Taguchi method cannot achieve high evolution performance[43].Big Bang-Big Crunch (BB-BC) optimization is used in [44] to achieve an optimal proportionalintegral-derivative controller.The BB-BC algorithm outperforms the GA,but not the combined GA-SA algorithm [45].SVM-Grid [46] is an online fault detection model based on a systematic parameter-search method.[47] compares the most well-known optimization algorithms (Grid Search,Random Search,and GA).However,it has been demonstrated that GA performs better when there are too many parameters.In [48],Chaotic Harris Hawks Optimization(CHHO) is proposed and compared to some original metaheuristics algorithms,including GA,but not the combined algorithm of GA and SA,and its superior performance is demonstrated.
Table 2 compares various methods regarding their advantages and disadvantages.

Table 2.Advantages and disadvantages of various methods.
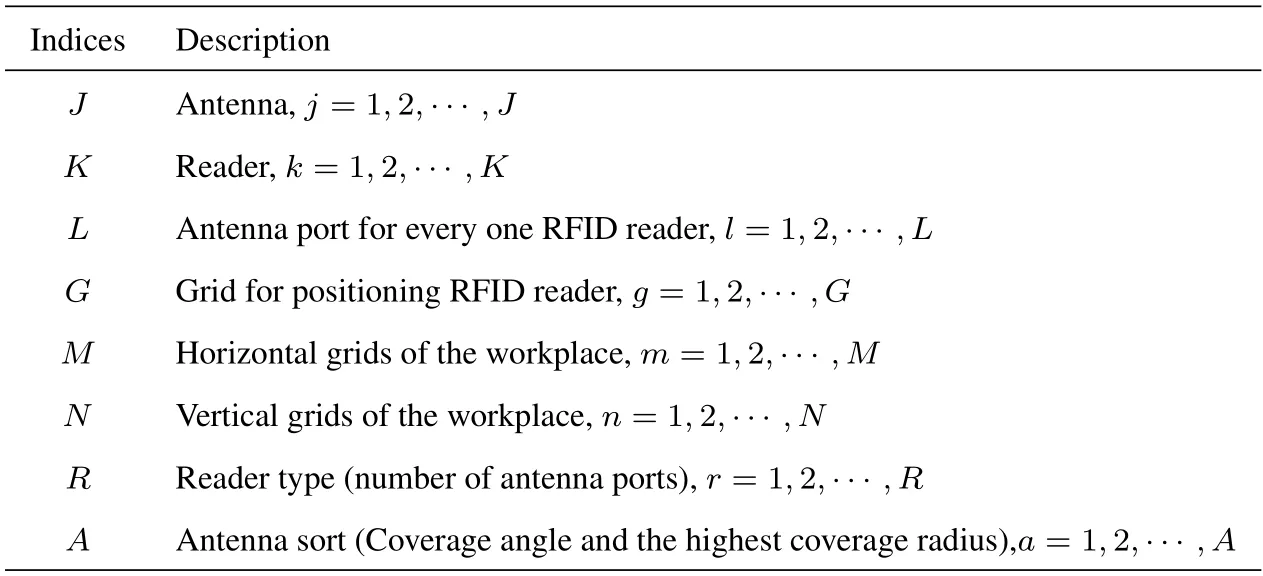
Table 3.Indices in the RNP model.
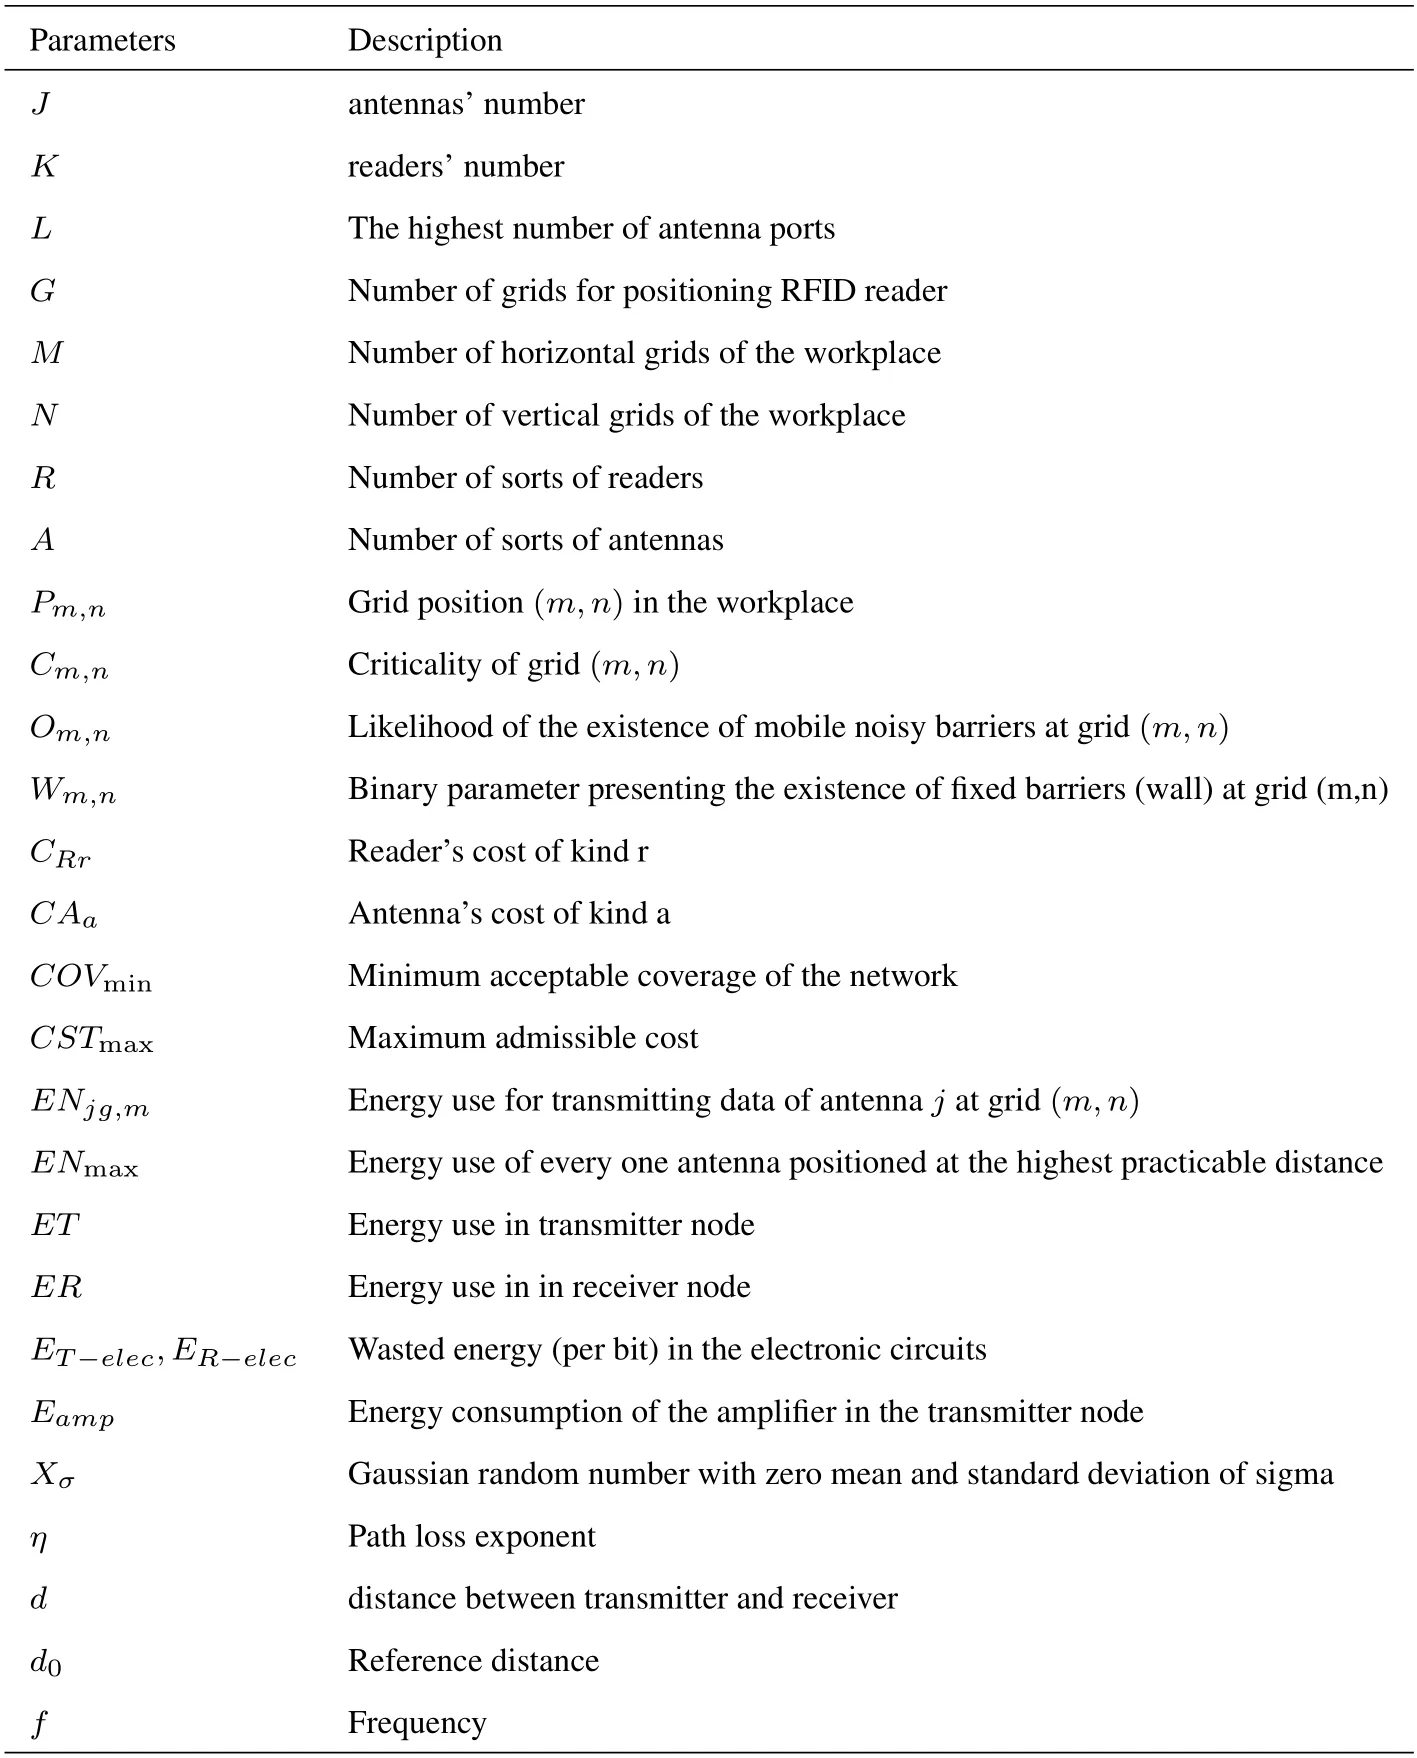
Table 4.Parameters in the RNP model.

Table 5.Decision variables in the RNP model.
The proposed algorithm’s goal is to combine general and local search capabilities to improve con-vergence speed while also searching for the best global calculation.The proposed GA-SA algo-rithm is compared to other heuristic algorithms and experimental results,which demonstrate its high efficiency in problem solving.
III.METHODOLOGY
3.1 Genetic Algorithm(GA)
Genetic algorithm(GA)search techniques are derived from evolutionary mechanisms and natural genetics.John proposed GA,and since the early 1970s,heuristic search algorithms based on natural and physical processes have been developed.These algorithms have proven to be valuable tools for addressing the NP-hard problem.Their programming is very simple.GA is based on the following principles[49]:
• In a population,individuals strive to gain resources and mates.
• Fortunate individuals produce more offspring in every one rivalry than those who perform poorly.
• The genes of good individuals are spread all over the population;thus,two good parents often give birth to better offspring compared to either parent.Therefore,every one successful generation will be adapted to its setting.
There are issues with GAs.One of the issues is early convergence in the optimization of the GA,which results from a high reliance on crossover.This can have an effect on the population by making it uniform,and as a result,the search for the optimum in the mutation phase becomes very slow.Another issue is the convergence of the optimum after the discovery of a nearly optimum.Finally,another issue with this algorithm is its high level of memory usage.Keeping a large population of solutions in memory raises memory requirements.Figure 2 depicts the steps of the GA.
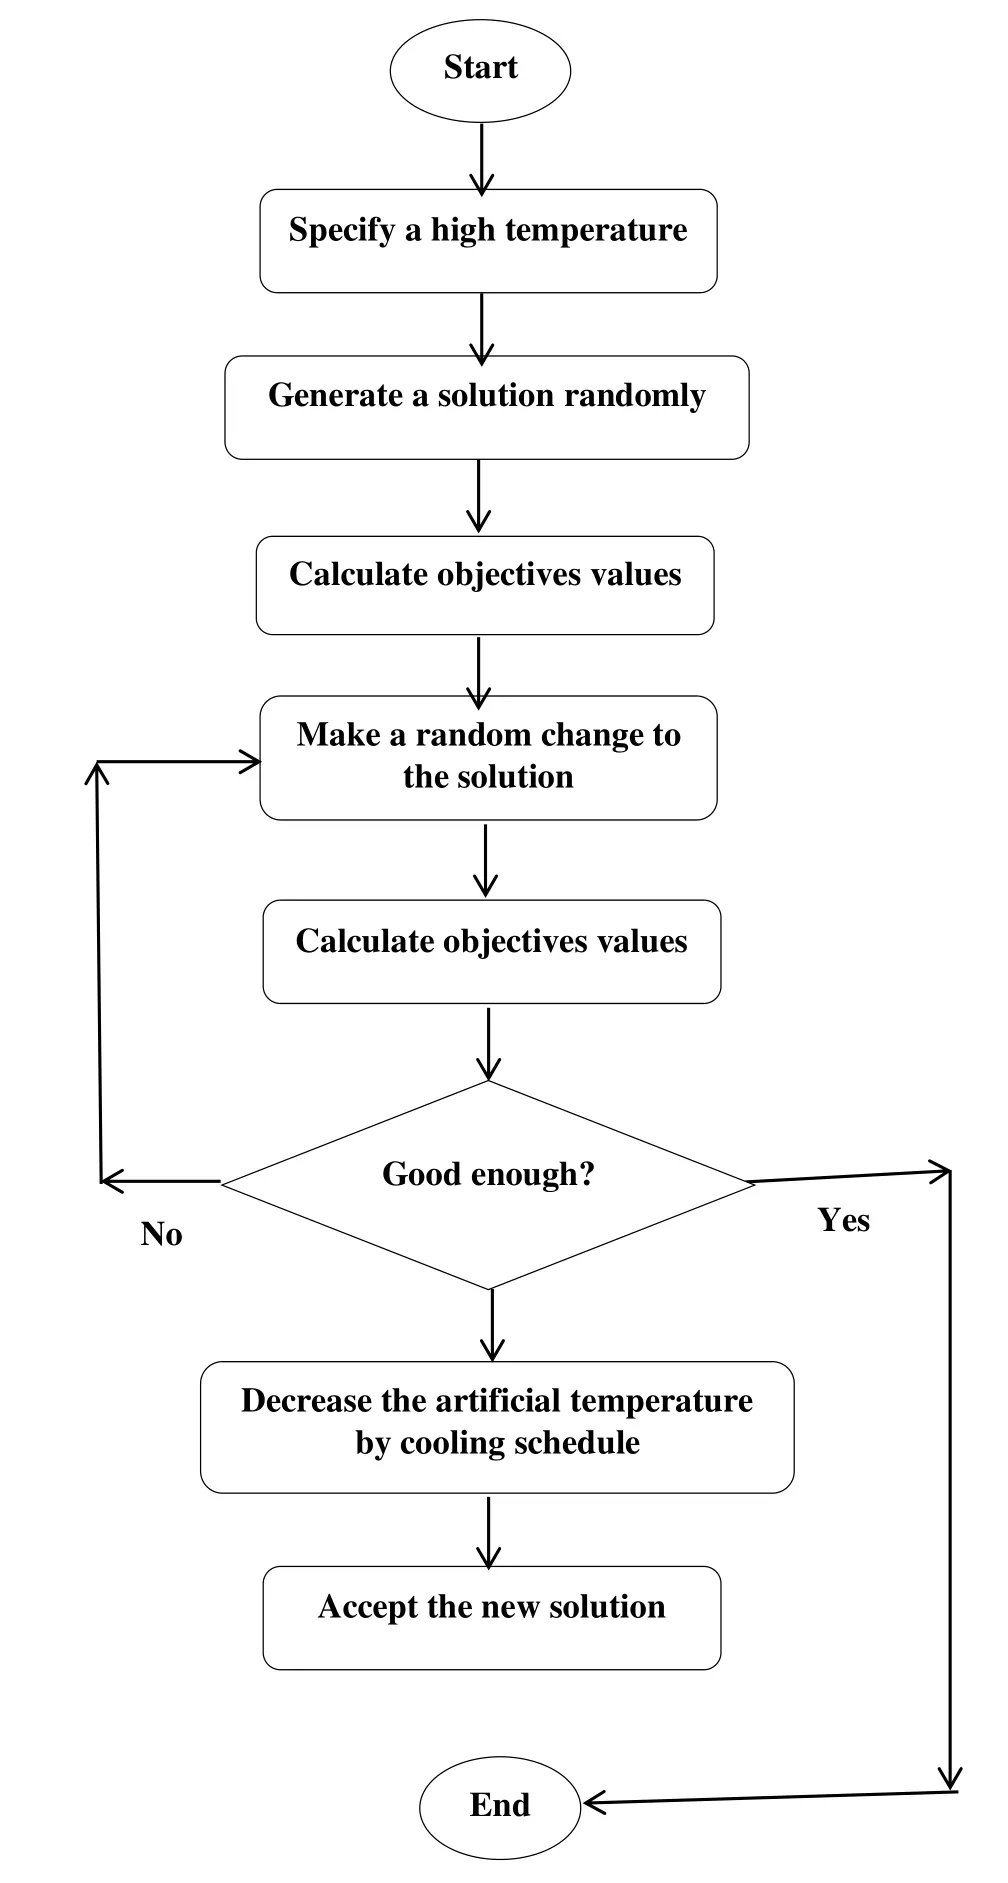
Figure 3.Flowchart of the simulated annealing (SA)adapted from[51].
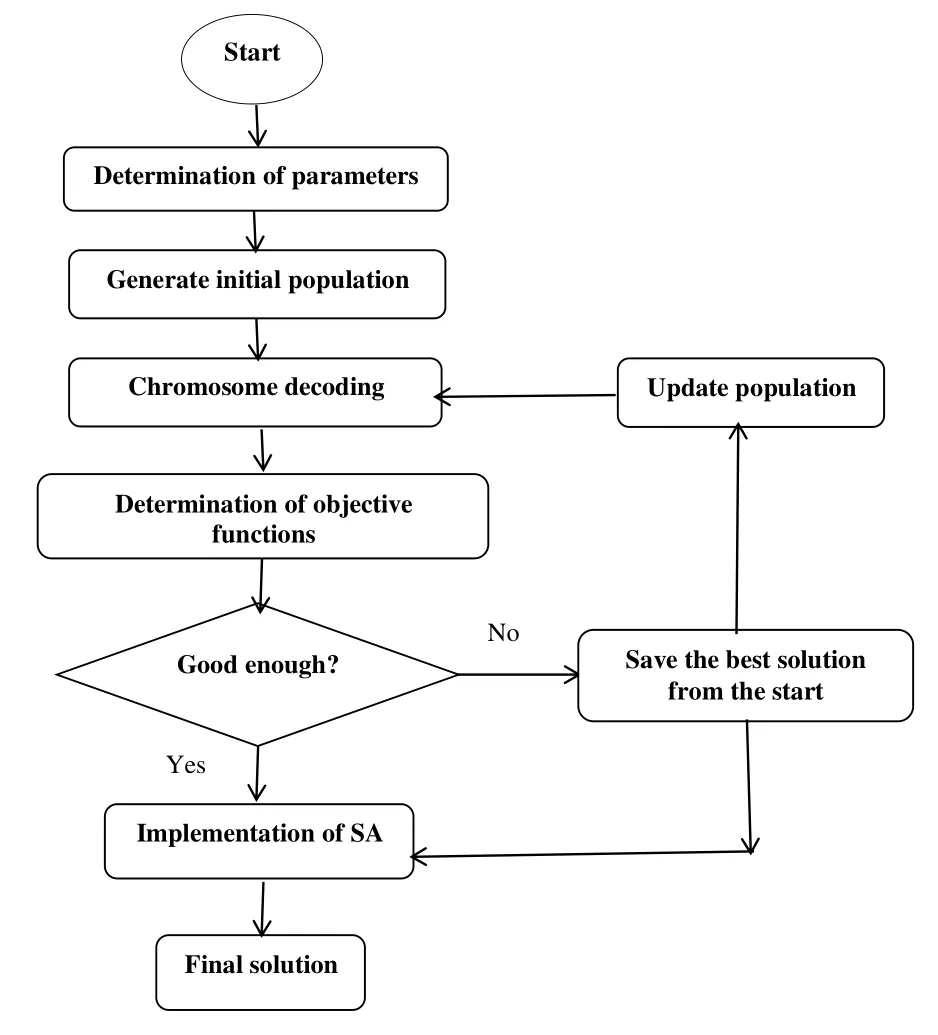
Figure 4.The model for the combined algorithm of GA and SA.
A.CROSSOVER OPERATOR:
Crossover,like natural mutation,produces a new generation.A new generation is formed by carrying both parents’ genes with parental mutations.To put it another way,before using a crossover operator to create an offspring,two parents of the current chromosomes are chosen using the roulette selection method(RWS).The RWS algorithm is used to select parents based on their probability value.There is a good chance of finding a good solution in this selection.However,there is the possibility of selecting parents with severe consequences.For all binary and quantitative structures in this study,a uniform crossover operator is used.
B.MUTATION OPERATOR:
When using the mutation operator to generate a chromosome,the chromosome is first selected using the roulette wheel selection method.Mutations differ depending on how the chromosome is represented.Two methods of binary swap mutation and value swap mutation were used in this study.
3.2 Simulated Annealing
Annealing is defined as a process in which the temperature is reduced.The solid is first heated and melted at a high temperature.In this regard,all of the particles move at random.The solid then cools to produce particles with the lowest energy state.The cooling program should be slow enough to avoid the appearance of defects or the complete absence of crystalline order.A new solution is created in this method using the neighborhood form and a generation technique.The neighborhood structure expresses several solutions that are somewhat similar to the current solution [50].The generation method is intended to select a new solution from the neighborhood.Because SA is dependent on initial parameters,if the initial parameters are not carefully chosen,they may not be as strong as GA.
The facets of an optimization problem and a solid can be compared[51]:
• The solutions to the optimization problem are analogous to the conditions of a solid.
• The objective value is analogous to the energy of a state.
• The solutions to the signal timing optimization problem are signal timing,and the objective value can be any measurement of signal timing effectiveness.
3.3 The Combined Algorithm of GA and SA
In this study,a combined algorithm based on a GA and SA is developed in order to achieve better performance and overcome the limitations of the GA.The reasons for combining GA and SA are that they are used as systematic and robust search operations,and they are regarded as suitable methods for solving hybrid optimization problems because they produce nearly optimal solutions.A combined GA and SA can overcome the limitations of either method,demonstrate the benefits listed below,and improve the solution[49].
• GA refers to algorithms derived from biology that are used for random search and optimization.In other words,it is governed by natural evolution and genetics.
• The ability of GA’s global search to solve the aforementioned problems is strong.
• SA has strong local search capability and has no premature problems..
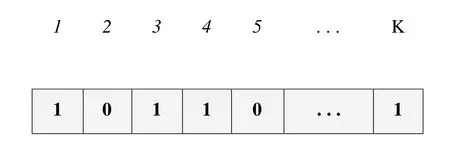
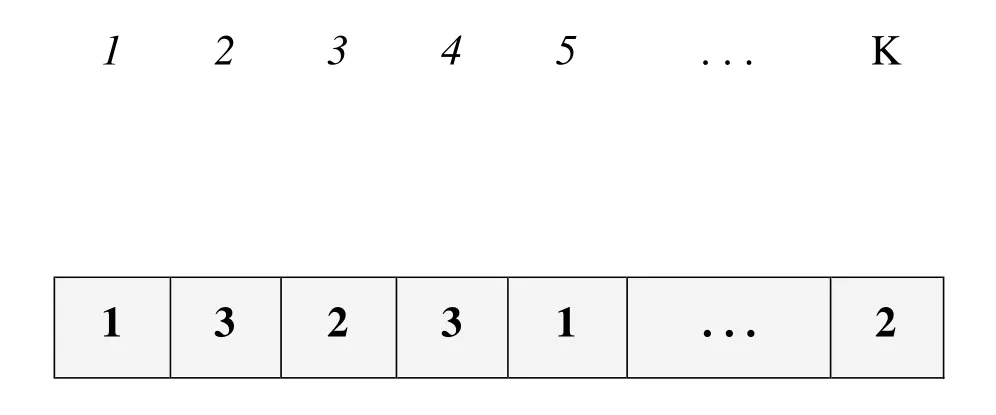
Two types of binary and quantitative structures are used to create a primary chromosome.The initial vectors are prepared to determine the primary chromosomes based on the specifications of the network installation site(critical map)and the hardware specifications of the sensors and antennas.
1) The longitudinal position of the sensors Solution:
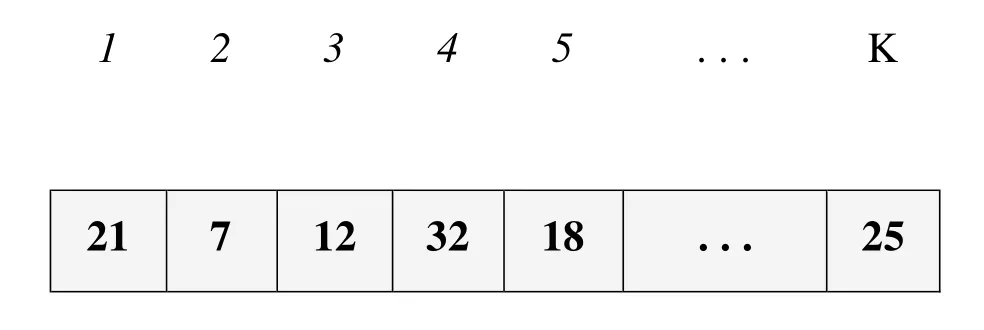
2) Transverse position of the sensors
Solution:

3) Selecting or not selecting sensors
Solution:
4) Determining the type of sensors (3 types including 1=single port,2=dual port,and 3=four port)
Solution:
5) Antennas are selected or not
Solution:
6) Determining the type of antennas (from 6 different types of antennas with different angles and coverage boards)
Solution:

7) Assigning antennas to sensors(number of sensors for each antenna)
Solution
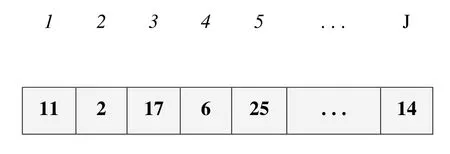
8) The angle of the antennas on the sensor(1=0,2=45,3=90,4=135,5=180,6=225,7=270,and 8=315)
Solution:
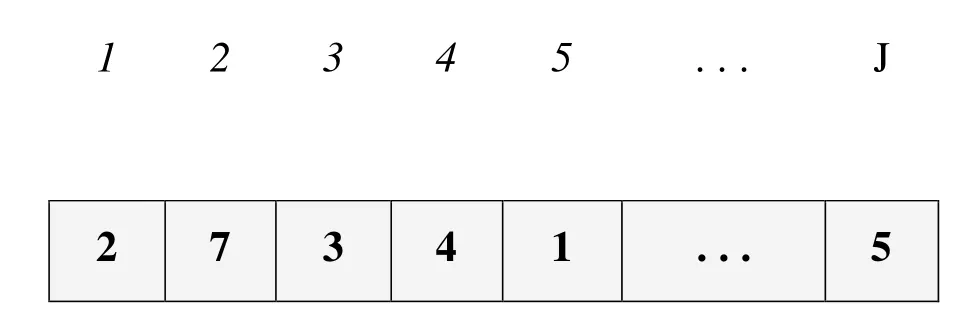
9) Antenna gain to determine the coverage board as a percentage of the maximum antenna coverage board(1=50%,2=75%,and 3=100%)
Solution:

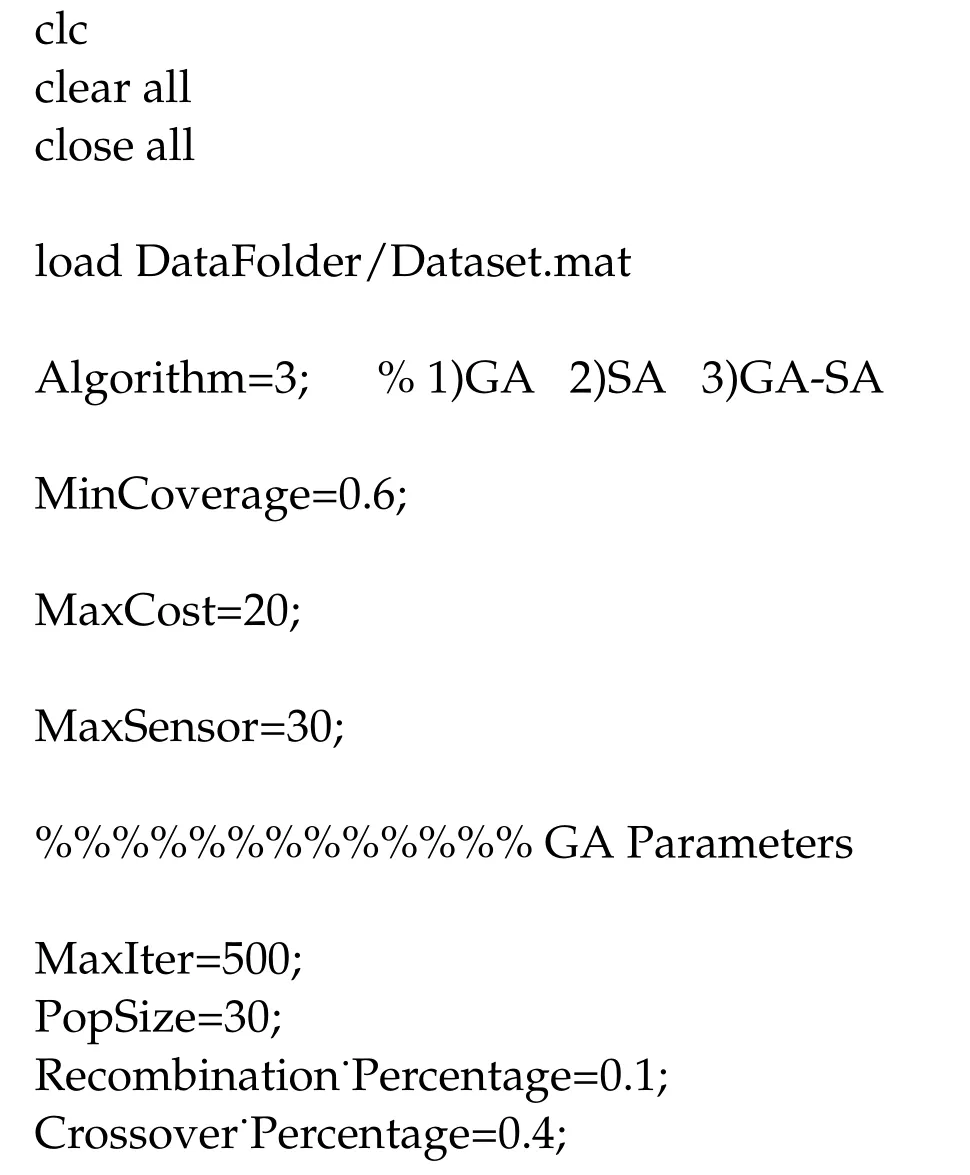
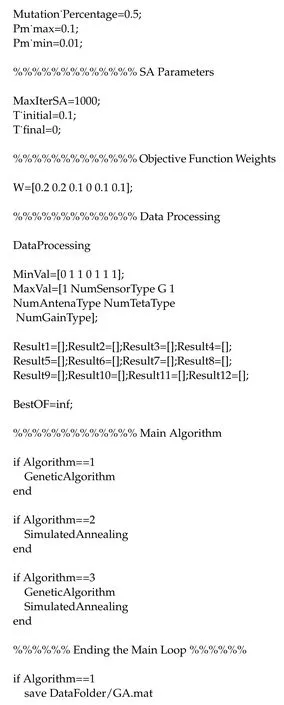
There are two general steps in each iteration of the GA that performs global optimization: the first is to evaluate the error of the generated solution,and the second is to update the population.These two steps are repeated 200 times until the condition for completion of repetitions(the algorithm’s termination)is met.The population upgrade process is divided into three stages:recombination,crossover,and mutation,which result in the Pr,Pc,and Pm percent of the next generation,respectively.According to the algorithm,these values are 10%,50%,and 40%,respectively.The best answers from the GA are considered the SA’s initial solution.This algorithm performs local optimization and a local search in the neighborhood of the optimal solution in an iterative loop(number of iterations 1000).The first temperature considered at the start of the algorithm is 1 and the last temperature considered is 0.
3.3.1 The Operation of the Algorithm According to the Program Code
end
if Algorithm==2
save DataFolder/SA.mat
end
if Algorithm==3
save DataFolder/GASA.mat end
3.4 Indices,Parameters,and Decision Variables of RNP Model
The study introduces a new RNP model with multiantenna readers for efficient asset tracking at the lowest cost and highest coverage.The RNP model is proposed as an extension of the RNP models in [8,12,17,52–54],taking into account additional model details and RFID readers with multiple antennas.RNP considers various RFID reader types(respecting number of antenna ports) and various antenna types with their own coverage features(respecting angle and coverage range)for RFID network planning.Tables 3,4,5 present a list of the indices,parameters,and decision variables used in the RNP model.
3.5 The RNP Model’s Multi-Objective Function for Optimization Problem
The combined GA and SA algorithm is proposed for a multi-objective function,which includes six objective functions as listed below:
• Maximizing the percentage of network coverage.
• Minimizing the percentage of installation and commissioning costs in order to purchase sensors and antennas.
• Minimizing the percentage of network interference,implying synchronous coverage of grades via various antennas.
• Minimizing the percentage of network interference caused by movable obstacles in order to improve the possibility of efficient connection between tags and antennas.
• Minimizing the percentage of network energyconsumption.
• Minimizing the percentage of path losses.Furthermore,the weighted average technique based on Equation(1)is used to convert a multi-objective function to a single-objective function:
Noting that:
•W1is the coefficient of(1−Coverage),
•W2is the coefficient ofcost,
•W3is the coefficient ofinterference,
•W4is the coefficient ofcollision,
•W5is the coefficient ofenergy,
•W6is the coefficient ofpathloss.The conditions for having the minimum coverage while installation and commissioning costs do not exceed the allowable ceiling are illustrated below:
3.6 Multi-Antenna RFID Readers
A multi-antenna RFID reader is more efficient in terms of implementation and coverage.Furthermore,it is more cost effective because the number of RFID readers affects the cost of an RFID system [56].In general,several RFID readers must be installed on the network to achieve the desired level of network coverage.However,the cost of deploying multiple readers is significantly higher than using multiple antennas on each reader device [57].As a result,this study develops the RNP model by increasing the number of antennas attached to each RFID reader.This can effectively reduce the number of RFID readers,lowering the overall cost of the RFID network.
The sensor’s coverage level is determined by antenna characteristics such as frequency range,beam width,and power.Furthermore,the sensors are usually adjustable in various settings.The frequency range influences how the sensor covers its surroundings[12].
Aside from the number of readers and network coverage,some factors must be considered when using multi-antenna RFID readers.These factors include the type of reader (regarding the number of antenna ports),the number of antennas to be attached to each reader,the sort of antenna (regarding angle and reading range),beam power,and the direction and interferences of each antenna.
IV.CASE STUDY
A rectangular hospital design with M horizontal and N vertical grids is assumed.Figure 5 depicts the hospital with a two-dimensional plan and the first input withXandYaxes.The emergency department of a hospital in Tehran,Iran,was chosen as the case study for this study.
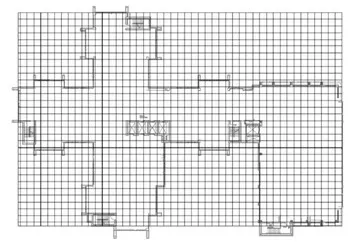
Figure 5.Hospital plan[55].
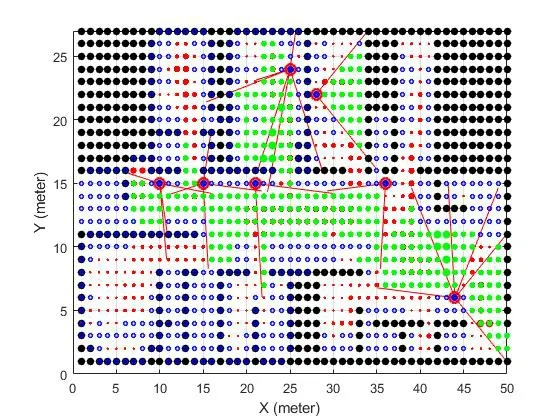
Figure 6.Plot for scenario 1: Coverage=60%,Cost=20×1000$.
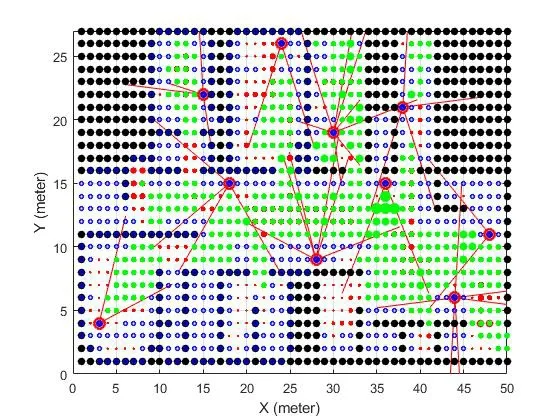
Figure 7.Plot for scenario 2: Coverage=80%,Cost=30×1000$.
The RNP model can be visualized as the optimization of RFID readers and K antennas for maximum coverage.It is necessary to assess network coverage by measuring the criticality of various work space grids,specifically hospital design.Hospital personnel must prepare data on static and dynamic properties,the significance and frequency of utilization of the various properties,and the zones where each dynamic property may exist in order to calculate the criticality of various workplace zones.Based on this,a list of medical assets is generated,each with its significance,frequency of utilization,locations of use,locations of storage,and overall criticality.The importance and frequency of use of each property are multiplied to determine its criticality.The more critical the grid,the more critical its protection.Table 6 summarizes some of the data.

Table 6.List of medical assets.
4.1 Simulation Settings
RFIDreaders with one,two,or four antenna ports are considered.Furthermore,six different types of circular polar antennas are assigned to different reader ports,each with its own set of coverage features (respecting maximum reading range and coverage angle).Table 7 summarizes the characteristics of the six antennas.
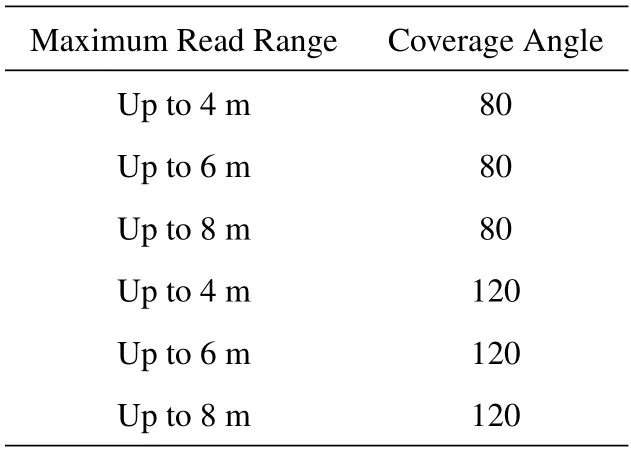
Table 7.Parameter setting for the combined algorithm of GA and SA.
Dif Different values for each parameter were tested in order to adjust the controllable parameters of the combined GA/SA algorithm and simulate the best value in terms of the objective function(ObjFun)and convergence rate.Table 8 shows the controllable parameters of the combined algorithm.Table 9 also shows the default values of the RNP model parameters used in the simulation.
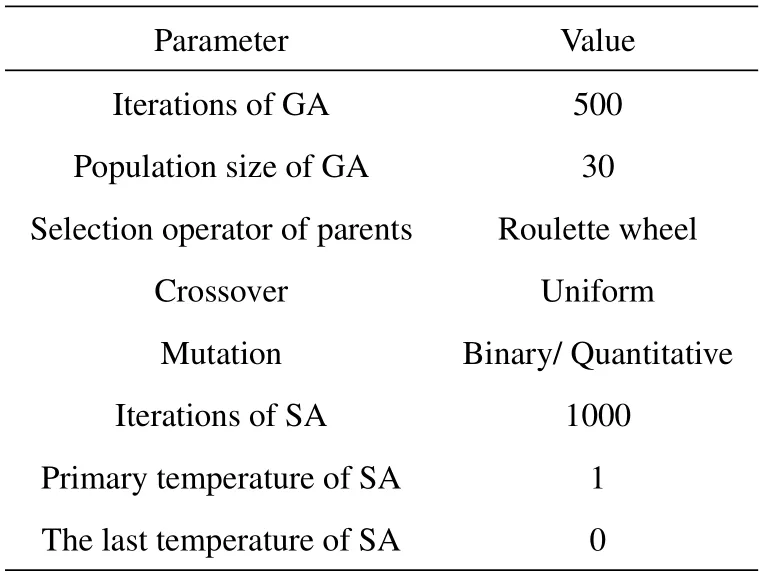
Table 8.Parameters of the combined algorithm of GA and SA.
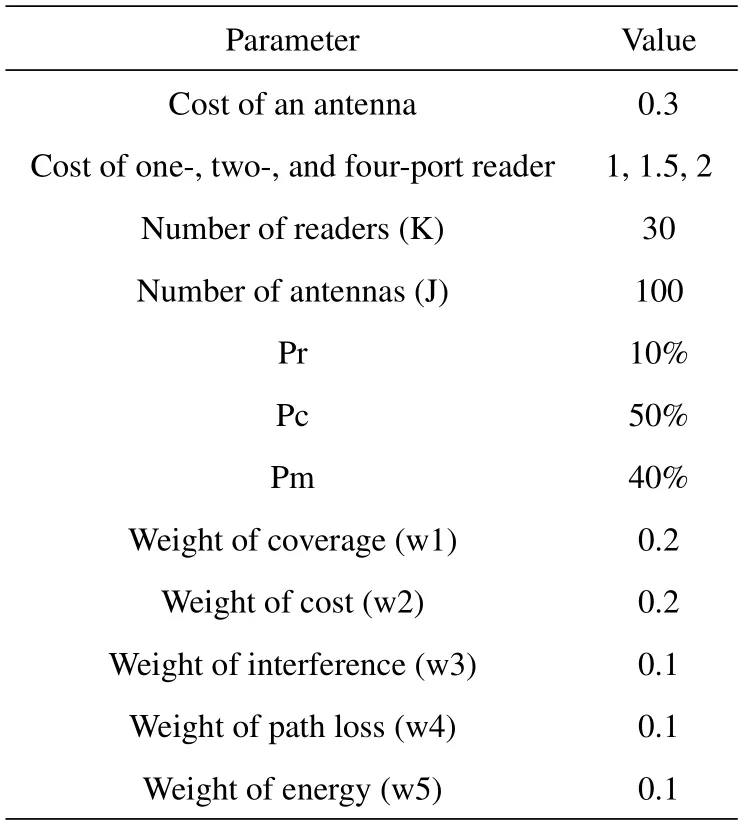
Table 9.Parameters of the combined algorithm of GA and SA.
V.SIMULATION RESULTS
The GA/SA combined algorithm was designed and implemented in MATLAB R2020b.In this section,the results of the combined algorithm used to solve the RNP model are presented.Table 10 depicts two scenarios that are used to evaluate values for the highest available cost as well as the least coverage required.

Table 10.Scenarios of the simulation.
Table 11 compares the results obtained for the two scenarios.According to the results,the network coverage for each scenario is 60%and 80%,respectively.Both scenarios have total costs of 20 and 30,respectively.
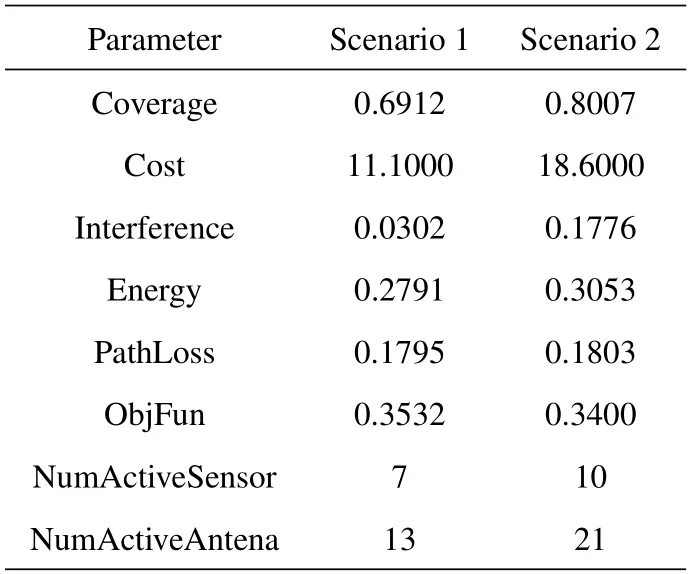
Table 11.Comparative results for the scenarios.
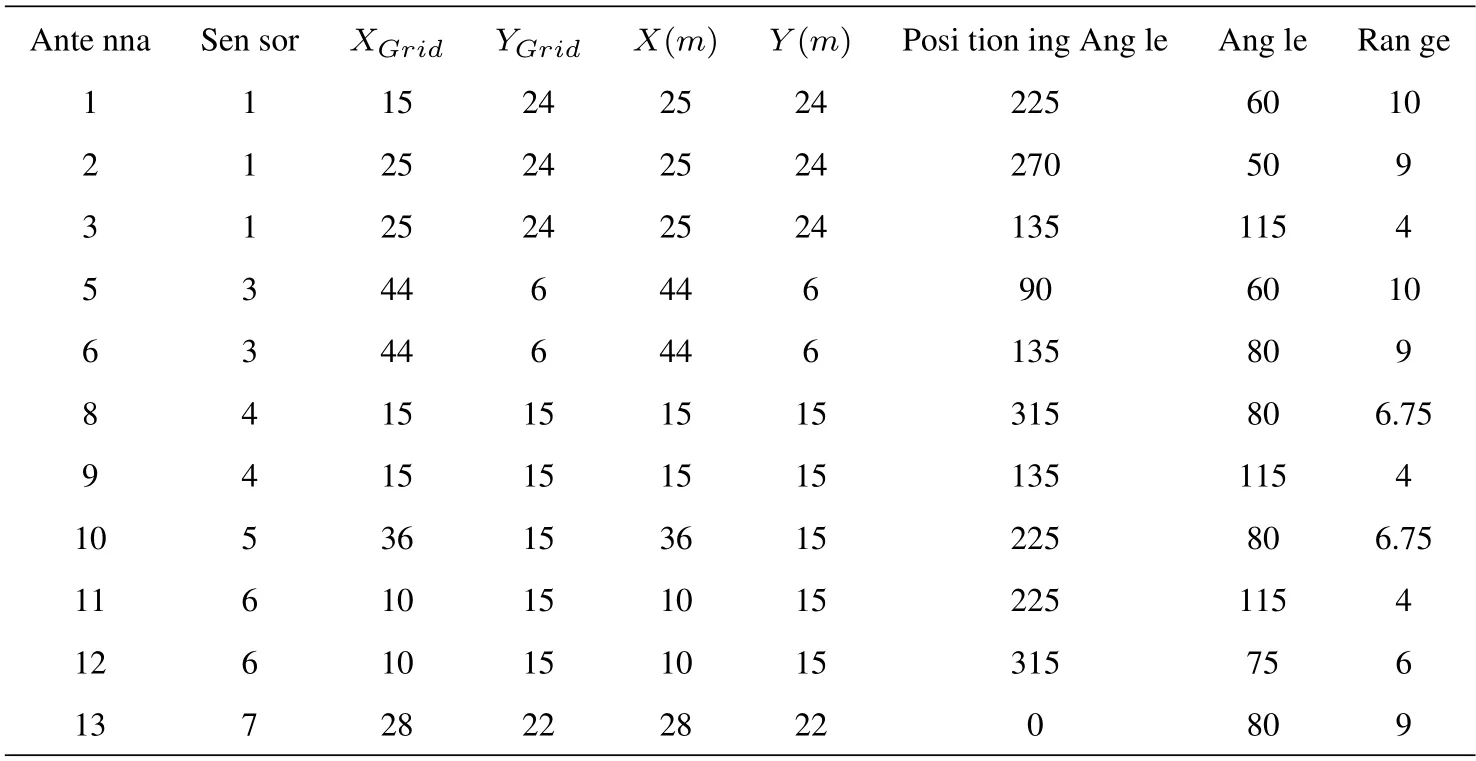
Table 12.Optimal antenna design for the first scenario.
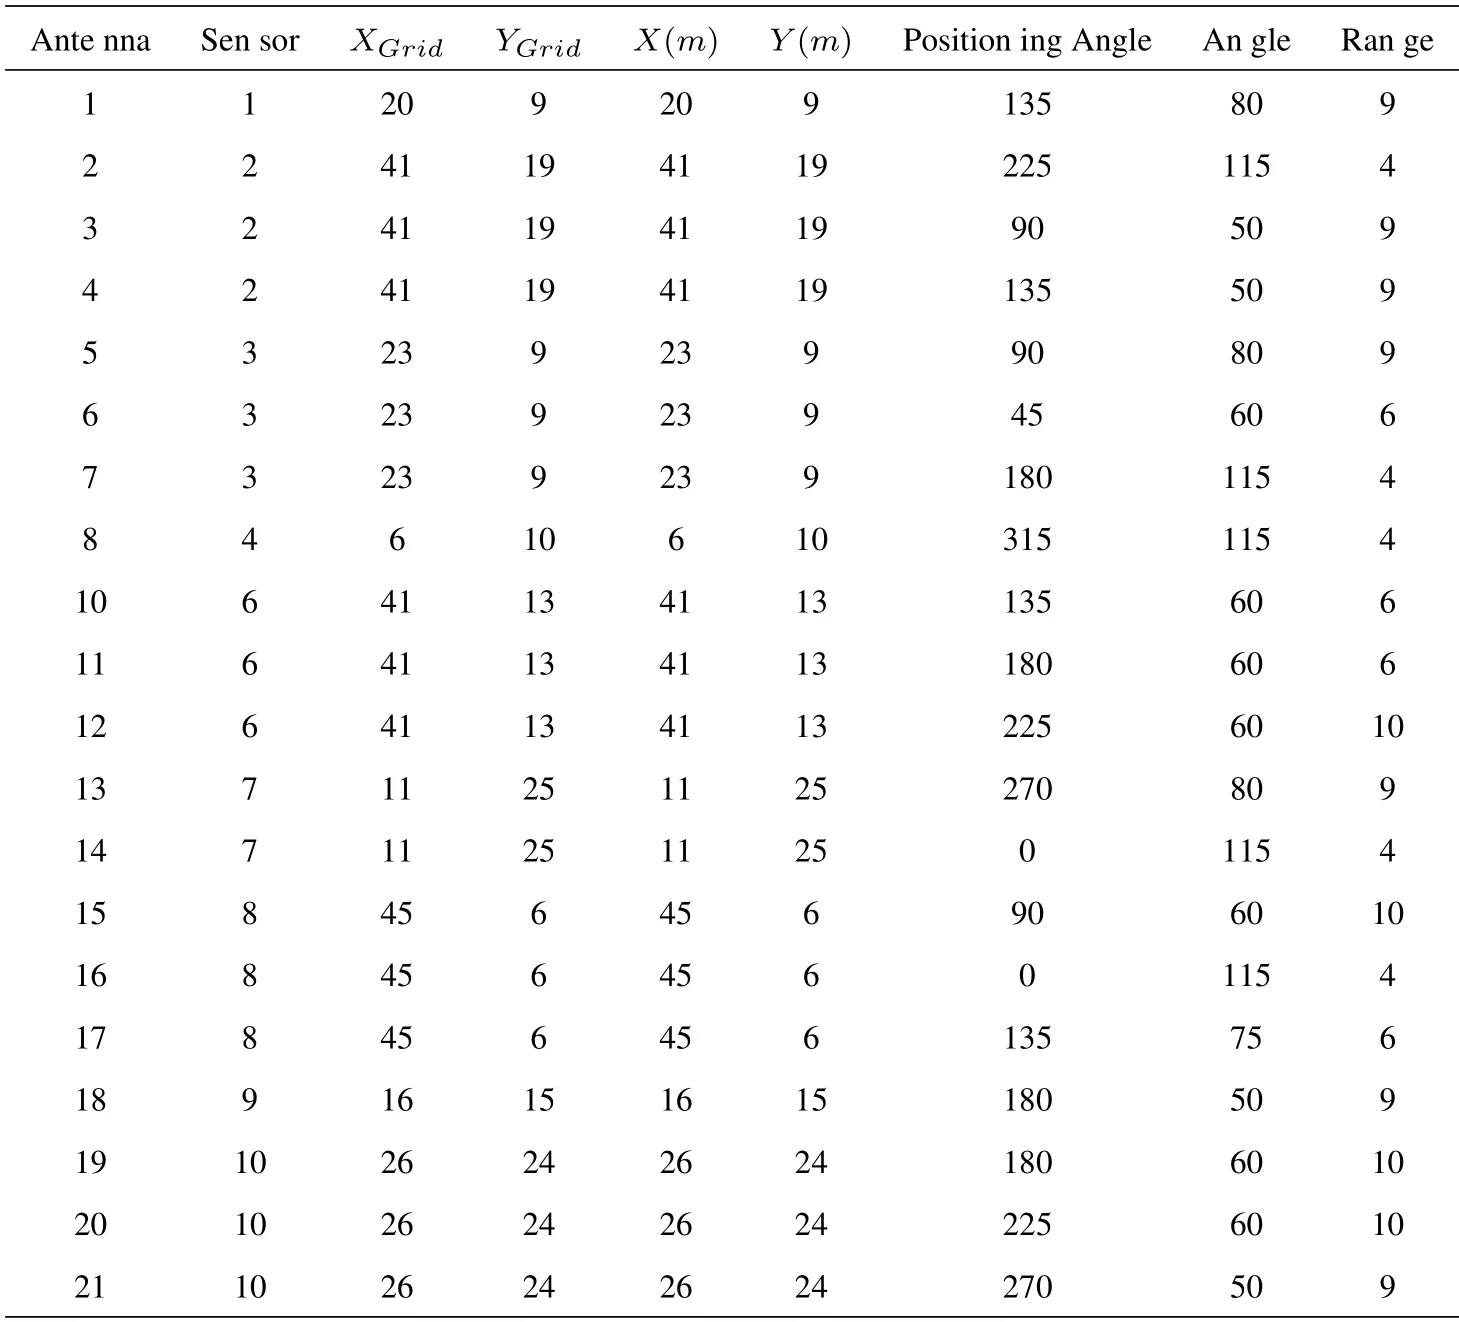
Table 13.Optimal antenna design for the second scenario.
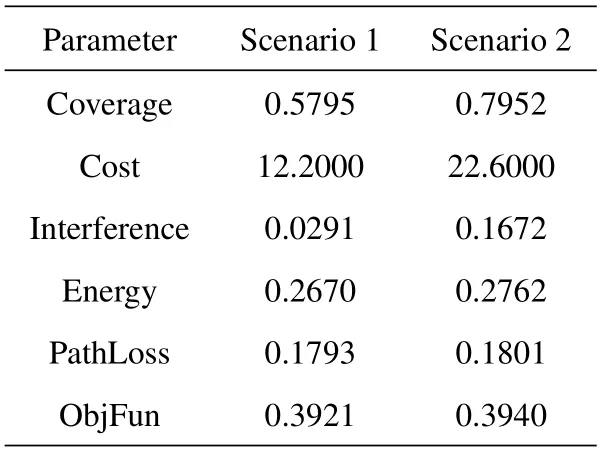
Table 14.Results of the GA algorithm.
As shown in Table 11,the total cost of the second scenario is higher than the first scenario,and as a result of this additional cost,network coverage in the second scenario is greater than in the first.It can be concluded that the more RFID readers and antennas on the network,the higher the overall network cost and the greater network coverage.
Details of readers and antennas designed for both scenarios can be summed up in Tables 12-13.
VI.DISCUSSION
GA is well-known as a powerful optimization method.Thus,GA converges quickly to the neigh-borhood of the solution,but it is very slow when it gets close to the solution.However,in terms of optimization performance,SA is superior.As a result,in this study,a combined algorithm of these two techniques was used to take advantage of both at the same time to provide a strong optimization method.
The performance of the combined algorithm for solving the RNP problem based on a GA and SA can be compared to the results of the GA.As shown in Tables 11 and 14,the combined algo-rithm based on a GA and SA performs better.
In order to compare the results of the proposed model with the researches done in the theoretical literature,three researches[8,12,58]have been used for comparison for the following reasons:
1.A comparison of the efficiency of the combined GA/SA algorithm used in comparison to other optimization algorithms;
2.A comparison of similar cases in the design of the sensor network in order to optimize the location of the sensor network in the hospital environment based on its limitations,priori-ties,and conditions,which is also the subject of the current research study.
3.Research comparison in terms of scale and network implementation budget in the scope and size of the current study.
These are the motivations behind selecting the three previously mentioned existing models to compare the results of this study with in order to better assess theefficiency of the combined al-gorithm based on a GA and SA.
Table 15 compares the ObjFun percent obtained from each scenario against other existing models in[8,12,58] to assess the effectiveness of the multiantenna RNP model with combined GA and SA algorithms.As can be seen,the model proposed in this study outperforms all other RNP models in terms of ObjFun%.
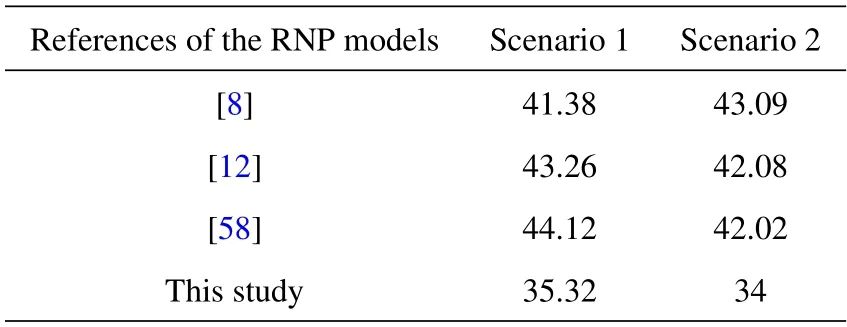
Table 15.Comparison of the results of ObjFun%.
VII.CONCLUSION
In this study,which was conducted in a hospital emergency department,multi-antenna radio fre-quency identification(RFID)s were investigated with the goal of minimizing costs while provid-ing maximum coverage.Because these two techniques are complementary,the algorithm used in this analysis is a hybrid of GA and SA.The outcomes of the two scenarios are then compared to existing RFID network planning models in the literature.
GA is not affected by initial onset parameters.This can be quickly repeated near the solution.Then,SA begins with good initial GA parameters,and only a few repetitions are required to achieve the best solution.This means that in the combined algorithm of GA and SA,GA is used in the first part of the optimization process and SA in the second part.GA initiates the first opti-mization phase and presents its results as the initial SA parameters for the second optimization phase.
It is demonstrated that the RNP model presented in this study outperforms the other RNP mod-els.Its main advantage is the use of RFID readers with multiple antennas to reduce the total cost of the RFID network while also increasing network coverage with fewer readers and antennas.
As a suggestion for future research,the RNP model can be used to predict the essence of the hospital plan.Furthermore,the RNP model can be modified based on the application specifica-tions.In other words,additional applications and case studies can be considered.
杂志排行
China Communications的其它文章
- A Survey on Channel Measurements and Models for Underground MIMO Communication Systems
- High-Performance Transmission Mechanism Design of Multi-Stream Carrier Aggregation for 5G Non-Standalone Network
- Predictive Tracking Implementation for Mobile Communication Using Programmable Metasurface
- Arbitrary Decode-Forward Relaying with Re-Encoded Bits Selection Strategy for Polar Codes
- Participants Recruitment for Coverage Maximization by Mobility Predicting in Mobile Crowd Sensing
- Distributed Edge Cooperation and Data Collection for Digital Twins of Wide-Areas