Participants Recruitment for Coverage Maximization by Mobility Predicting in Mobile Crowd Sensing
2023-08-26YuanniLiuXiLiuXinLiMingxinLiYiLi
Yuanni Liu ,Xi Liu ,Xin Li ,Mingxin Li ,Yi Li
1 School of Communication and Information Engineering,Chongqing University of Posts and Telecommunications,Chongqing 400065,China
2 School of Cyber Security and Information Law,Chongqing University of Posts and Telecommunications,Chongqing 400065,China
3 State Key Laboratory of Networking and Switching,Beijing University of Posts and Telecommunications,Beijing 100876,China
4 Research Institute,China Unicom,Beijing 100048,China
Abstract: Mobile Crowd Sensing (MCS) is an emerging paradigm that leverages sensor-equipped smart devices to collect data.The introduction of MCS also poses some challenges such as providing highquality data for upper layer MCS applications,which requires adequate participants.However,recruiting enough participants to provide the sensing data for free is hard for the MCS platform under a limited budget,which may lead to a low coverage ratio of sensing area.This paper proposes a novel method to choose participants uniformly distributed in a specific sensing area based on the mobility patterns of mobile users.The method consists of two steps: (1)A second-order Markov chain is used to predict the next positions of users,and select users whose next places are in the target sensing area to form a candidate pool.(2)The Average Entropy(DAE)is proposed to measure the distribution of participants.The participant maximizing the DAE value of a specific sensing area with different granular sub-areas is chosen to maximize the coverage ratio of the sensing area.Experimental results show that the proposed method can maximize the coverage ratio of a sensing area under different partition granularities.
Keywords: data average entropy;human mobility prediction;markov chain;mobile crowd sensing
I.INTRODUCTION
With the rapid development of sensor-rich devices(e.g.iPhone,Apple Watch,Google Glass,etc.) in the new age of Internet of Things (IoT),more and more of these smart devices can be used for large-scale and complex data sensing tasks.CISCO forecast that by 2030 up to 500 billion IoT devices will be connected to the Internet[1].Leveraging built-in sensors in mobile devices can enable a variety of IoT services.The Mobile Crowd Sensing(MCS)is a sensing paradigm,which combines people-centric sensing and crowdsourcing.A great number of users with mobile devices can cooperate with each other to form a sensing network and deliver sensing task.Due to advantages such as ubiquitous sensor nodes and rich types of sensing data,the MCS has attracted much attention from researchers[2].The development of MCS has led to various novel sensing applications,such as the air quality inspection application [3],the Creek Watch application [4],and the Nericell system [5].Especially in a radio environment,MCS-based information collection methods can help to optimize the radio regulation.Therefore,this paper introduces the problem of participant selection based on the dispersion properties,especially in radio environment crowd sensing,and also investigates how to select proper users to maximize the coverage ratio of a radio environment area,as well as improving the quality of sensing data.
The introduction of MCS also brings many challenges,like recruiting adequate participants to join various sensing tasks in diversified spatial sensing areas[6].In an area with few participants,the coverage ratio of the area is low,which may lead to low-quality sensing data,due to inadequate sensing information of some sub-areas.The MCS platform which plays the role of recruiting optimal participants,has to recruit adequate mobile users to maximize the coverage ratio,providing high-quality data for upper layer MCS applications.However,the data sensing and uploading to the MCS platform will cost a lot of battery energy and traffic fees.On the other hand,the data uploaded by users include private information,such as the movement trajectory,location,image and video information.These factors make users unwilling to perform sensing tasks without incentives.As a result,a lot of research has focused on the incentive mechanism,which aims at designing scheme to encourage participants with money,reputation credits or entertainment rewards,and so on[7].
However,considering participant mobility and uncertain behaviors,the trajectories of participants are uneven.Participants may not be able to cover the sensing area or only cover some sub-areas during moving[8].Moreover,participants can move in and out of sensing area dynamically.When a participant leaves the sensing area halfway,corresponding sensing tasks may not be completed.If the MCS platform recruits new participants to continue the tasks again,it will increase the cost of MCS platform,and also result in redundant data collecting[9].In reality,participant selection mainly depends on the Points of Interest(PoIs)of mobile users,in other words,the places people visit frequently [10].The PoIs can be predicted based on the historical trajectories of users.Combined with the location-based nature of sensing tasks,users can move probabilistically in the sensing area during daily moving.Therefore,taking the mobility of mobile users between PoIs into consideration,our research focuses on selecting participants to maximize the coverage ratio of sensing area.

Figure 1.9 participants with different locations cover a specific sensing area which is partitioned into 81 grids by a small granularity.(a)Participants with uniformly location distribution;(b) Participants with less uniformly location distribution;(c)Participants with the least uniformly location distribution.

Figure 2.9 participants with different locations cover a specific sensing area partitioned into 9 grids by a large granularity.(a) Participants with uniformly location distribution;(b)Participants with less uniformly location distribution;(c)Participants with the least uniformly location distribution.
In addition,in terms of space,the partition granularities of a sensing area also takes great importance to the coverage ratio.Sometimes,even the number of participants in a sensing activity is same,the ratios will be different under different partition granularities[11].As shown in Figure 1 and Figure 2,a sensing area is divided into 81 and 9 grids,corresponding to a small and a large partition granularity respectively.In Figure 1,when the sensing area is divided into 81 grids under a small partition granularity,the changes in PoIs of 9 participants have no different on the coverage ratio.They can only cover 9 out of 81 grids.However,when the same sensing area is divided into 9 grids under a large partition granularity,the changes in PoIs of 9 participants will make different coverage ratios.Specifically,in Figure 2(a),9 participants can cover all the 9 grids,while in Figure 2(b),the 9 participants can only cover 6 out of 9 grids.Worse while,in Figure 2(c),9 participants can only cover 3 out of 9 grids.Therefore,the location distribution has a great impact on the coverage ratio of sensing area.Moreover,in a sensing area with different granular sub-areas,it is of great significance to select participants that distribute uniformly to maximizely cover the area.
Due to insufficient participants,the unbalanced trajectories of participants may cause a low coverage ratio of sensing area,ultimately lead to low-quality data.This paper proposes a participant selection method based on the mobility pattern of participants,which is divided into two steps: (1) a candidate pool construction based on the historical trajectories of mobile users,(2)the participant selection from the candidate pool.This method can select a certain number of sensing users with the most uniform distribution under different partition granularities.The contributions of this paper are as follows:
1.This article analyzes the historical trajectories of mobile users and extracts PoIs to obtain their representative mobility patterns.Moreover,a second-order Markov chain is utilized to predict the next moving PoIs of mobile users by learning their mobility patterns.By selecting users whose next PoIs in the target sensing area,the Markov chain-based position prediction method can form a candidate pool.
2.This paper presents a Data Average Entropy(DAE) method to measure the location distribution of candidates in a specific sensing area.Candidates are selected according to the changing information of their predicted positions.Furthermore,the participant who can maximize the DAE value of a specific sensing area with different granular sub-areas is chosen to maximize the coverage ratio of the sensing area.
3.The trajectory dataset of mobile users is used to evaluate the prediction accuracy of the secondorder Markov chain,and also appraise the coverage ratio of sensing area of the proposed participant selection method.The experimental results show that the proposed method can choose wellsuited participants to maximize the coverage ratio under different partition granularities.
The rest of the paper is organized as follows.In Section II,the related works are introduced.In Section III,a system overview is described.Section IV describes a position prediction method of mobile users based on a second-order Markov chain.Section V presents the DAE for participant selection.The experiments are conducted in VI.VII is the conclusion and future work.
II.RELATED WORKS
A number of incentive mechanisms for the participant recruitment of MCS have been proposed[12–18],such as the entertainment-based,reputation-based and money-based incentive mechanisms et al.In[12],Lin et al.proposed a money-based Multi-Round Incentive Mechanism (MRIM) for the insufficient participants when the MCS system just released tasks.To reduce the payment of clients,Ueyama et al.[13] proposed a gamification-based incentive mechanism that allows users to obtain different rewards based on the game ranking,while gaining a sense of satisfaction.In[14],Zhang et al.designed a truthful auction mechanism to deal with the situation that participants may drop out of sensing activity due to their uncertainty mobility.In[15],Wang et al.designed a dynamic truthful incentive mechanism(DTIM)which includes winner selection and payment decision process,aiming to deal with the problem of the difficulty of recruiting appropriate participants and the complex payment due to the uncertainty of mobile users.In[16],Sun et al.presented a privacy protection incentive mechanism considering the cost of privacy leakage,which provided personalized payment according to different privacy information.In[17],Hu et al.proposed a demand-driven dynamic incentive mechanism that dynamically adjusts the reward of each task considering the demand indicator such as deadline,completion progress and the number of mobile users around,to balance the popularity among tasks.In [18],Li et al.designed an online strategy-proof incentive mechanism to minimize the social cost of the system.In[19],Wang et al.utilized a social network as a recruitment platform and select a user subset from mobile social networks as an initial seed,which forwarded tasks through the social network.They also proposed two algorithms named basic selector and fast selector,to select a group of nearly optimal users as the seed.
Participants always follow their natural mobility to collect data.However,since the uncertainty and uncontrollability trajectories of participants,their mobility is essentially skewed.In [20],Song et al.aimed at human mobility and concluded that all human mobility can be predicted.Furthermore,Hariharan et al.modeled the position transitions of individuals by using Markov processes in[21],and Krumm et al.incorporated factors such as land-use information to help the position prediction in [22].In [23],Comito et al.introduced a next-location prediction framework named NexT,which combined the mobile behavior over time,recent location visited,and global mobility within the geographical area to predict the next position of a user.In [24],Abdel-hamid et al.proposed an optimal framework for the recruitment problems in vehicular crowd sensing.They formulated a mixed integer programming model to select a subset of participants with respect to a set of constraints.In[25],Abdelhamid et al.proposed a reputation-aware budgeted maximum coverage algorithm for vehicles recruitment.The algorithm aimed to maximize the coverage ratio of sensing area while minimizing the costs of MCS platform.In [26],D.Ashbrook et al.introduced PoI.The PoI can be predicted according to the history trajectories of participants,improving the accuracy of mobility prediction.They took the participants mobility into consideration,but they did not recruit well-suited participants to maximize the coverage ratio of sensing area with different granular sub-areas.In [27],Wang et al.proposed an efficient prediction-based recruitment for MCS,which separated mobile users into two groups corresponding to two plans: pay as you go and pay monthly.They first utilized a semi-Markov process to predict the time when users arrive at PoIs.Then the probability of inter-user contact was computed based on the prediction result.Consequently,the minimizing cost problem aimed at recruiting users who own the greatest probability of contact with sensing area.However,for the dependency properties of Markov chain,the oversimplifying representation of first-order network may lead to inaccurate results.A task assignment framework of participatory sensing named PSTasker was proposed in [28] and [29].The PSTasker maximized the utility of participatory sensing platform by coordinating the assignment of multiple tasks.In[30],Lai et al.designed a duration-sensitive task allocation model to maximize the number of completed tasks within the limited time and capability of each user.In [31],Liu et al.studied an online user recruitment dynamic strategy with real pricing to improve the number of completed tasks with the constraint of budget and time.
Many data estimation methods have been proposed in the MCS to select proper participants who can contribute high-quality data for sensing tasks.In general,the coverage ratio of sensing area is predefined before the start of sensing activities.The purposes of these methods were to reduce the total rewards paid to recruited participants while ensuring the coverage ratio can reach the predefined value [32,33].Besides the coverage ratio,the value of data can also be specified by sensing owners or experts [34].In [35],Wang et al.explored the problem of quality-guaranteed online task allocation in the compressive crowd sensing,and proposed a so-called (ε,p%)-quality metric to quantify sensing data.The metric indicated that the inference error of participant which exceedsp%,has a sensing period lower thanε.In [36],Song Z.et al.took the granularity and quantity of data into consideration,and introduced a quality-aware metric.A mobility prediction model was proposed to estimate the quality of data collected by participants.In[37],Gao et al.designed a learning-based credible participant recruitment strategy(LC-PRS)to maximize the interests of the participants and platform,which includes reward allocation and participant recruitment.When recruiting participants,the data quality of participant was first predicted through a semi-Markov model,and then a game theory was employed to help the platform recruit participants.In [38],He Z.et al.proposed a greedy approximation algorithm in vehicular crowd sensing to quantify the quality of data in terms of spatial and temporal coverage ratio,considering the fraction of covered sub-areas.In [39],CrowdLet used a service quality metric to measure the quality of MCS task performing by jointly taking the ability of workers and task rewards into account.A dynamic programming algorithm was proposed to maximize the expected service quality.In[40],Chen et al.researched how to select participants to maximize the coverage quality with a limited budget in environmental monitoring.They divided the large sensing area into multiple sub-regions first and chose a sample point whose quality represents the quality of sub-regions,and then selected users who can cover the maximum sample points by a greedy algorithm.In [41],Liu et al.observed that sensing context has a significant impact on data quality,which motivates them to propose a context-aware data quality estimation scheme.They trained a context-aware classifier with historical sensing data,which captured the relation between context information and data quality to guide the participant recruitment in the MCS.In[42],Yang et al.designed an effective predictor based on a bi-directional long short-term memory neural network to predict the mobility patterns of participants.A greedy algorithm named uMax was proposed to maximize the utility of requester under a given budget constraint.
In summary,a lot of previous research has focused on participants recruitment in MCS,mainly from incentive mechanism,task allocation and coverage.Meanwhile,the constrain and method is different for different scenarios[25,32,37,40,42].Ahmed et al.[32] aimed at reducing recruitment costs under predefined coverage constrains,Gao et al.[37] aimed at maximizing benefits for participants and platform,Ref.[25,40,42] aimed to maximize coverage problem,which is similar to this paper.Abdelhamid et al.[25] combined reputation,budget and trajectory to select users who can maximize coverage by greedy algorithm.Chen et al.[40] also used greedy algorithm to choose participants whose coverage reward is highest in each area sample point.While both Ref.[25,40]used simulation to conduct the trajectory of users and coverage ratio.Yang et al.[42]focused on the prediction of staying time of user in PoI,and designed an uMax algorithm to choose user whose staying time is the longest in PoI.However,these work did not take into account the effect of user location distribution.Therefore,the proposed method in this paper is different from above related works in following aspects:(1) The optimization problems considered in related works are different from that considered here,with different assumptions and objectives.(2) This paper comprehensively considers the mobility of users and the location distribution of participants which measured by DAE.
III.SYSTEM OVERVIEW
Supposing that the MCS platform publishes a sensing task of collecting information under a limited budget.Considering the dispersion of radio environment and the sparsity of radio information in terms of space,the partition granularity of sensing area is relatively large.To maximize the coverage ratio of a sensing area,the MCS platform has to choose well-suited participants to join the sensing task,obtaining high-quality sensing data.As analyzed in Section I,the participants uniformly distributed in sensing area will get the maximum coverage ratio.However,since trajectories of a user are uncertain,and the user may move out of the sensing area due to its mobility during the sensing period.The uneven position distribution of participants and the different granular sub-areas contained in sensing area can lead to redundancy or lack of sensing data.The low-quality sensing data is impossible to satisfy the data requirements of upper layer applications.To deal with these problems,this paper proposes a DAE-based participant selection method.As shown in Figure 3,the method uses two stages to select proper participants,including the users’ mobility between PoIs predicted by the Markov chain and the location distribution of candidates calculated by the DAE,to maximize the coverage ratio of a sensing area.

Figure 3.The participants selection method of MCS platform.
In the first stage,this paper leverages a second-order Markov chain to select candidates.Assuming the budget of a crowd sensing platform isB,the recruitment cost of each participant isc,and the maximum number of participants that the platform can recruit isµ,µ ≤B/C.All the mobile users who are interested in the sensing task can be denoted asU={u1,u2,...,un}.Considering the mobility of users,the MCS platform will leverage Markov processes to analyze the historical trajectories of each user,and predict the next PoIs of each user.The user whose next PoI is in the target sensing area is chosen to form a candidate pool,which is denoted asV={ui},where 1≤i ≤n.
In the second stage,this article aims to select participants who can maximize the coverage ratio of sensing area,calculated by the DAE.Due to the uneven location distribution of candidates,the coverage ratio of sensing area is low.To solve this problem,this paper leverages the DAE method to measure the location distribution of candidates in the sensing area with different granular sub-areas.The candidates with the highest DAE value will be selected as the optimal participants to join the sensing tasks,which can maximize the coverage ratio of sensing area.The selected participants can be denoted asW,andW ⊆V.
IV.PARTICIPANTS POSITION PREDICTION BASED ON SECOND-ORDER MARKOV CHAIN
In this section,the staying position detection method is first described,and then a rule is set to extract the PoI.Further more,the second-order Markov chain is established to predict the position.
4.1 Staying Places Detection
The staying places detection aims to analyze the historical trajectories of mobile users who are interested in the sensing task,and extract the staying places of these users during moving.The historical trajectories can be obtained from GPS records.The GPS records are a series of time-sequence that contains timestamp and geographical coordinate of each mobile position.The GPS records of a user is represented asT,T={L1,L2,...,Ln}.Liis a recorded position at timei,andLi=xi,yi,ti.(xi,yi)represents a certain geographical coordinate,expressed in terms of latitudexiand longitudeyi.tiis the timestamp when the position was recorded.Considering the nonnegligible error in the GPS records,the paper utilizes K-Means clustering algorithm to extract the stopover positions of users.When a user stays at a place that the distance among coordinates is less than ∆dexceeds the time threshold ∆t,it can be determined that the position is a stopover position.
The K-Means clustering algorithm is a classic distance-based clustering algorithm.The clustering process uses the Euclidean distance between points as an evaluation index.The smaller the Euclidean distance is,the more similar the two points are.The basic idea of the algorithm is to randomly initialkcluster center points in records,then calculate the Euclidean distance from each sample points to the cluster center points respectively.These Sample points are classified into the nearest cluster center point.Repeatedly calculating the center distance of each cluster and comparing the Euclidean distance,until the classification does not change.The GPS records will be divided intokclusters.The minimum value of the sum of distances from all sample points to their center points is calculated in(1).
whereSirepresents the GPS records,xiis a single record inSi,andujis a center point.After clustering,each cluster is regarded as a stopover position.
4.2 POI Extraction
The PoI extraction is responsible for selecting positions with higher frequency as the PoIs of mobile users,according to the visitation frequency of users to staying places.There is a certain mobility pattern among PoIs transition,which can improve the accuracy of position prediction.Given a set ofNclusters,the PoIs extraction is performed in the following three steps:
Step 2:Evaluating whether clusterjis a PoI.Counting the visitation numberNTof a user to the clusterj.IfNTis greater thanf,the clusterjis regarded as a PoI.
Step 3:Repeating the above steps until all stopover positions have been evaluated.After extracting all PoIs,the cluster center points can be used to represent the PoIs,as shown in Figure 4.

Figure 4.A cluster of staying places are represented by points.
4.3 Building the Second-Order Markov Chain
The position prediction aims to utilize a second-order Markov chain that has learned the movement pattern among PoIs,to predict the next PoIs of mobile users.Users whose next PoI is in the target sensing area,are regarded as candidates and added to a candidate pool.
The Markov chain is a stochastic model describing a series of possible events.The probability of each event only depends on the states attained in the previous and current events.Therefore,in order to predict the next PoIs of mobile users through the Markov chain,the probabilities of position transition among all PoIs should be calculated,namely the probability transition matrix.For example,for a first-order Markov chain,in order to obtain the transaction probability of a user moving from PoIAto PoIB,it needs to calculate the number of users leaving from PoIA,denoted asm,and the number of the users arriving at POIB,denoted asn.The transition probability of the user from PoIAto PoIBcan be expressed asPAB=n/m.The transition probability matrix of first-order Marklov chain can be used to predict the probability of reaching each PoI after movingntimes,which is represented as(2).
whereXi=xirepresents the probability that the reaching PoI isxiafter movingitimes.Therefore,in the first-order Markov chain,the probability only depends on the current PoI.However,in a secondorder Markov chain,Xiis affected byXi−1andXi−2,wherei ≥2.Inkthorder Markov chain,Xican be byXi−1,Xi−2,...,Xi−k.With the increasing order of Markov chain,the prediction accuracy will be higher,but the computational complexity will also increase [29].In this paper,considering the computational complexity and prediction accuracy,a secondorder Markov chain is chosen to predict the next moving POIs of users,which can improve theaffected accuracy of prediction,as well as avoiding the complex computation of higher-order Markov chain.If the predicted PoI is in the target sensing area,the corresponding user will be selected as a candidate for the sensing task,or else,the user will not be a candidate.
V.PARTICIPANT SELECTION BASED ON DAE
This section will present an optimizing method for participant selection,namely DAE,which is used to measure the location distribution of candidates,and to select candidates for a sensing task,as well as maximizing the coverage ratio of a specific sensing area.
5.1 The DAE Method
The DAE method aims to select appropriate participants to uniformly cover the target sensing area.As analyzed in Section I,the sensing area is divided into small grids under different partition granularities.It can be illustrated that even if the number of participants is the same,the coverage ratio may be different due to the location distribution of participants.Therefore,it is necessary to measure the distribution of candidates in the target sensing area.
The coverage ratio of sensing data is measured by the entropy of data at different partition granularities,which is quantified to improve the patterns of participant selection.Considering the data balance at different granularities,this paper proposes the DAE to assess the entropy of sensing data.The DAE is similar to the information entropy in information theory.The information entropy describes the average amount of information contained in each message.Similarly,the DAE value is also the average value of the data distribution entropy at each granularity.As the entropy increases,the sensing data becomes more balanced,and the coverage ratio of a specific sensing area becomes greater.When the entropy reaches the maximum value,it means that the positions of participants are evenly distributed in each grid of the sensing area,and the corresponding participants can be obtained from the candidate pool.In the DAE-based participant selection method,E(B)is the coverage ratio,which is defined in(3).
And he asked his parents consent that he might marry the girl who had saved him, and a great feast was made, and the maiden became a princess, and in due time a queen, and she richly deserved all the honours showered upon her
wherekrepresents the number of grids of sub-areas with different partition granularities,kmaxis the maximum number of grids,w(k) is the weighting factor of a sub-area divided intokgrids,andE(B(k))is the data entropy of each sub-area.Similar to the information entropy,E(B(k))is defined as(4).
whereB(i,j | k)represents the amounts of collected data in a grid (i,j) of the sub-area.S(B) is the sum amounts of collected data in the sub-area,which is calculated in(5).
Supposing the budget of MCS platform isB,and the number of mobile users who are interested in the sensing tasks is denoted asu.The reward of MCS platform paying to each user isR.Then the number of participantsucan be denoted asAfter users are formed to a candidate pool,the MCS platform selects a certain number of participants to join sensing task,maximizing the coverage ratio of sensing area according to the budget.However,Yang et al.[43]have proved that the problem of recruiting participants from a candidate pool limited by a budget is a NP hard problem.Therefore,this article leverages a greedy algorithm to find a near-optimal solution.Compared with(5),theE(B(k))can be denoted as(6).
Initially,we setS(B)=0 andE(B(k))=0.When the sensing area is divided into different granularities,E(B(k))is calculated firstly,and then the participant who can maximize theE(B(k)) in each granularity is selected to maximize the coverage ratio of sensing area.
VI.NUMERICAL RESULTS
In this section,the related experiment is conducted to evaluate the feasibility and validity of the Markov chain-based position prediction and DAE-based participant selection methods.In experiments,different orders of Markov chains are compared in terms of prediction accuracy.Moreover,the utility of the proposed participant selection method will be discussed in respect of the DAE value and coverage ratio.
6.1 Experimental Setup
The second-order Markov chain is written in java and run on a PC with 16G memory and Intel Core i5 3.4GHz.The data set for these experiments are from a GeoLife GPS trajectory dataset[43],which is collected in a Geolife project by 182 users in a period of over three years.The dataset contains 17621 records with a total distance of about 1.2 million kilometers and a total duration of more than 48000 hours.The recorded outdoor movements of users include not only their life routines from home to work,but also some entertainment and sport activities,such as shopping,dining,hiking and cycling.Each GPS trajectory contains latitude,longitude,time,and altitude information.
Considering the dispersion of radio environment and the sparsity of radio information in terms of space,the sensing area is divided into grids with multiple coarse granularities,such as 10×10,8×8 and 6×6.The recruitment cost for each participant isc.The maximum budget of MCS platform isBmax=30c,which means the MCS platform can choose up to 30 participants to join the sensing task.In this paper,the DAE-based participant selection method is compared with three benchmark algorithms,which are the random selection method,the naive selection method and the uMax algorithm,and each method will choose up to 30 participants in different way.The random selection method and the naive selection method are benchmark algorithms widely used for participants recruitment.The random selection method chooses participants from the candidate pool randomly.The naive participant selection method selects users that can cover a single-granularity sensing area.The uMax algorithm proposed in Ref.[42] is used to select participants who may stay in the sensing area for a long period based on prediction results.Furthermore,to ensure the consistency of experimental conditions,the experiment does not take the budget constraint into consideration.
6.2 Performance Evaluation
6.2.1 Comparisons of the Prediction Accuracy
In the mobility prediction experiments,A six-day trajectory dataset is extracted from [43] of each user.In order to obtain the representative mobility patterns of users,the trajectory dataset is preprocessed.The data is clustered based on the number of clusters first.Then,the cluster with low visitation frequency was filtered.Finally,the trajectory data was described as moving among 2,4,6,8,10,12,14,16 or 18 PoIs respectively,corresponding to the number of clusters.The trajectory data of the previous five days is extracted to construct the probability transition matrix of the Markov chains.The extracted dataset contains 1958 records of each user.The matrix predicts users’ mobility trajectory on the last day.The effectiveness of Markov chains of different orders is verified by comparing the prediction accuracy of the three Markov chains.Prediction accuracy is the ratio of the number of correct predictions of the next PoI to the total number of PoIs,which can be calculated as(7)
wherePAis the prediction accuracy,Trpresents the number of correctly predicted PoIs,andTeis the number of incorrectly predicted PoIs.
Figure 5 is the comparison of the prediction accuracy of the three Markov chains.As shown in this figure,when the user moves between 2 or 4 PoIs,the prediction accuracy of each Markov chain reaches 100%.As the number of PoIs increases,the prediction accuracy of the three chains decreases.Meanwhile,as the order of the Markov chain increases,the prediction accuracy improves gradually.The reason is k-order Markov chain will consider the previous k-1 PoIs,and the more PoIs considered,the higher the prediction accuracy.Therefore,as is shown in Figure 5,the thirdorder Markov chain has the highest prediction accuracy,followed by the second-order and the first-order Markov chains.However,as the the order of Markov chain increases,the computation is more complex.
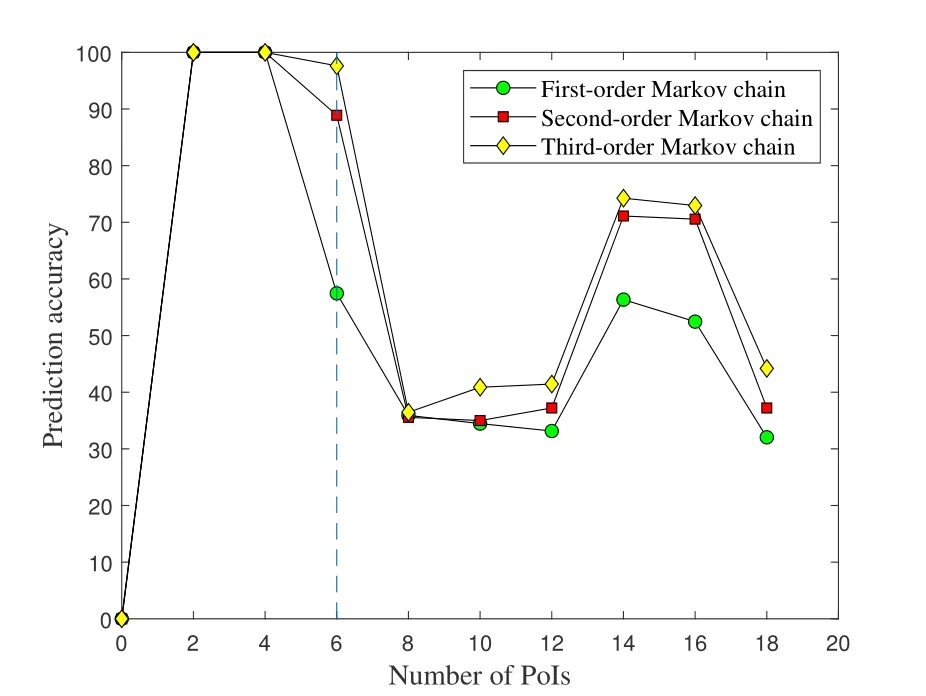
Figure 5.Comparison of the prediction accuracy of mobility.
6.2.2 Comparisons of Coverage Ratios
In the participant selection experiments,by clustering and filtering,the extracted trajectories are divided into five PoIs,namelyA,B,C,DandEin Figure 6.The visitation frequency of these PoIs is compared.The PoIEwith the highest frequency is chosen as a target sensing area.After the PoIs prediction of users,there are 42 participants whose next PoIs at the target sensing area to form a candidate pool.The DAE value and coverage ratio among the proposed participant selection,naive participant selection,random participant selection and uMax-based participant selection methods are compared experimentally.
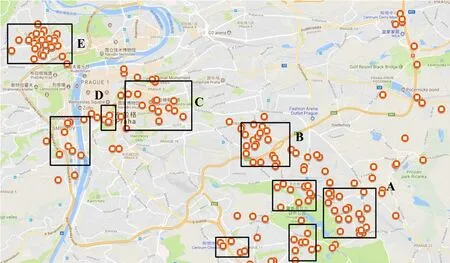
Figure 6.The PoIs with the highest visiting frequency.
Figure 7 illustrates the comparison of DAE value among the four methods with different number of experiments.In this scenario,the sensing area is divided into 10×10 and 8×8 respectively.The number of candidates is 30.As shown here,the proposed method has the highest DAE value giving the same experiment number.The naive participant selection method can only choose participants who can cover the sensing area with a single partition granularity.The random participant selection method does not consider the partition granularity of sensing area when selecting participants.As analyzed in Section I and Section V,due to the different partition granularities of sensing area,the two methods lead to low DAE value.The uMax algorithm predicts users’ mobility and selects participants who are more likely to stay in the target sensing area,increasing the value of DAE,while the DAE-based participant selection method further selects participants uniformly distributed in the sensing area with different granular sub-areas,maximizing the DAE value.
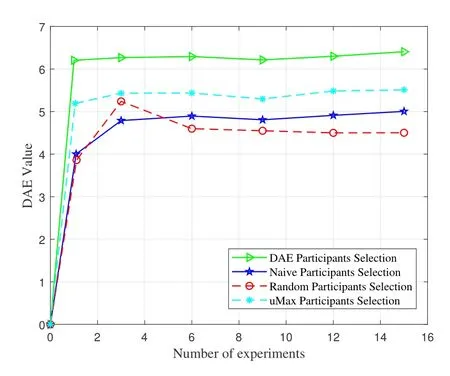
Figure 7.The DEA vlaue comparison of the four participant selection methods with different number of experiments.
Figure 8 illustrates the comparison of DAE value among the four methods with various number of participants.In this scenario,the sensing area is divided into different granularities,which is divided into 10×10,8×8 and 6×6 respectively.As shown here,the DAE value increases with the increasing number of participants selected by the four methods.The naive participant selection method chooses participants to cover the most of sensing area.Since the random participant selection method and uMax algorithm may select multiple participants in the same grid,there may be overlaps in the coverage area of participants,reducing the DAE value.As a result,the proposed method owns the highest DAE value by selecting participants uniformly distributed in the target sensing area,where each selected participant covers different grid.
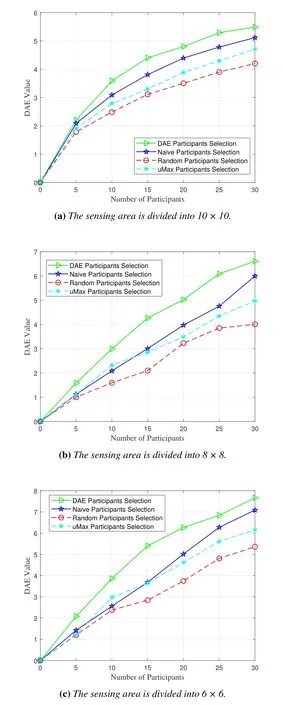
Figure 8.The DEA vlaue comparison of the four participant selection methods with different number of participants.
Figure 9 compares the DAE values of different partition granularities when there are 30 participants.It can be derived that the larger the partition granularity,the larger the DAE value may be.The reason is that the location of participants is more widely distributed in the coarse-grained partition,which may make more participants with heavy weights cover the same grid.Moreover,the proposed method has highest DAE value at different partition granularities.
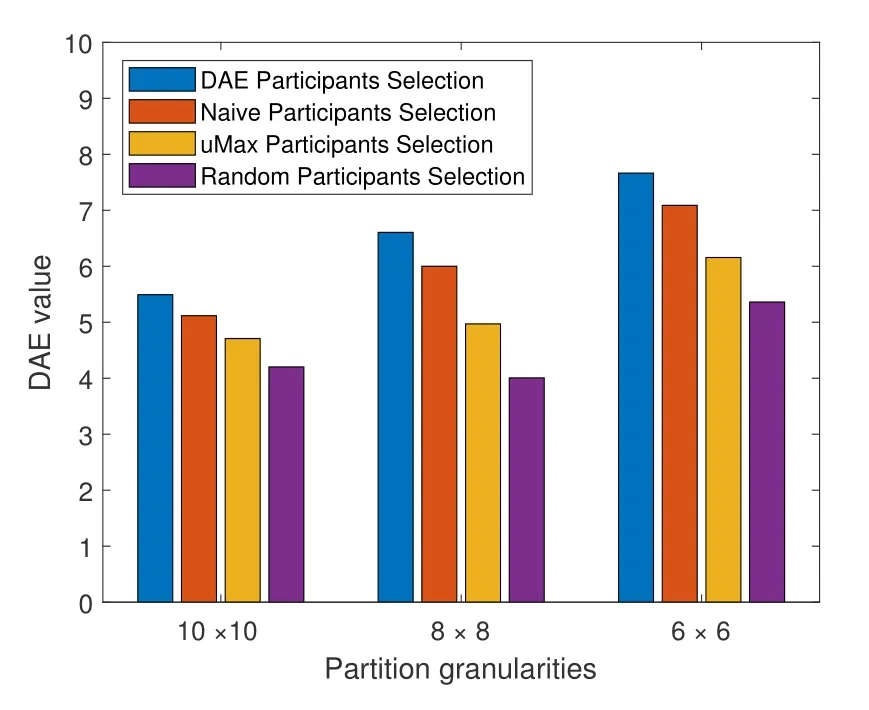
Figure 9.The DEA vlaue comparison of the four participant selection methods with different distribution granularities.
Figure 10 illustrates the comparison of coverage ratio among the four methods with different number of participants.In this scenario,the sensing area is divided into 10×10,8×8 and 6×6 respectively.It can derived from Figure 10 that when the number of participants increases,the coverage ratio of sensing area increases.The reason is that the more participants recruited,the more cells of the sensing area can be covered,leading to a higher ratio.As described in Figure 10,when the sensing area is divided into different granularity,the DAE-based participant selection method has the highest ratio,followed by the uMAx algorithm.The naive participant selection method works better than the random participant selection method.Therefore,the participants selected by the proposed method get the highest coverage ratio of sensing area under different partition granularities.

Figure 10.The coverage ratio comparison with varied number of participants.
Figure 11 compares the coverage of different partition granularities when there are 30 participants.It can be inferred that the different distribution granularity may have different coverage,and the coverage is higher when the partition is coarse-grained.However,the proposed method can obtains fine coverage regardless of the partition granularity.

Figure 11.The coverage comparison of the four participant selection methods with different distribution granularities.
Moreover,The experiment also evaluates the coverage ratio impacted by the DAE value.As shown in Figure 12,the coverage ratio increases with the increasing DAE value.The DAE reflects the distribution of selected participants.A higher DAE value means that the distribution of participants is more uniform in the sensing area.By selecting participants who can maximize the DAE value,the coverage ratio of sensing area can be maximized.
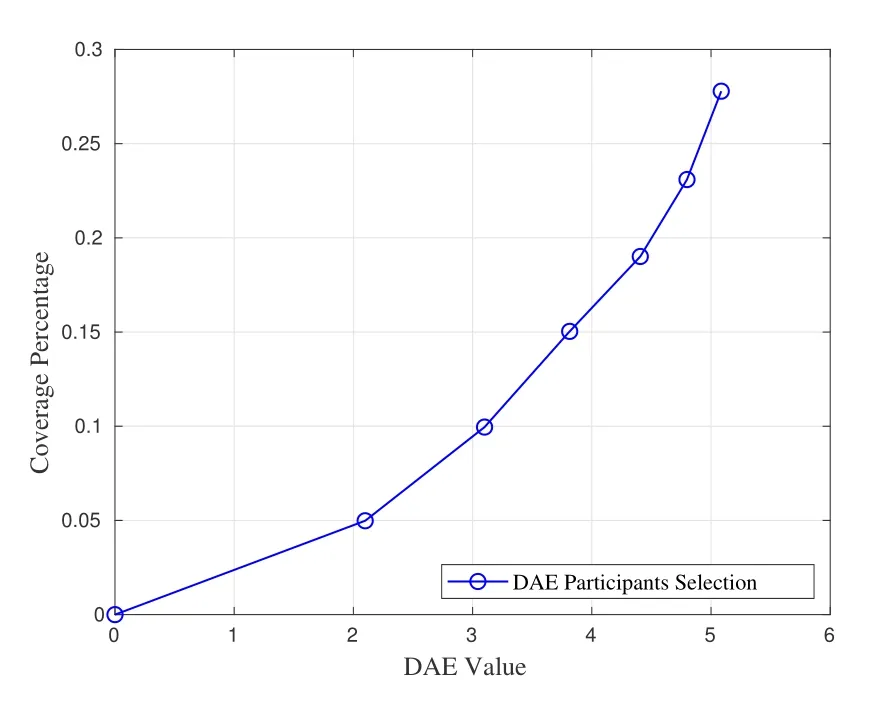
Figure 12.The relationship between coverage ratio of the sensing area and DAE value.
VII.CONCLUSION
In this paper,a novel participant selection method has been proposed in the MCS for selecting participants to maximize the coverage ratio of a sensing area with different granular sub-areas.When recruiting participants to maximize the coverage ratio,the mobility of users is considered.Compared with the existing methods,the simulation results show that the proposed participant selection method can be used to efficiently select participants,improving the coverage ratio.In the future,we will consider the inaccuracy data records inherent in GPS,and study how to extract accuracy data.
ACKNOWLEDGEMENT
This work is supported by the Open Foundation of State key Laboratory of Networking and Switching Technology (Beijing University of Posts and Telecommunications)(SKLNST-2021-1-18),the General Program of Natural Science Foundation of Chongqing (cstc2020jcyj-msxmX1021),the Science and Technology Research Program of Chongqing Municipal Education Commission (KJZD-K202000602)and Chongqing graduate research and innovation project(CYS22478).
杂志排行
China Communications的其它文章
- A Survey on Channel Measurements and Models for Underground MIMO Communication Systems
- High-Performance Transmission Mechanism Design of Multi-Stream Carrier Aggregation for 5G Non-Standalone Network
- Predictive Tracking Implementation for Mobile Communication Using Programmable Metasurface
- Arbitrary Decode-Forward Relaying with Re-Encoded Bits Selection Strategy for Polar Codes
- Distributed Edge Cooperation and Data Collection for Digital Twins of Wide-Areas
- Discrete Phase Shifts Control and Beam Selection inRIS-Aided MISO System via Deep Reinforcement Learning